7 Best Mutual Fund Screeners for 2027
Every mutual fund screener filters on expense ratio. Which ones let you screen on risk, and put ETFs in the same list, without paying?


A mutual fund screener filters thousands of funds down to the ones that meet your conditions, such as a maximum expense ratio, a minimum track record or a risk measure. Screeners differ in how many filters they carry, whether ETFs sit in the same list, and what they charge to go further.
Below are 7 mutual fund screeners for US investors. We compare them on what runs at no cost, ETF coverage, risk filters, fund flows, export, API access and price.
Why one index can cost 0% or 1.29% a year
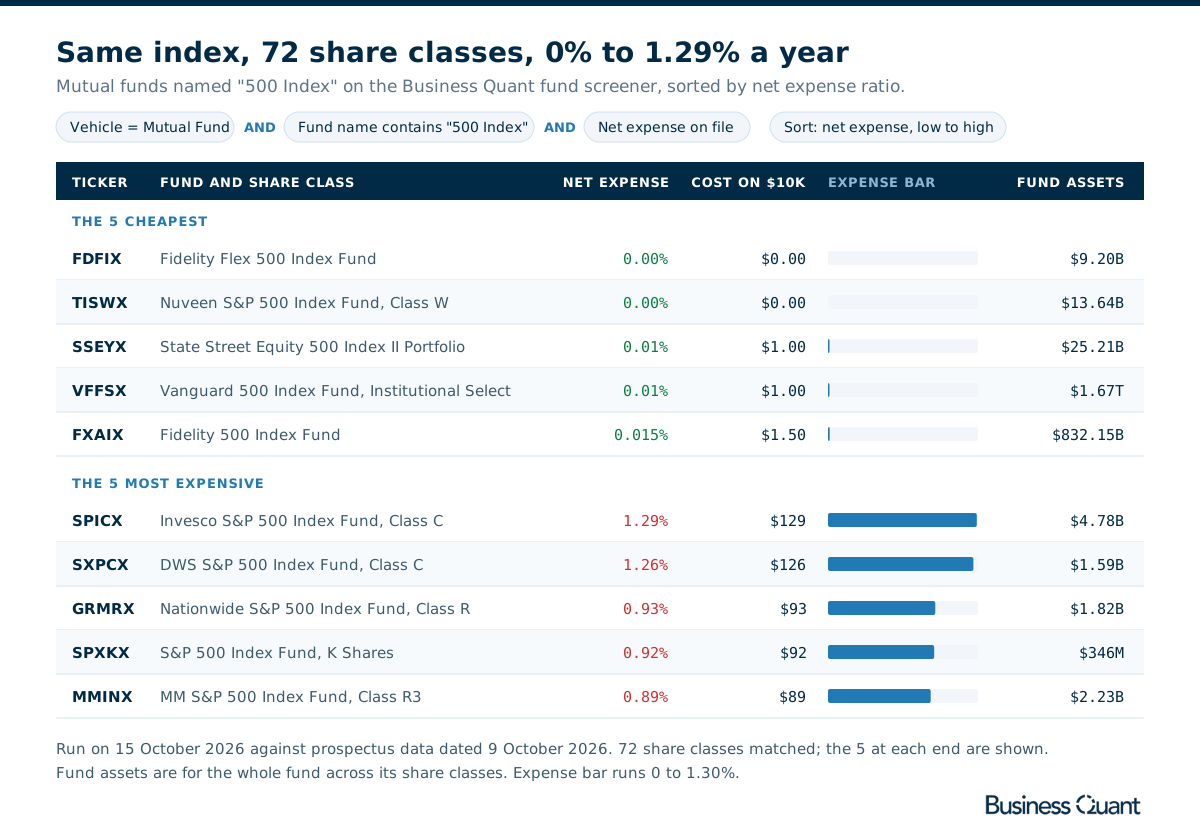
Our screen on 15 October 2026 for mutual funds with "500 Index" in their name returned 72 share classes, with net expense ratios from 0% to 1.29% a year. On $10,000, that is the difference between paying nothing and paying $129, every year, for exposure to the same 500 companies.
The share class is where most of that gap hides. The Vanguard 500 Index Fund is one portfolio sold 4 ways: 0.14% in Investor shares, 0.04% in Admiral shares, 0.01% in Institutional Select shares and 0.03% as the VOO ETF. A screener that lists one row per fund, or puts ETFs in a separate tool, cannot show you that a cheaper wrapper sits next to the one you hold.
Returns are the other trap. Trailing returns reward whichever fund took the most risk in a rising market, so a Sharpe ratio or a standard deviation filter asks the better question, return per unit of risk.
How to choose a mutual fund screener
- Cost filters. Net expense ratio at minimum; loads and fees if you buy load funds.
- Risk measures. Sharpe ratio, standard deviation, beta and drawdown.
- Returns by period. 1, 3, 5 and 10 years, and calendar years.
- Holdings and exposure. Sector weights, asset mix and bond duration.
- ETFs in the same screen. So a fund and an ETF can be ranked on one fee.
- The free line. What runs at $0, and what costs extra.
If you only screen ETFs, our ETF screener comparison covers that job.
The 7 mutual fund screeners at a glance
| Platform | Best for | Plans from |
|---|---|---|
| Fidelity | Screening with Morningstar ratings | $0 |
| Morningstar | Analyst ratings and fund research | $20.75/mo |
| Portfolio Visualizer | Risk-adjusted results and backtesting | $30/mo |
| Stock Analysis | Long return history on a budget | $6.58/mo |
| Yahoo Finance | Quick screens on fees and ratings | $7.95/mo |
| Zacks | Load, fee and risk filters | $249/yr |
| Business Quant | Funds and ETFs together by share class, on costs, flows and risk, with export and API access | $29/mo |
Rows are alphabetical, Business Quant last. "Plans from" is the cheapest paid plan's lowest advertised monthly price on 15 October 2026; Fidelity's screener has no paid tier, and Zacks advertises an annual price only.
Mutual fund screeners reviewed
Fidelity
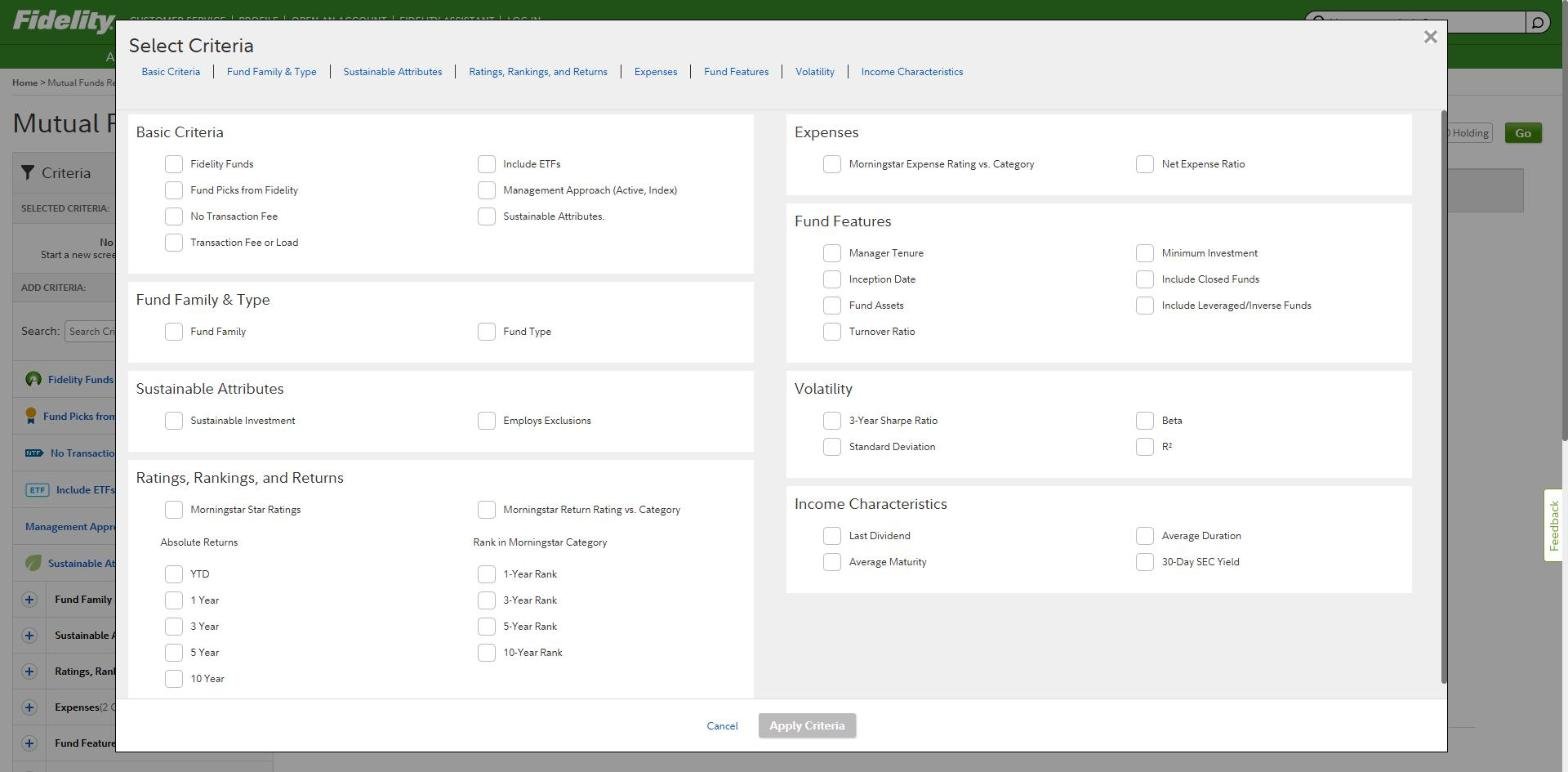
Fidelity's fund research site is built to help its customers choose from the funds it sells, but the screener opens to anyone without logging in, and it covers far more than Fidelity's own funds: 8,543 funds before you set a single criterion.
- Best for screening with Morningstar ratings at no cost.
- About 40 criteria in 8 groups, with no login and no paid tier.
- Volatility filters: 3-year Sharpe, standard deviation, beta and R-squared.
- Morningstar ratings and category rank over 1 to 10 years.
- Include ETFs switch in the basic criteria.
For a free tool, the criteria list is thoughtfully chosen. Expenses come as a net expense ratio and a Morningstar expense rating against the category, returns come both as absolute figures and as rank within the category, and the income group carries average duration, average maturity and 30-day SEC yield for bond funds.
Where it falls short: the tilt is toward Fidelity's own shelf. Fidelity Funds and Fund Picks from Fidelity are the first 2 boxes, and the transaction fee flags describe what a fund costs to buy at Fidelity, so read those as Fidelity's terms rather than the fund's. We found no fund flows filter or export.
Morningstar
Morningstar is the company whose ratings the other screeners borrow. Fidelity and Yahoo Finance both let you filter on Morningstar's star ratings; Morningstar Investor is where those ratings, its analysts' research and its own screener live together.
- Best for analyst ratings and Morningstar's fund research.
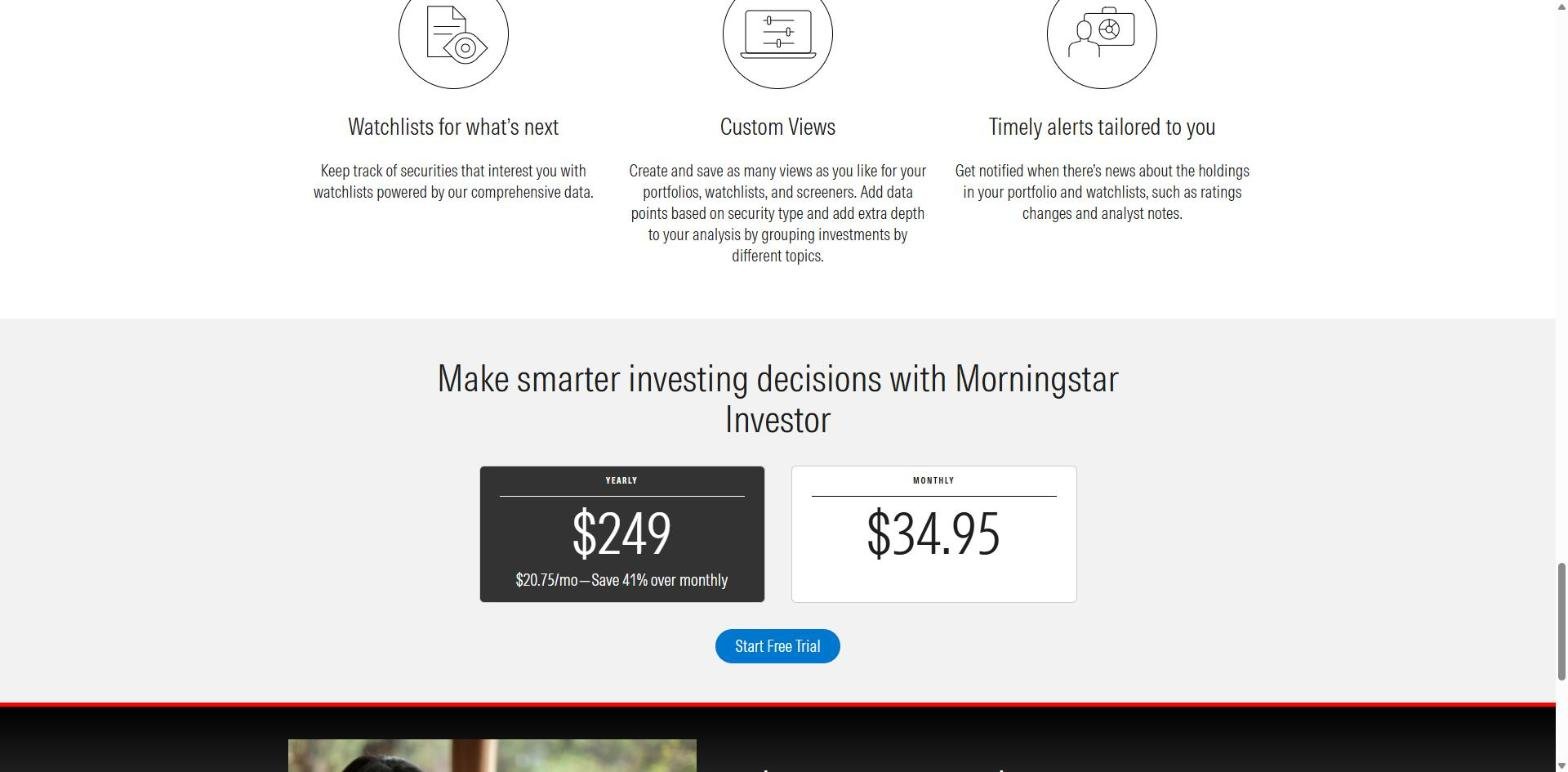
- Investor from $20.75 a month, billed yearly at $249, or $34.95 monthly, with a 7-day trial.
- 200+ data points to screen on.
- Mutual funds, ETFs, closed-end funds and stocks as investment types.
- Compare up to 5 securities side by side.
What Investor sells is Morningstar's judgement: its ratings, plus analyst reports on the funds it covers. The screener is the way into that research rather than the product itself, and custom views can be saved for screeners, portfolios and watchlists.
Where it falls short: there is no screener without the subscription, and the investment type is chosen from a dropdown, so mutual funds and ETFs are screened separately. We found no Sharpe or flows filter documented on the pages read, and no export.
Portfolio Visualizer
Portfolio Visualizer is a portfolio backtesting site with a fund screener attached. Its screener is built to feed that work: few filters, but results that arrive with the risk statistics already calculated.
- Best for risk-adjusted results and backtesting.
- 5 filters: fund type, asset class, benchmark, history and expense band.
- Mutual funds, ETFs and closed-end funds in one list.
- Sharpe, Sortino and capture ratios as result columns.
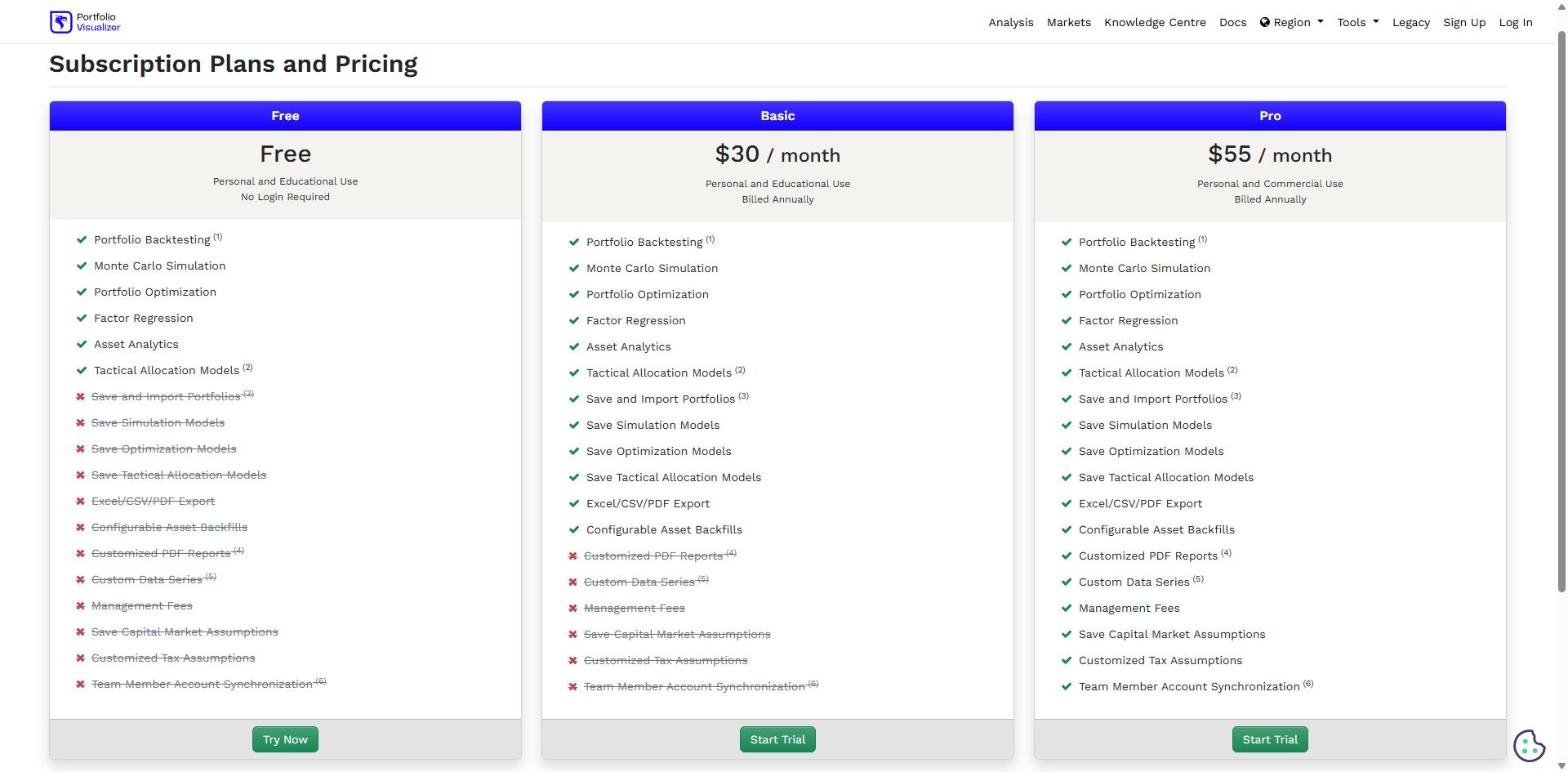
- Basic from $30 a month, adding Excel, CSV and PDF export.
The value is in the results table, which lists 23,047 funds with Sharpe and Sortino ratios, volatility, tracking error, information ratio and upside and downside capture, all sortable. From any fund you can move into Portfolio Visualizer's backtesting and optimisation tools, which is the reason to use it.
Where it falls short: the filters are preset bands rather than typed thresholds, such as an expense ratio under 0.25%, 0.50%, 0.75% or 1.00%, and Sharpe and Sortino can be sorted but not filtered. That makes it a sorter more than a screener.
Stock Analysis
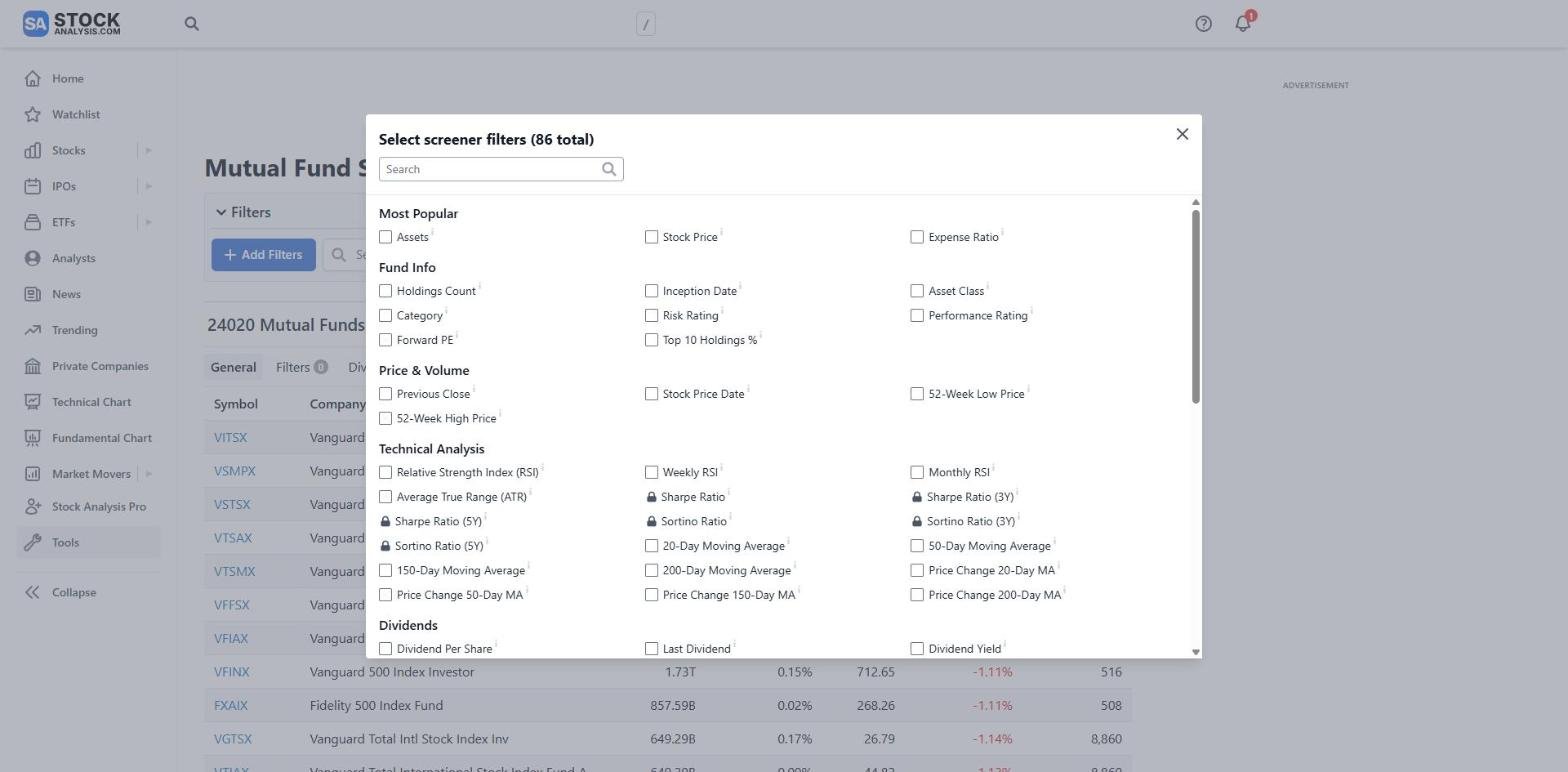
Stock Analysis is a research site best known for stock data. It applies the same fast design to mutual funds, with 86 filters across 24,020 funds and a long return history open at no cost.
- Best for long return history on a budget.
- Total return and CAGR from 1 to 20 years.
- Expense ratio, category, asset class, risk rating and beta open at no cost.
- Pro from $6.58 a month, adding Sharpe and Sortino filters, saved screens and one download a day.
The return filters are the strength: total return and annualised return over periods up to 20 years, next to the cost and category filters most screens start with.
Where it falls short: ETFs have their own screener on the site, so a mutual fund and an ETF cannot be ranked in one list, and the risk-adjusted filters need Pro. We found no fund flows filter.
Yahoo Finance
Yahoo Finance's mutual fund screener sits inside the quote site most people already use. It covers more than 10,000 funds and opens with a Nasdaq-listed default view you can clear.
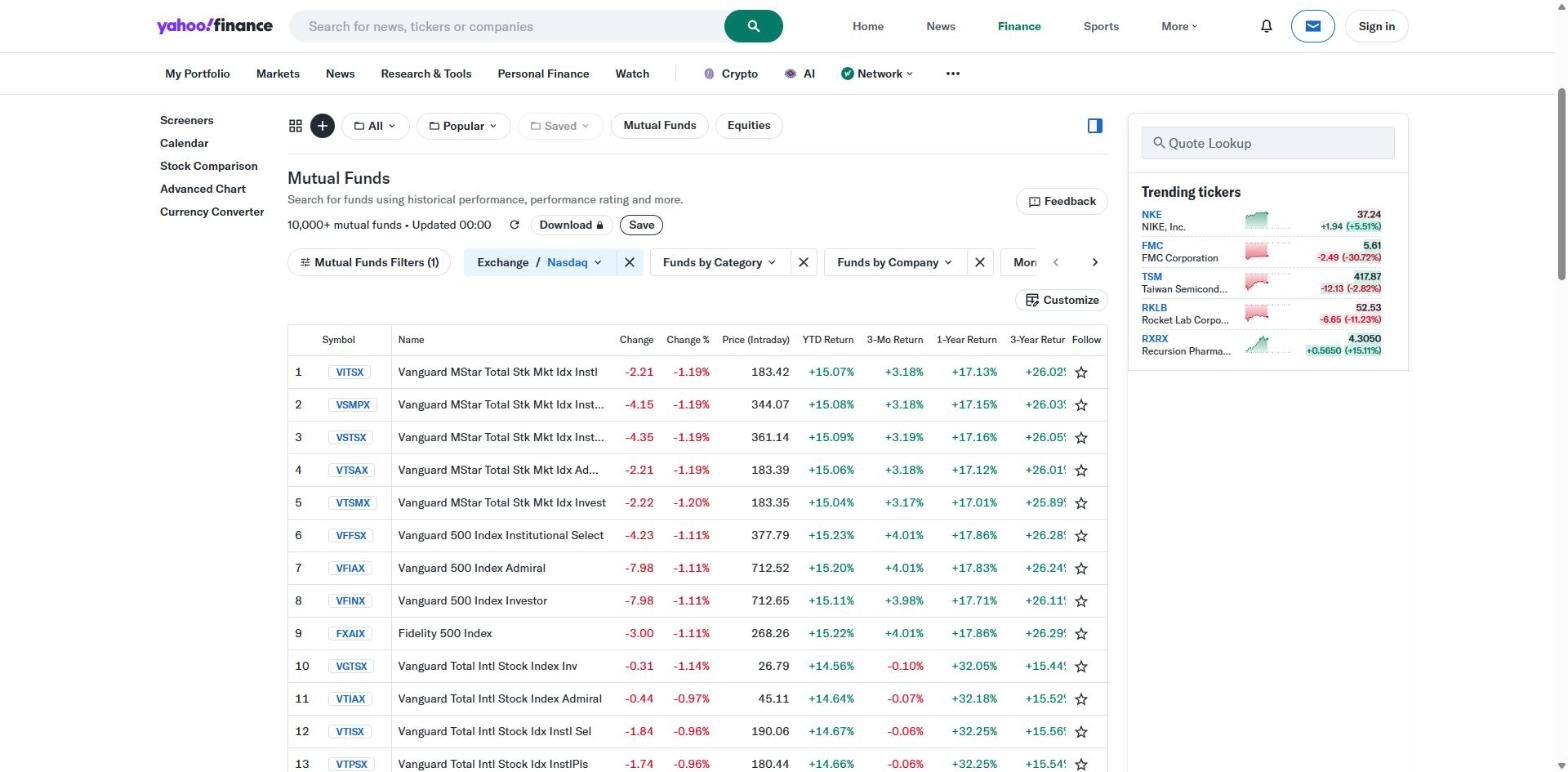
- Best for quick screens on fees and ratings.
- 28 filters in 5 groups, including net and gross expense ratio and turnover.
- Morningstar performance and risk ratings.
- Bronze from $7.95 a month, billed yearly; CSV downloads on Gold, at $39.95.
The filter list is short and practical: fund category and family, net assets, initial investment, returns, and the 2 Morningstar ratings. For a quick cut on cost and rating, it does the job.
Where it falls short: there is no risk-ratio filter, ETFs have a separate screener, and the Download button is locked until the Gold plan.
Zacks
Zacks built its name on the Zacks Rank for stocks, and its mutual fund screener applies the same research-house approach: about 50 criteria in 10 categories, each with a threshold you type, running signed out.
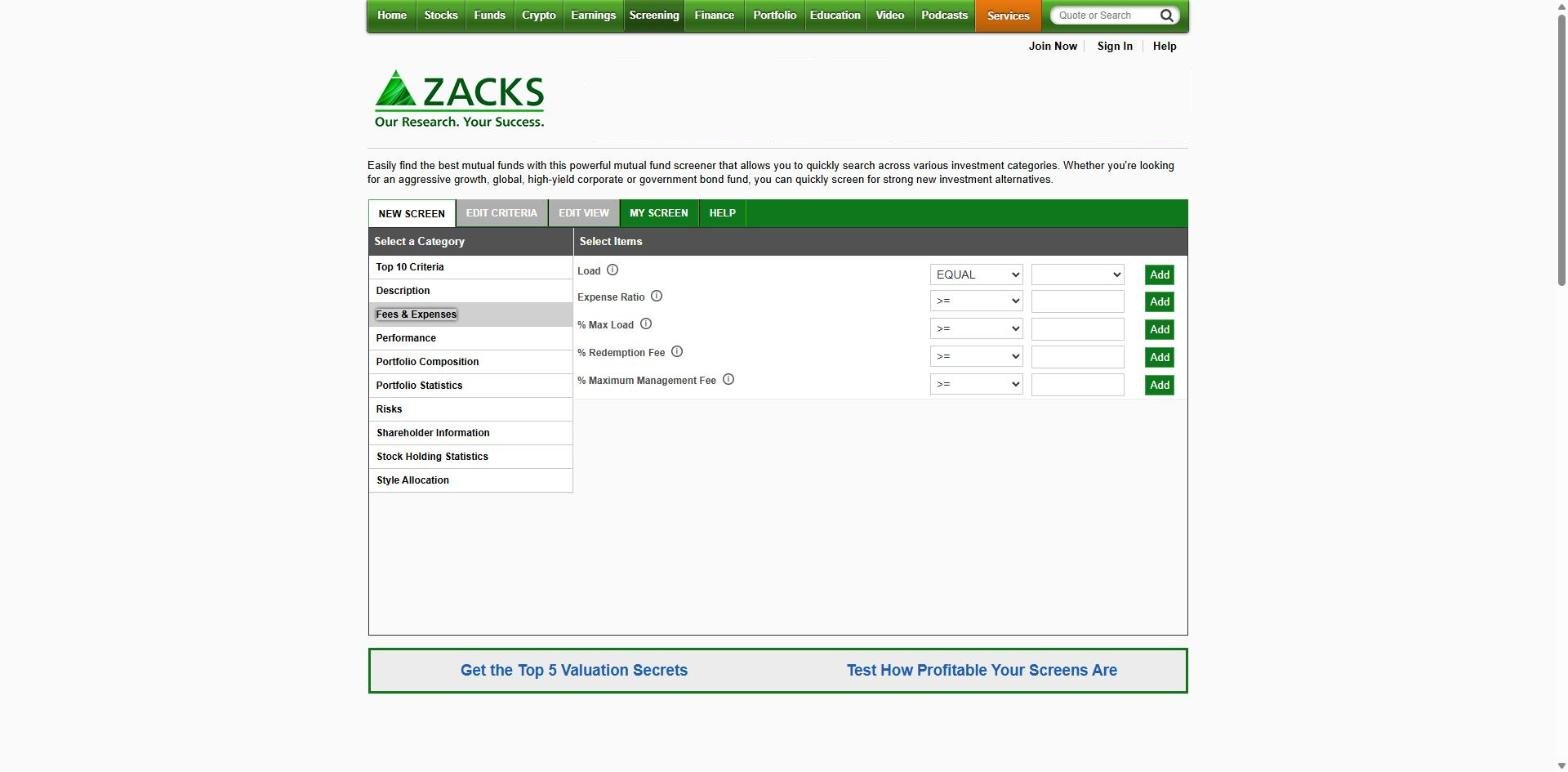
- Best for load, fee and risk filters.
- Fees: load, expense ratio, maximum load, redemption fee and management fee.
- 3-year risk: beta, alpha, R-squared, standard deviation and Sharpe.
- Returns from 4 weeks to 15 years.
- Zacks Premium at $249 a year, with the Zacks Rank for funds.
If you buy through an adviser or a platform that sells load funds, Zacks is the screener that lets you rule out a maximum sales charge or a redemption fee directly. It also screens on portfolio composition, style allocation and statistics on the stocks a fund holds.
Where it falls short: the screener covers mutual funds only, with no vehicle filter for ETFs, and Zacks Premium is sold by the year. We found no fund flows filter or export.
Business Quant
Business Quant is ours. Our ETF and mutual fund screener works at share-class level, with more than 32,000 mutual fund and ETF share classes on 102 metrics, so the Admiral class, the Investor class and the ETF class of one portfolio sit in adjacent rows and can be ranked on the same fee.
- Best for funds and ETFs together by share class, on costs, flows and risk, with export and API access.
- Free to use, with all 102 metrics open in the screen, no card.
- Pro from $29 a month, full history, export and API access.
List of features
- ETF and mutual fund screener with 15 preset views
- Cost filters: net and gross expense ratio, acquired fund fees, turnover and fund age
- Returns from 1 month to 5 years, and calendar years 2021 to 2025
- Risk ratios: Sharpe, Sortino, alpha, beta, standard deviation and maximum drawdown, 6 months to 5 years
- Fund flows over 1, 3 and 12 months
- Sector weights, asset mix, market cap mix and look-through P/E
- Bond character: effective duration, maturity, coupon, and Treasury, corporate and municipal weights
- A Vehicle filter for mutual funds, ETFs, closed-end funds and UITs
- Fund comparison of 2 to 6 funds
- Fund pages with portfolio, flows, distributions and risk
- Stock screener with more than 700 metrics
- Financial statements, segment financials and KPI data
- Economic data
- CSV and XLSX download
- API access
- MCP server
Beyond the usual fee and return filters, the screener lets you filter on what a fund owns, through sector weights and look-through P/E, on how investors are voting, through net flows, and on bond character, through effective duration and the share held in Treasuries, corporates or municipals. A Money Market category sits alongside equity, fixed income, allocation and target-date funds, and every column carries the date of the record it came from, because prices, portfolios, flows and prospectus fees are reported on different schedules.
The screen in the figure took 3 conditions: mutual funds only, "500 Index" in the name, and a net expense ratio on file. Sorted by cost, it shows how widely one index is priced, from 0.015% for FXAIX to 1.29% for SPICX. From there, fund comparison puts 2 to 6 funds side by side on all 102 metrics, for example VFIAX against VOO, and each fund has its own page with full holdings after a free registration.
Mutual fund screeners feature by feature
| Platform | Screener at $0 |
ETFs in the same screen |
Sharpe filter |
Fund flows |
Spreadsheet export |
API access |
MCP server |
Plans from |
|---|---|---|---|---|---|---|---|---|
| Business Quant | ✓ | ✓ | ✓ | ✓ | ✓ | ✓ | ✓ | $29/mo |
| Fidelity | ✓ | ✓ | ✓ | ✗ | ✗ | ✗ | ✗ | $0 |
| Portfolio Visualizer | ✓ | ✓ | ✗ | ✗ | ✓ | ✗ | ✗ | $30/mo |
| Stock Analysis | ✓ | ✗ | ✓ | ✗ | ✓ | ✗ | ✗ | $6.58/mo |
| Yahoo Finance | ✓ | ✗ | ✗ | ✗ | ✓ | ✗ | ✗ | $7.95/mo |
| Zacks | ✓ | ✗ | ✓ | ✗ | ✗ | ✗ | ✗ | $249/yr |
| Morningstar | ✗ | ✗ | ✗ | ✗ | ✗ | ✗ | ✗ | $20.75/mo |
Sorted by ticks, ties broken alphabetically. A tick means the platform's own screener, pricing, plan or product pages document the feature on a self-serve plan, or its screener showed it when we tested it; a cross means we found no such documentation. "Screener at $0" means a mutual fund screen runs without paying. "ETFs in the same screen" means mutual funds and ETFs can appear in one result list. "Sharpe filter" means a Sharpe ratio can be used as a filter, not only shown as a column. "Fund flows" means net money into or out of each fund as a filter. "Spreadsheet export" means downloading a screen to a file. "API access" and "MCP server" mean a self-serve API and an AI-assistant connector.
Business Quant is the only screener here that ticks every column, and the only one with fund flows, an API or an MCP server. Fidelity, Portfolio Visualizer and Stock Analysis come next with 3 each: Fidelity for a free screen with ETFs and a Sharpe filter, Portfolio Visualizer for ETFs and export, Stock Analysis for its Sharpe filter and download on Pro. Morningstar ticks none because it sells its screener inside a research subscription; its ratings, which 2 other screeners here let you filter on, are the reason to pay. A cross shows what a product was built for, not how good it is.
What about Schwab, MarketWatch and Barchart?
All 3 come up in searches for a mutual fund screener and none made the list. Schwab's Mutual Fund Screener sits on its client site, MarketWatch's mutual fund finder link opened its general tools index, and Barchart's funds screener filters on price and technical signals rather than expenses. MutualFunds.com uses toggles and sortable columns rather than threshold filters, and Tickertape is built for Indian funds.
Which mutual fund screener is right for you?
- You want Morningstar ratings and a Sharpe filter at no cost: Fidelity.
- You want Morningstar's analyst research behind the screen: Morningstar.
- You rank funds by risk-adjusted return and then backtest: Portfolio Visualizer.
- You want 20 years of returns on a budget: Stock Analysis.
- You want a quick cut on fees and ratings: Yahoo Finance.
- You buy load funds and want to rule out sales charges: Zacks.
- You want funds and ETFs by share class on costs, flows and risk, with export and an API: Business Quant.
To compare 2 funds you have already found, our ETF comparison tools guide covers that step, and our stock screener comparison covers individual stocks.
Where I would screen for my next fund
If you only want a quick list of cheap index funds, any free screener will get you there. For a screen you will act on, I would run it on the Business Quant ETF and mutual fund screener.
The reason is the opening question: the same index, sold at very different prices. Business Quant works at share-class level and puts mutual funds and ETFs in one table, so the cheapest wrapper for a portfolio shows up next to the one you hold. The 72-row screen in the figure took 3 conditions and showed a spread from 0% to 1.29% a year on one index.
It also lets you ask the next questions without paying. All 102 metrics are open in the screen: Sharpe and Sortino ratios and drawdown from 6 months to 5 years, fund flows over 1, 3 and 12 months, sector weights and look-through valuation, and duration for bond funds. The screener is free to use, and Pro, with export and API access, is from $29 a month.
A 10-minute test: take a fund you own, note its share class and net expense ratio, then screen for every share class tracking the same index and sort by net expense. If a cheaper class or an ETF of the same portfolio sits a few rows above yours, compare the 2 side by side before your next contribution.
How this comparison was made
To make the list, a screener had to filter US mutual funds on fund characteristics, at least expense ratio and trailing returns, using criteria you set, and be open to an individual at no cost or at a price published on the vendor's own site, without a brokerage login or a sales call. 7 screeners met that bar.
Every price, plan, filter count and fund count was read on the vendor's own screener, pricing or product pages on 15 October 2026 and screenshotted there. Filter counts are what each screener or product page shows, and they count different things. Prices are each platform's lowest advertised monthly price in US dollars on that date; Zacks advertises a yearly price only. Our screen in the illustration was run live on the same day.
The list, the summary table and the reviews run alphabetically, with Business Quant last, and the feature table is sorted by the number of ticks, with ties broken alphabetically. We make Business Quant, one of the 7 products compared here. For where each research platform's data comes from, our stock research tools comparison covers the field.
Image credits. Header photograph by Towfiqu barbhuiya on Unsplash, used under the Unsplash License. Vendor screenshots were captured on 15 October 2026 from each provider's own screener or pricing pages and are reproduced for comparison. The fund screen illustration is our own, built from our fund data.
Frequently asked questions
What is the best mutual fund screener?
It depends on what you screen for. Business Quant screens mutual funds and ETFs together at share-class level on 102 metrics, including costs, fund flows and risk ratios, and is free to use. Fidelity's screener runs without an account and carries Morningstar ratings and a 3-year Sharpe filter. Zacks has the deepest set of fee filters, including loads and redemption fees, and Morningstar Investor adds analyst ratings from $20.75 a month.
Is there a free mutual fund screener?
Several. Business Quant is free to use, with every one of its 102 metrics open in the screen and downloads on Pro from $29 a month. Fidelity, Zacks, Yahoo Finance, Stock Analysis and Portfolio Visualizer all run a mutual fund screener at no cost. Morningstar's screener comes with Morningstar Investor, from $20.75 a month on a yearly plan.
Which mutual fund screeners let you filter by Sharpe ratio?
Among free screeners, Business Quant filters on Sharpe and Sortino ratios, alpha, beta, standard deviation and maximum drawdown over periods from 6 months to 5 years. Fidelity filters on a 3-year Sharpe ratio, standard deviation, beta and R-squared, and Zacks on 3-year beta, alpha, R-squared, standard deviation and Sharpe. Stock Analysis reserves its Sharpe and Sortino filters for Pro, and Portfolio Visualizer shows Sharpe and Sortino as result columns you can sort rather than filter.
How do I find mutual funds with the lowest expense ratio?
Filter on net expense ratio, then sort the results from low to high, and check the share class. One portfolio is often sold in several classes at different prices: on Business Quant's data, the Vanguard 500 Index Fund charges 0.14% in Investor shares, 0.04% in Admiral shares and 0.01% in Institutional Select shares, against 0.03% for its ETF class, VOO. A screener that works at share-class level shows all four.
What is the best tool to compare mutual funds?
Business Quant's Fund Comparison puts 2 to 6 mutual funds or ETFs side by side on 102 metrics at share-class level, so VFIAX and VOO appear as separate columns of one portfolio, and it is free to use. Morningstar Investor compares up to 5 securities at a time with its ratings alongside.
Can I screen bond funds and money market funds?
Yes, on most of these screeners. Business Quant has a Money Market category and bond filters for effective duration, maturity, average coupon and the share in Treasuries, corporates and municipals. Fidelity filters on average duration, average maturity and 30-day SEC yield, Portfolio Visualizer has a Money Market asset class, and Zacks has SEC yield and bond style allocations.