7 Best Free Stock Research Tools for 2027
7 free stock research tools compared on screening, charting, financial statements, SEC filings and ownership data, with no trial clock and no card.
Below are 7 free stock research tools you can use indefinitely, with no trial clock and no credit card: Finviz, Koyfin, Stock Analysis, TIKR, TradingView, Yahoo Finance and Business Quant. For each one you will find what it is best for, what the free plan includes, where it stops, and what the first paid plan costs.
What a free stock research tool should cover
A free plan is worth using if it handles the everyday research jobs without sending you elsewhere.
- Screening. Finding companies that pass a test you set.
- Financial statements. Ideally 5 years or more, annual and quarterly.
- Charting. Plotting revenue, margins or any metric over time.
- SEC filings. The 10-K, 10-Q and 8-K behind the numbers.
- Ownership. Which institutions hold the stock and what insiders are doing.
- Portfolio tracking. Somewhere to follow what you own.
Most free plans switch almost all of these on. What they ration is depth and portability: how many years of history you can see, and whether you can take the numbers into a spreadsheet. Across these 7 tools, free statement history ranged from 2 years to 7, and data export sat on a paid plan everywhere. If you have already decided to pay, our comparison of paid stock research tools covers the other side of that line.
The 7 free tools at a glance
| Platform | Best for | Statements at $0 |
Plans from |
|---|---|---|---|
| Finviz | Fast screening and market maps | 3 years | $24.96/mo |
| Koyfin | Market dashboards and charting | 2 years, 12 quarters | $39/mo |
| Stock Analysis | Clean statements and fundamental charts | 5 years plus TTM | $6.58/mo |
| TIKR | Holders, filings and transcripts | 5 years, 8 quarters | $17.95/mo |
| TradingView | Price charts with fundamentals | 7 years on charts | $12.95/mo |
| Yahoo Finance | Quotes, news and ownership | 4 years plus TTM | $7.95/mo |
| Business Quant | Screening, charting and ownership in one account | 5 years, 20 quarters | $29/mo |
Scroll the table sideways for every column. Rows run alphabetically, with Business Quant placed last. "Statements at $0" is the history each tool shows without paying, read from its own plan table or statement pages. "Plans from" is the lowest advertised monthly price of the cheapest paid plan.
Free research tools reviewed
Finviz
The screener half the internet uses without signing up. Finviz started as a visual map of the US market and grew a screener fast and open enough to become the default link in forum threads, and most of it works with no account.
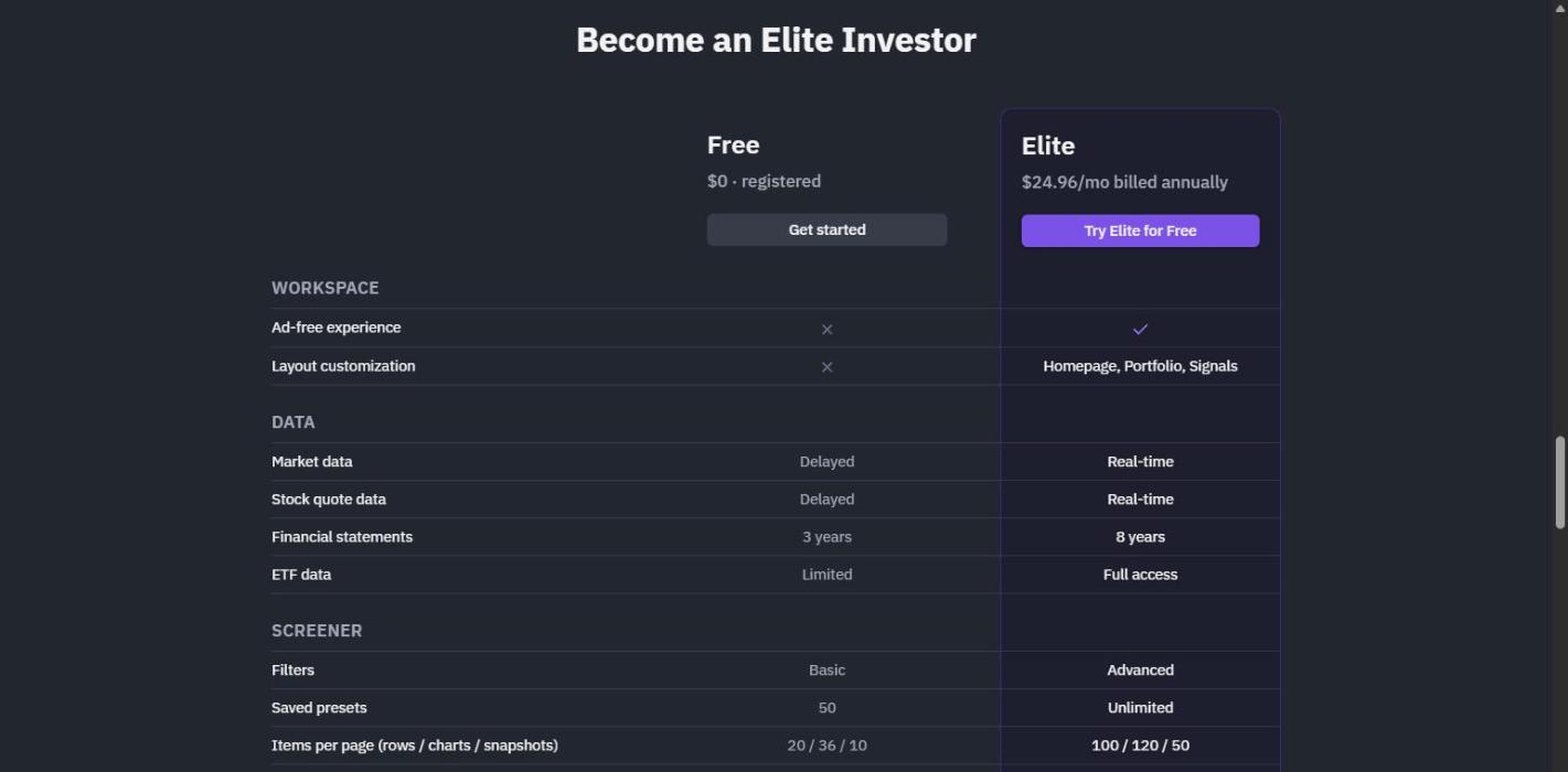
- Best for fast screening and a visual market overview.
- $0 with a registration, no card.
- 3 years of statements at $0, 8 on Elite.
- Basic screener filters and 50 saved presets.
- 50 portfolios of up to 50 holdings each.
- Filings, insider trades and top holders on every quote page.
- Elite from $24.96 a month.
The portfolio allowance is the surprise: 50 portfolios of 50 holdings sits in the $0 column of Finviz's own plan table. The quote page also does a lot on its own, with a wall of ratios, a sales chart by year, the latest filings, the largest institutional managers and recent insider transactions on one screen.
The limits are history and speed. 3 years of statements shows a trend but not a cycle, quotes are delayed on the $0 plan, and export to Excel or CSV is an Elite feature. Fundamentals are recalculated every hour by Finviz's own description.
Koyfin
A terminal-style charting and dashboard tool in the browser, and on its $0 plan the charting, market dashboards and macro views are switched on rather than teased.
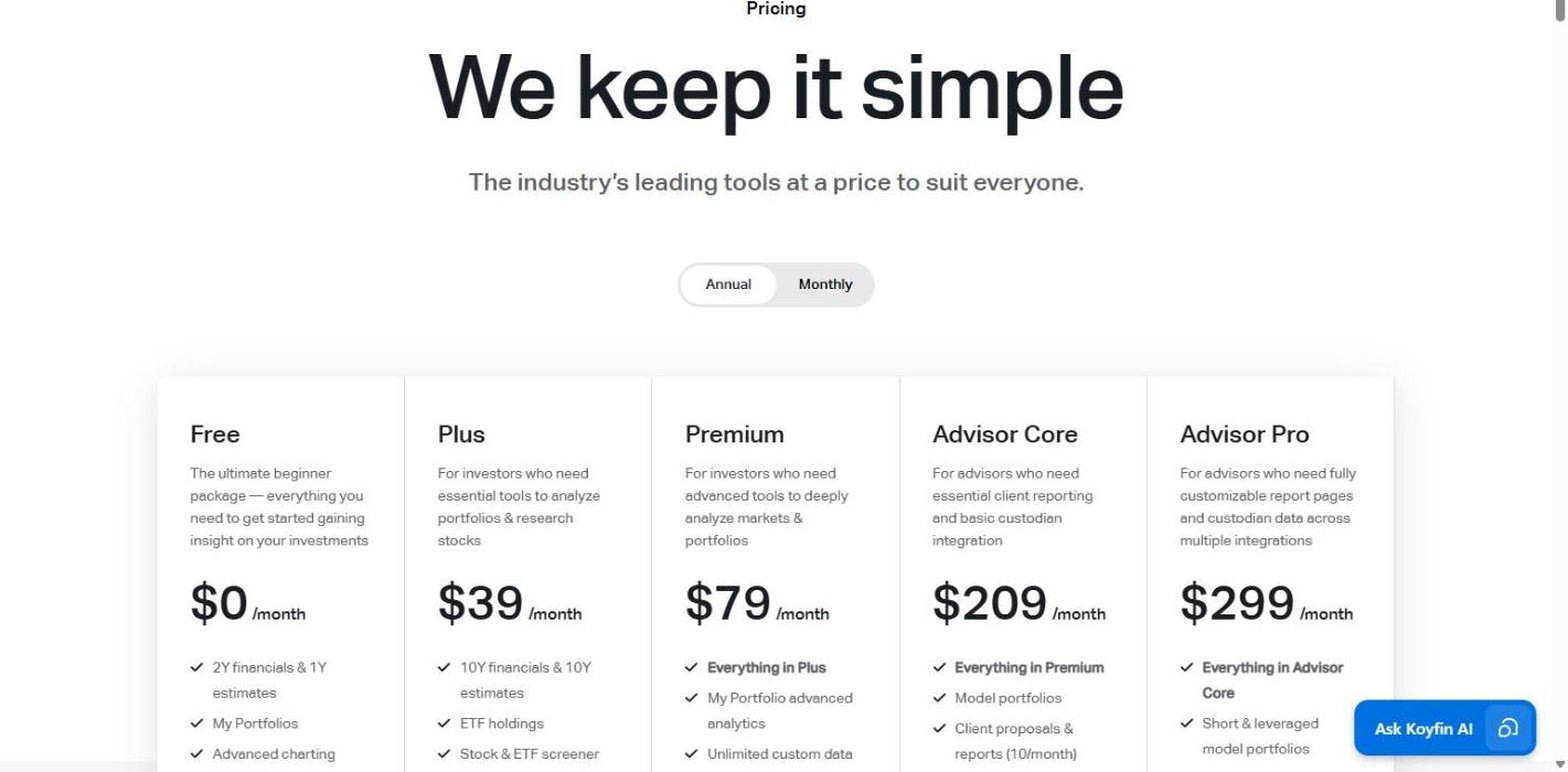
- Best for top-down research from markets and sectors.
- $0 plan, permanent.
- 2 years and 12 quarters of statements.
- Advanced charting and market dashboards included.
- 2 watchlists and 2 saved screens.
- One portfolio account with cost basis and P&L.
- Plus from $39 a month.
If your research starts with markets, sectors and macro before you reach a company, Koyfin has the most capable free plan here. The charting is the full product, and a portfolio account tracks holdings with cost basis and profit and loss.
It is thinner on the company itself. 2 years of financials is the shortest free history in this list, company filings and insider ownership start at Plus, and 2 saved screens fill up quickly.
Stock Analysis
The fastest, cleanest company pages here, and most of them need no account. Statements, ratios and filings load almost instantly, and the free experience is close to the paid one apart from depth.
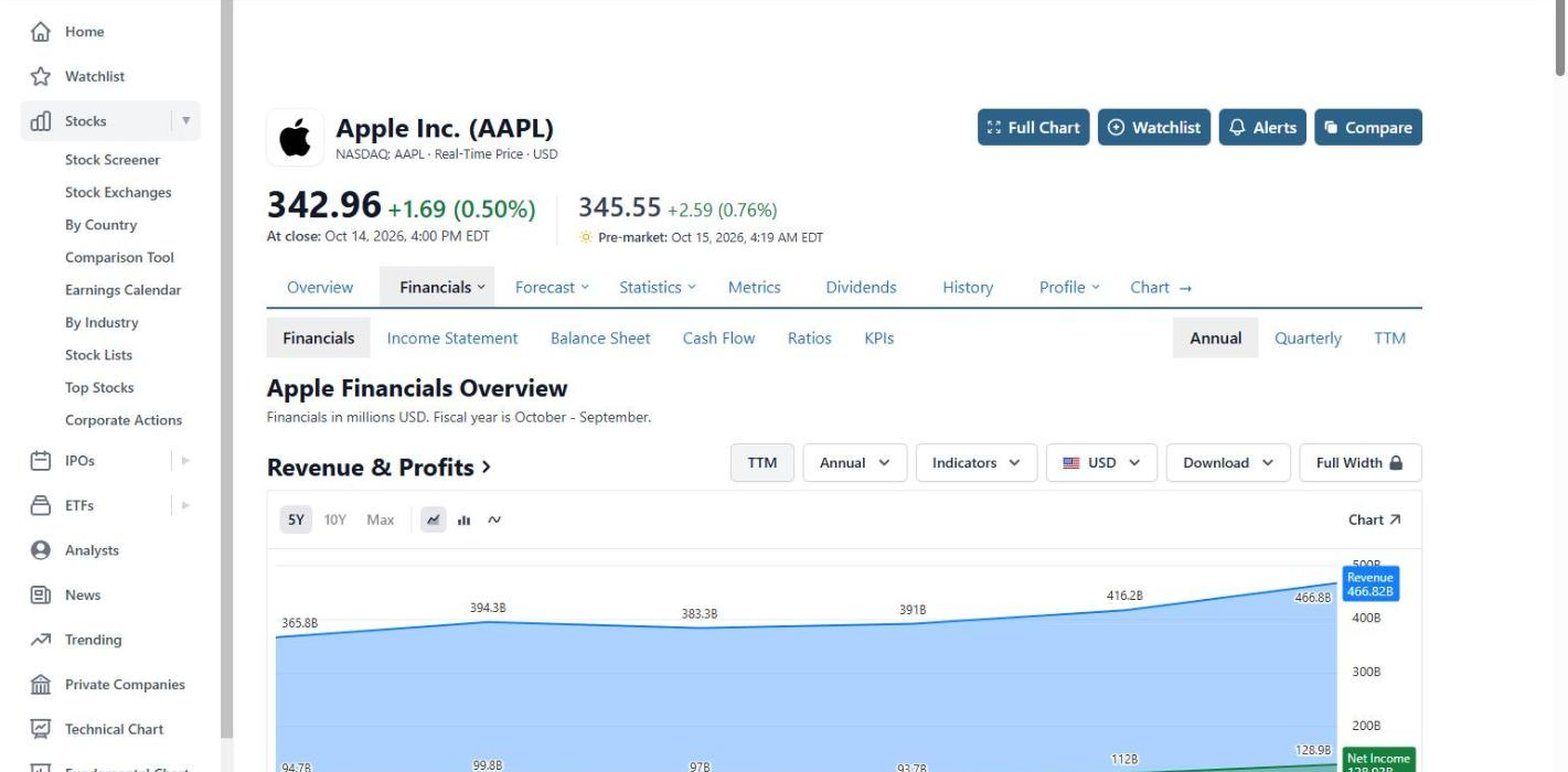
- Best for quick, clean financial statements.
- No account needed for most pages.
- 5 fiscal years plus TTM at $0.
- Screener, fundamental chart and comparison tool.
- Recent SEC filings on every company profile.
- Watchlist and portfolio tracker.
- Pro from $6.58 a month, the cheapest paid plan here.
The fundamental chart plots a financial metric over time for one company or several, which answers the "has this business improved?" question most people open a research tool for. Coverage is international: a London listing such as Shell loads with the same 5 fiscal years as Apple.
Ownership is its thinnest area. The statistics page gives the share held by insiders and institutions as a percentage, without a list of holders or insider trades, and Pro allows one download a day.
TIKR
An institutional-style dataset at a retail price, and the $0 plan is a real slice of it. The free plan covers US companies, with statements, charts, filings and holders.
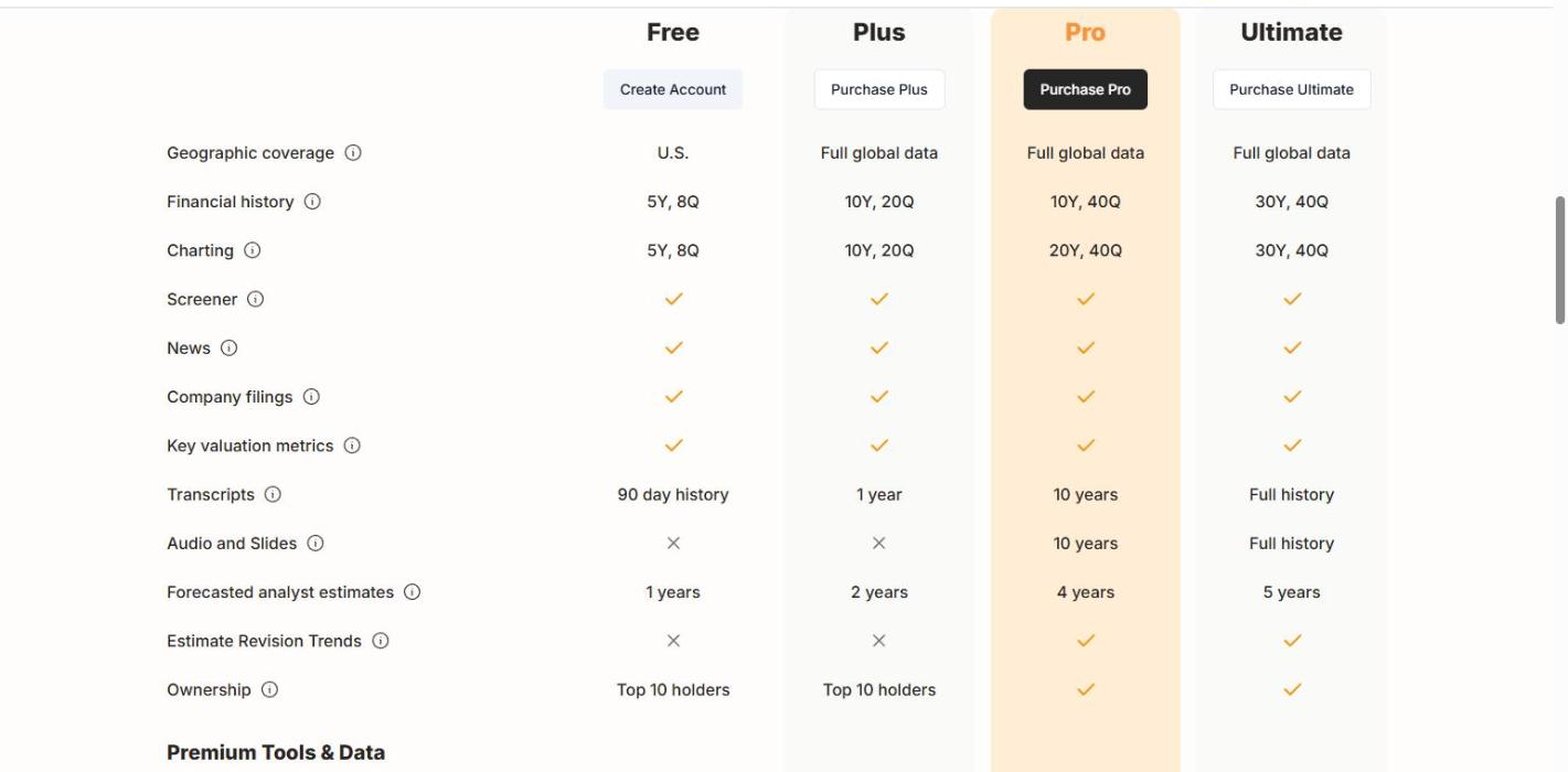
- Best for US company research with holders and transcripts.
- $0 and no card, stated on the plan card.
- 5 years and 8 quarters in the plan table.
- Screener with one saved screen.
- Company filings and the top 10 holders.
- 90 days of transcripts at $0.
- Plus from $17.95 a month, adding global coverage.
A holder list, filings and charted history are things most free plans ration separately, and TIKR gives all of them for any US company. 90 days of transcripts is enough to read what management said on the latest call.
The plan card describes the free plan as 3 years of financial history while the comparison table lists 5 years and 8 quarters, so expect something in that range. The pricing page lists watchlists but no portfolio tracker.
TradingView
The charting platform most retail traders use, with a research layer many people have not noticed: the $0 Basic plan also carries a stock screener, financial statements, company documents and a portfolio.
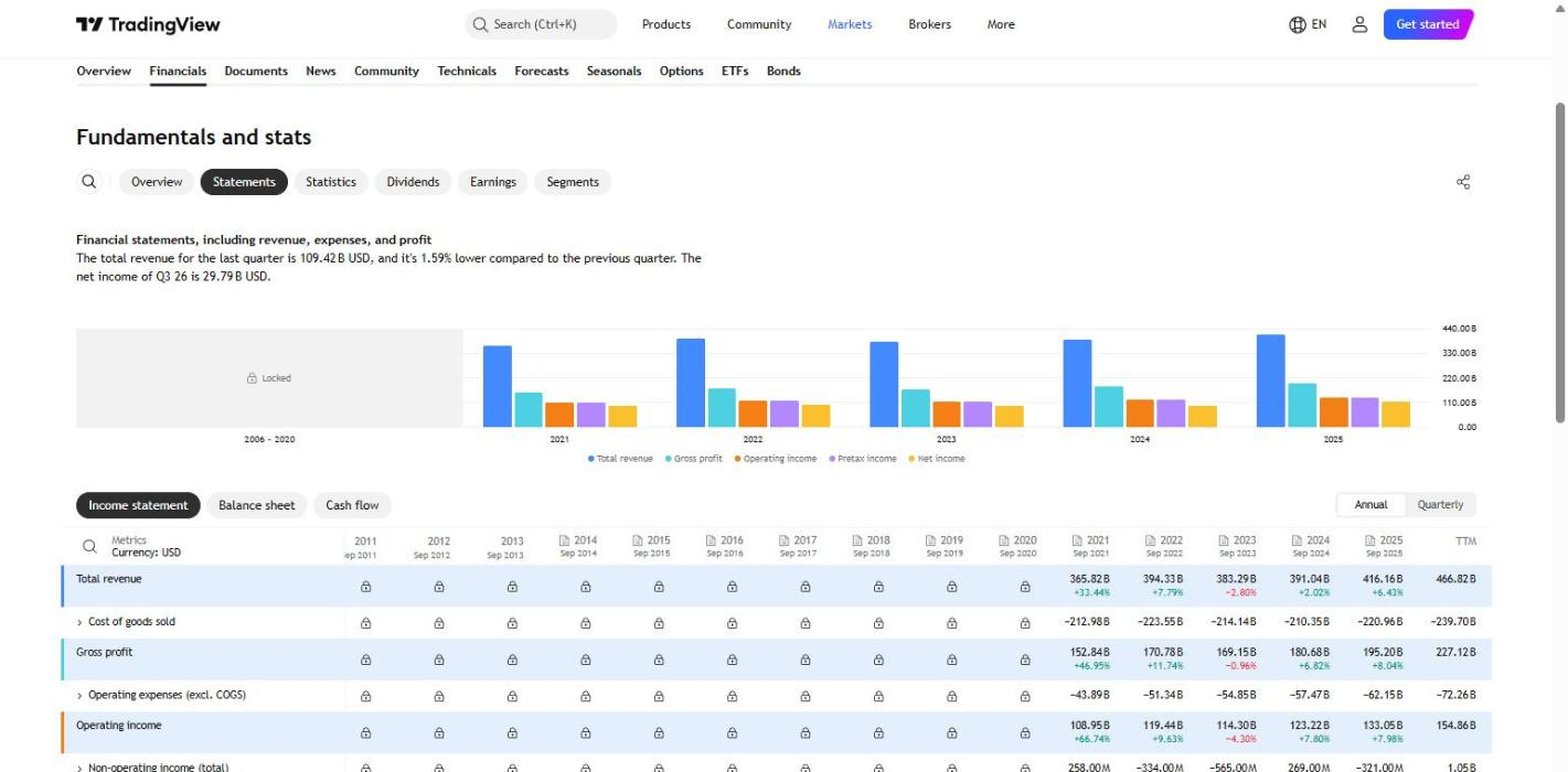
- Best for price charts with fundamentals underneath.
- Basic is $0 forever, no card.
- 7 years of annual financials on charts.
- Screener over 500+ fields and 50+ countries.
- SEC filings on each symbol's documents page.
- One portfolio of 20 holdings.
- Essential from $12.95 a month, Premium $59.95.
7 years of annual figures on a chart is the longest free history here, and because it is drawn rather than tabulated, a margin or revenue line can sit directly under the price it explains. The documents tab on a US symbol lists its 10-K, 10-Q and 8-K filings.
The free limits are about workspace: one chart per tab, one saved layout, one portfolio of 20 holdings and no chart data download. The symbol pages carry financials, documents and forecasts but no holder list.
Yahoo Finance
The site most people reach first. Yahoo Finance has offered quotes, statements and portfolios for free for a long time, and its research pages now sit beside a paid ladder of Bronze, Silver and Gold.
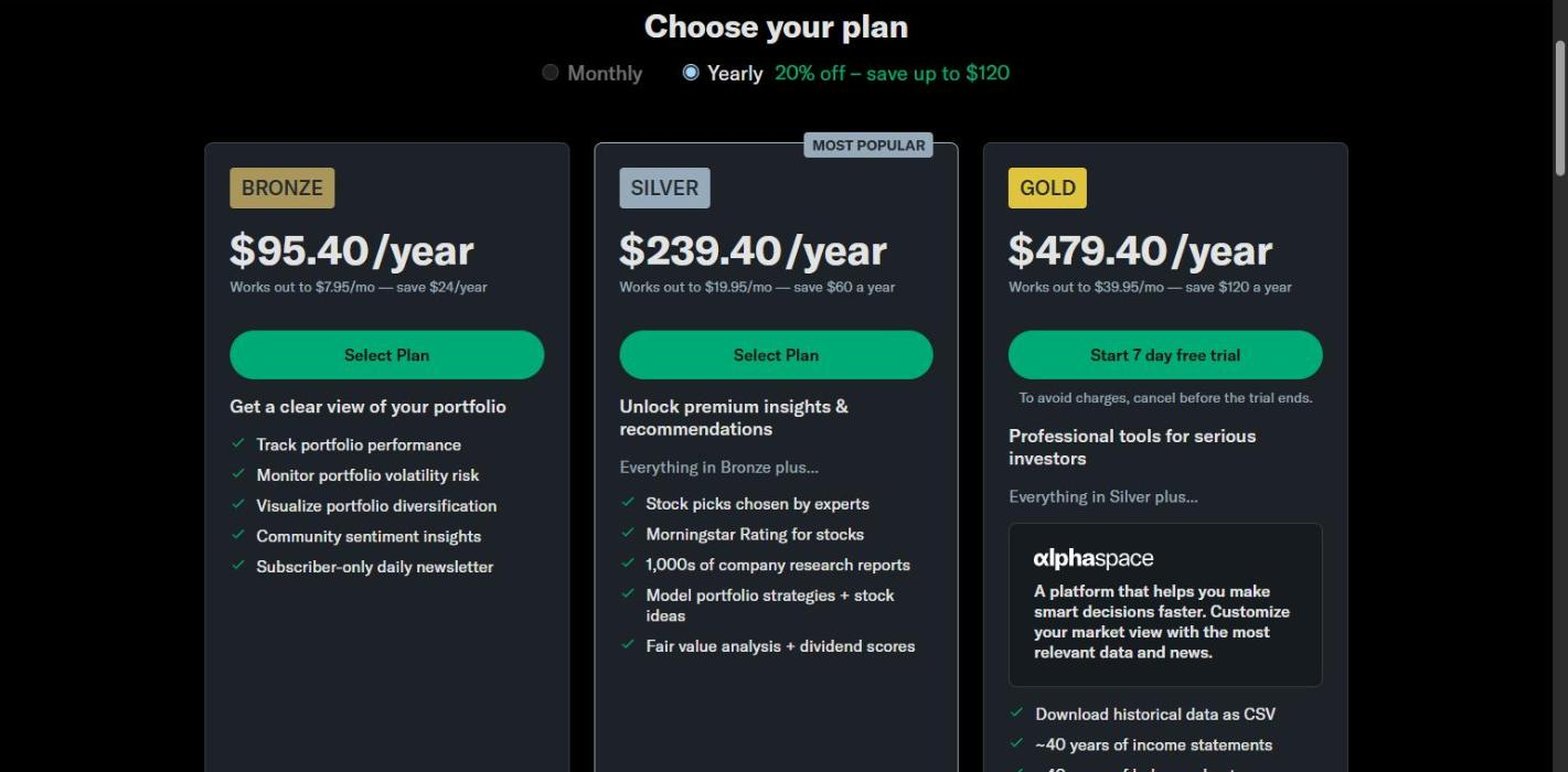
- Best for quick lookups, news and ownership.
- No account needed for quote and research pages.
- 4 fiscal years plus TTM at $0.
- Stock screener with region and sector filters.
- Top institutional and fund holders, plus insider transactions.
- Portfolios, linked or entered by hand.
- Bronze from $7.95 a month, Gold $39.95.
A single holders page lists the major holders, the top institutional holders and the top mutual fund holders, with tabs for the insider roster and recent insider transactions. The screener is global, with a region filter on the first row.
4 years of statements is shorter than most tools here, and the long history, about 40 years of each statement, is a Gold feature alongside CSV downloads. Portfolio analysis such as performance and diversification starts at Bronze.
Business Quant
Statements, filings and ownership extracted in house from SEC documents, with every web feature switched on for a free account.
- Best for screening, charting and ownership in one free account.
- Free to use, no card.
- 5 fiscal years and 20 quarters of statements.
- 818 screenable metrics, no account needed to run a screen.
- Charting and time series tables on any metric.
- SEC filings, 13F holders and Form 4 trades on every stock page.
- Portfolio tracker, heatmap and fund screener.
The stock screener filters on 818 metrics and narrows by industry using the BQ-MICS classification, and a guest can run a screen with no account. From any result, the company page has the same tabs for every US-listed stock: the income statement and the other statements, KPIs and operating metrics, analyst estimates, dividends, revenue breakdown, peers, SEC filings, institutional ownership from 13F filings and insider trading from Form 4.
Advanced charting plots any metric over time for several companies at once, and time series tables lay out a set of metrics across years in a grid you design. Around them sit industry financials, a portfolio tracker, a market heatmap, economic data, corporate actions for splits, buybacks and dividends, an ETF and mutual fund screener across 32,727 share classes on 102 metrics, and fund comparison for 2 to 6 funds.
Statements use industry-specific layouts, so a bank and a software company each get a statement that fits them, and new results appear within 10 to 15 minutes of release. Pro, from $29 a month, adds 20+ years of statements, segment financials, company KPIs such as subscribers or store counts, analyst estimates and data export.
Free features compared
| Platform | Charts a financial metric |
Portfolio tracker |
SEC filings in the tool |
Named holders |
Plans from |
|---|---|---|---|---|---|
| Business Quant | ✓ | ✓ | ✓ | ✓ | $29/mo |
| Finviz | ✓ | ✓ | ✓ | ✓ | $24.96/mo |
| Stock Analysis | ✓ | ✓ | ✓ | ✗ | $6.58/mo |
| TIKR | ✓ | ✗ | ✓ | ✓ | $17.95/mo |
| TradingView | ✓ | ✓ | ✓ | ✗ | $12.95/mo |
| Yahoo Finance | ✗ | ✓ | ✓ | ✓ | $7.95/mo |
| Koyfin | ✓ | ✓ | ✗ | ✗ | $39/mo |
Sorted by number of ticks, ties broken alphabetically. A tick means the feature is documented and available at $0 on that platform's own plan table or pages; a cross means it is not documented at $0. "Named holders" means the tool lists who owns the stock, as institutional holders or insider transactions, not only a percentage. "Plans from" is the lowest advertised monthly price.
Crosses here reflect what each tool was built around. TIKR is a company research terminal rather than a portfolio dashboard, and Koyfin's free plan is aimed at market-level work. Every tool in the table ticks at least 2 of the 4, which says a lot about how good free research has become.
Researching for free on Business Quant
Here is where each research job lives on a free Business Quant account.
| Research job | Where it lives on a free account |
|---|---|
| Find companies that pass your test | Stock screener, 818 metrics, no account needed to run it |
| Follow one metric over time | Advanced charting, several companies on one chart |
| Lay out several metrics across years | Time series tables you design yourself |
| Read the statements | The latest 5 fiscal years and 20 quarters on each stock page |
| Read what the company filed | The SEC filings tab, from 10-K and 10-Q to 8-K and 20-F |
| See which funds own it | The institutional ownership tab, from 13F filings |
| See what insiders have done | The insider trading tab, from Form 4 |
| Compare a company with its industry | Industry financials and industry stock lists by BQ-MICS |
| Follow your own holdings | The portfolio tracker |
| See the whole market on one screen | The market heatmap |
| Track splits, buybacks and dividends | Corporate actions |
| Find an ETF or fund | The fund screener, 32,727 share classes on 102 metrics |
| Compare 2 to 6 funds | Fund comparison |
Pro, from $29 a month, adds 20+ years of statements, segment financials, company KPIs, analyst estimates and CSV export. To understand how the statements behind these pages are put together, the financial statements guides walk through it.
Free tools that did not make the list
A few well-known names come up whenever free research tools are discussed but do not offer a lasting free plan that screens on fundamentals and shows several years of statements.
- SEC EDGAR. The official source of every filing, but it does not screen stocks.
- Stock Rover. Its free account is for basic research on individual stocks.
- Fiscal.ai. The web terminal starts with a 7-day trial.
- Morningstar. The statements page offers 7 days free to unlock it.
EDGAR is complete, official and free, and it is the right place to read a document in full. It does not turn those documents into a screen, a chart or a table across companies. If you would rather build that layer yourself, our screener API comparison covers the developer route, and our stock screener guide goes deeper on screening.
Where I would spend the first hour
I would spend the first hour on Business Quant.
Every job in a typical research session happens in one free account, without hitting a wall halfway through: the screen that finds the company, the chart that shows whether it has improved, 5 years of its statements, the filings behind them, the funds that hold it and the insiders who have traded it. Most free plans give you some of those and ration the rest.
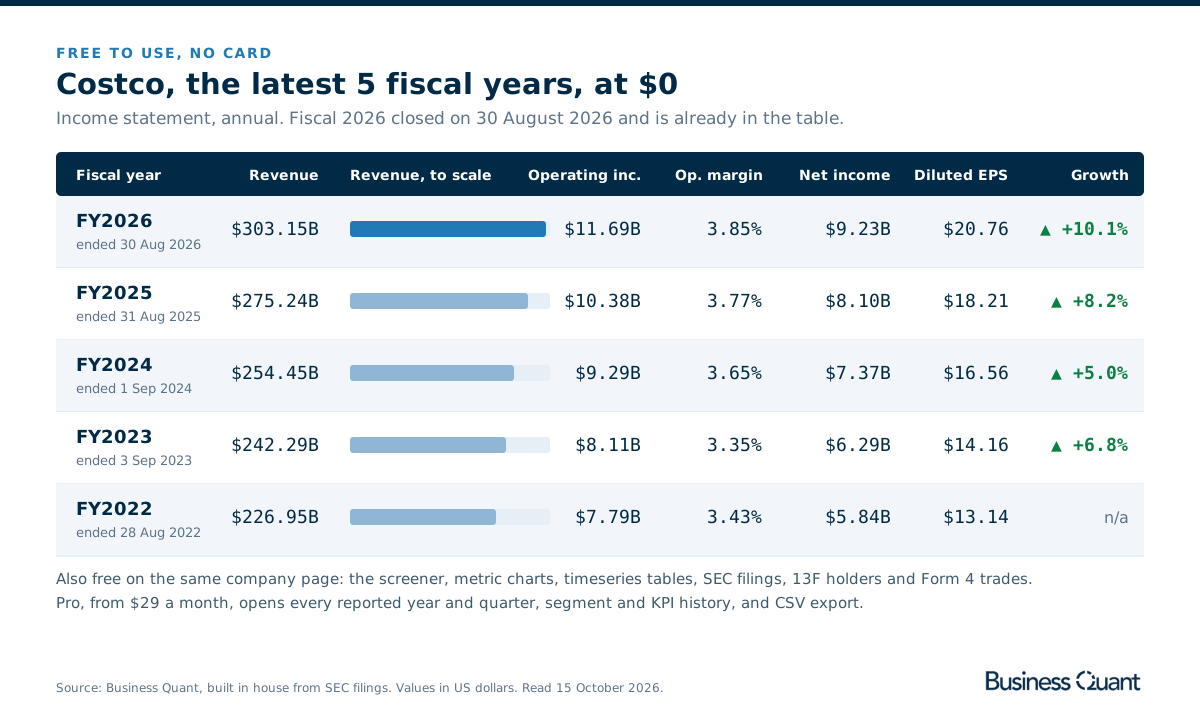
The screener runs across 818 metrics before you have made an account. The 5 visible years are the latest 5, with new results added within 10 to 15 minutes of release, so Costco's fiscal 2026, which closed on 30 August, is already the top row. And the ownership and filings tabs are on every stock page for free. When you need more, Pro opens 20+ years of statements, segment financials, KPIs and export from $29 a month.
A test you can run on any tool: take a company you know well and answer 3 questions. What were its revenue and operating margin 5 years ago? Which 3 institutions hold the most of it? What did it file most recently? Time how long each tool takes to answer all 3 for free, and note where it asks you to upgrade.
How this comparison was made
To make the list, a tool had to be usable in a browser at $0 indefinitely, with no trial clock and no card, screen stocks on fundamentals, show several years of financial statements, and do at least 2 of the following: chart a financial metric over time, track a portfolio, show SEC filings, or name the institutional holders or insider transactions. 7 tools met that bar. If you are ready to pay, our paid research platforms comparison covers 12 subscription products.
Every plan limit, history depth and price was read on each vendor's own pricing page, plan table or company pages on 15 October 2026 and screenshotted there. Prices are each platform's lowest advertised monthly price on that date. The Business Quant figures come from its own pricing page and product, and the Costco figures in its illustration come directly from its statements.
The reviews and summary table are alphabetical, with Business Quant placed last; the feature table is sorted by number of ticks, with ties broken alphabetically. Business Quant, which publishes this article, makes one of the 7 products compared here. I write for Business Quant.
Image credits. Header photograph by Markus Winkler on Unsplash, used under the Unsplash License. Vendor screenshots were captured on 15 October 2026 from each provider's own pricing, plan or company pages and are reproduced for comparison. Diagrams are Business Quant originals.
Frequently asked questions
What is the best free stock research tool?
For researching US-listed companies, Business Quant gives the most at $0 in one account: a screener on 818 metrics, charting and time series tables, 5 years and 20 quarters of statements, SEC filings, 13F holders, insider trades and a portfolio tracker, with no card. Finviz is the fastest free screener, TradingView the best free charting, Stock Analysis has the cleanest statement pages, and Yahoo Finance is the quickest way to look up almost any listed company.
Which stock research tools are free with no credit card?
All 7 here can be used at $0 without a card. Finviz asks only for a registration, and its screener runs without one. TIKR states "no credit card required" on its pricing page. TradingView labels its Basic plan $0 forever with no card needed. Stock Analysis and Yahoo Finance show most research pages without an account, and Koyfin keeps a permanent $0 plan. Business Quant is free to use with no card, and its stock screener runs for a guest with no account.
What is the best free stock research tool for beginners?
One that answers "what does this company earn, and is it growing?" without a manual. That needs readable statements going back at least 5 years, a simple screener, and somewhere to keep your holdings. Business Quant, Stock Analysis and TIKR show 5 years of annual statements at $0, and Business Quant adds charting of any metric, the SEC filings, institutional holders and insider trades on the same company page.
How many years of financial statements can I see for free?
Between 2 and 7, depending on the tool. On 15 October 2026, Koyfin showed 2 years and 12 quarters at $0, Finviz 3 years, Yahoo Finance 4 fiscal years plus the trailing twelve months, Stock Analysis 5 fiscal years plus trailing, Business Quant the latest 5 fiscal years and 20 quarters, and TradingView 7 years of annual data on its charts. TIKR's plan table lists 5 years and 8 quarters.
Which free tools show institutional ownership and insider trading?
Business Quant shows institutional ownership from 13F filings and insider trading from Form 4 on every US-listed stock page, free to use. Yahoo Finance shows the top institutional and mutual fund holders plus an insider roster and transactions. Finviz lists the largest managers and recent insider trades on each quote page, and TIKR shows the top 10 holders on its $0 plan. Koyfin keeps insider ownership for Plus, and Stock Analysis shows ownership as percentages rather than a list of holders.