10 Best Institutional Ownership Data APIs
I read all 10 pricing pages properly, including the tier boundaries that quietly hide where ownership data actually starts. Here is what each one costs and covers.

Institutional ownership data looks like a commodity. Every provider pulls the same public filings from the same regulator, so the marketing reads alike, and the price range runs from nothing to several hundred dollars a month for what appears to be identical information.
It is not identical, and the differences are rarely on the pricing page. Here is what I found actually varies once you read past the plan names.
- Which direction you can query. Almost everyone answers "who owns this stock". Far fewer will answer "what does this institution own", and on some platforms that second question is a different product tier.
- Where ownership data starts on the price list. On 2 of the 10 platforms below, the headline plan does not include holdings at all. On another, 13F sits on the top tier only.
- What the allowance really is. One platform advertises API access at $300 a year and then caps historical access at 50 funds per quarter. That is a research allowance, not a feed, and nothing on the pricing page says so.
- What licence you get. Several of these are non-commercial by default, so the published price does not apply to anything you intend to ship.
Every product below has a documented, publicly available API that returns institutional ownership data. Two well-known names that display holdings but offer no programmatic access are covered separately at the end. Every provider here is written up from its own published pricing rather than from memory, with the figures shown.
What you are actually buying
Before comparing anyone, it is worth being clear about the raw material, because most disappointment with this dataset comes from expecting things it never contained.
Institutional managers with more than $100 million in qualifying assets file a quarterly report of their US-listed long positions. It is due 45 days after quarter end, and that deadline governs everything downstream.
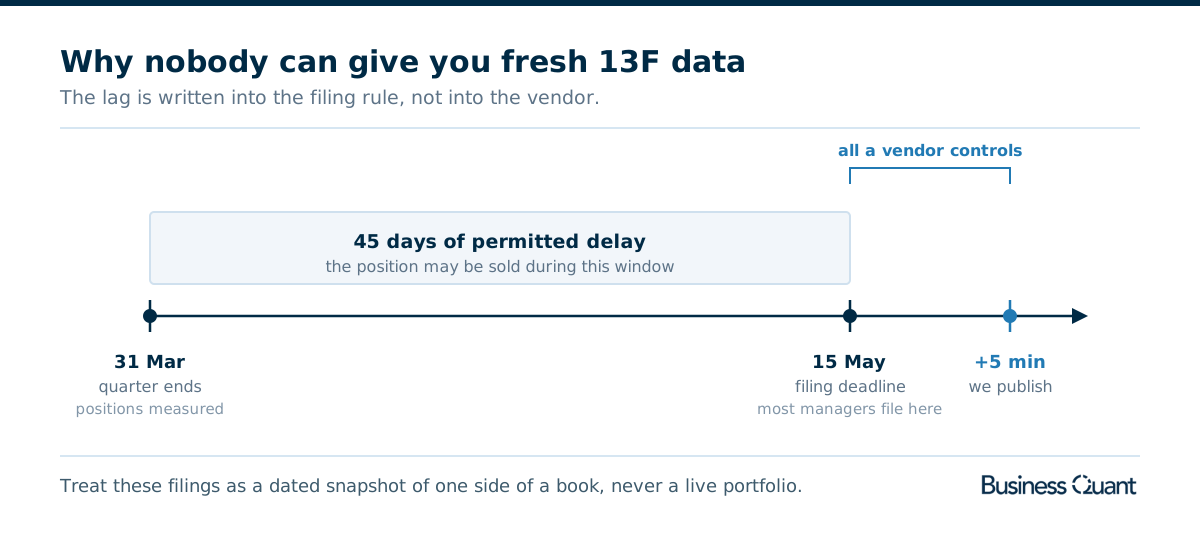
Look at where the vendors actually compete. Everything from quarter end to the filing deadline belongs to the manager, not to any data provider. When a provider advertises real-time ownership data, what they mean is that they publish quickly once the filing appears.
Three things about the form itself are worth committing to memory:
- It is long-only. Short positions, cash, bonds, most derivatives and anything not listed in the US are all excluded. A manager who looks committed to a long book may be fully hedged in instruments that never appear.
- It is a snapshot, not a position. The filing describes holdings on the last day of the quarter. A fund can have exited entirely before you read it.
- It clusters. Filings arrive in waves around mid-February, May, August and November, so your pipeline sees 4 spikes a year rather than steady flow.
Insider transactions, Forms 3, 4 and 5, are a different animal and worth pairing with holdings. Form 4 is due within 2 business days of the trade, so it is genuinely timely in a way quarterly holdings never are.
Things in this data that will trip you up
These are the problems that show up in week 2 of a project rather than week 1, and they are worth knowing before you pick a vendor, because how a provider handles them is a better test than any feature list.
- Securities are identified by CUSIP, not by ticker. The filings carry CUSIPs, so somebody has to map them to tickers before the data is useful, and that mapping changes over time as companies restructure. If a provider does the mapping for you, ask what happens to a CUSIP that no longer resolves. If it does not, budget for building that yourself.
- Amendments are common and easy to double count. Managers file restated 13Fs after the deadline, sometimes months later. Naive pipelines add the amendment to the original and report a position twice its real size. Check whether a provider supersedes the original or returns both, because either is defensible and only one matches your assumption.
- Filer names are not stable identifiers. Institutions rename, merge and reorganise, and the name on the filing follows. The CIK is the thing that persists. Any analysis keyed on a manager's name will quietly lose history at the point they rebranded.
- Some holdings are legitimately missing. Managers can request confidential treatment for positions they are still building, which the SEC sometimes grants. Those holdings appear later, backdated. A fund's reported book is not always its whole reported book at the time you read it.
- Share counts need split adjustment. A position that looks like it tripled may just be a 3-for-1 split between quarters. Whether the provider adjusts historical share counts, and whether it tells you it has, decides whether your change calculations mean anything.
- Put and call positions sit in the same file. 13F includes certain options positions alongside common stock. If you sum a column without filtering on the instrument type, your ownership totals will be wrong in a way that is hard to spot.
None of this is exotic. All of it costs a week if you meet it after building rather than before.
The 10 side by side
- SEC EDGAR
- WhaleWisdom
- Quiver Quantitative
- Fintel
- Unusual Whales
- sec-api.io
- Kaleidoscope
- Financial Modeling Prep
- Intrinio
- Business Quant
| Provider | Query by holder | Ownership history | Commercial use | Ownership from |
|---|---|---|---|---|
| SEC EDGAR | Raw filing only | Back to 1993 | Public domain | $0 |
| WhaleWisdom | Yes, its core | Back to 2001 | Enterprise | $300/yr |
| Quiver Quantitative | Yes | Not published | Contact only | $75/mo |
| Fintel | Yes | Not published | Separate licence | $10.95/mo |
| Unusual Whales | Partial | 2 years | From $625/mo | $150/mo |
| sec-api.io | Yes, by CIK or CRD | Back to 1994 | Enterprise | $49/mo |
| Kaleidoscope | Yes | Back to 1999 | Not published | On request |
| Financial Modeling Prep | Yes | Not published | Separate licence | $99/mo |
| Intrinio | Yes | Back to 2006 | From $333/mo | $150/mo |
| Business Quant | Yes, both directions | 15+ years | Enterprise | $0 |
Scroll the table sideways to see every column. Figures were read off each vendor's own pricing page on 13 August 2026, except Fintel's, which are explained in its section.
Who each provider is built for
SEC EDGAR
Worth starting here, because this is where every other product on this page gets its raw material, and it costs nothing.
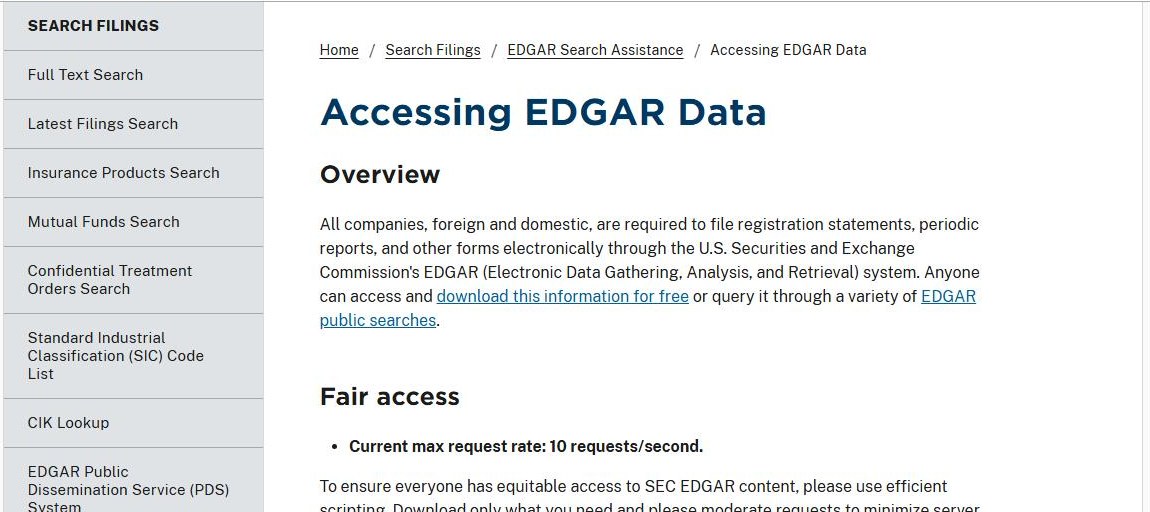
Institutional managers file their 13Fs with the SEC, and those filings become public the moment they are accepted. The official API will hand you the submission. The fair-access policy is 10 requests a second per IP, with a User-Agent header naming you and a contact email.
What you do not get is a dataset. You get documents. The holdings table inside a 13F has to be parsed, the CUSIPs mapped to tickers, the amendments reconciled against the originals, and the share counts adjusted for splits before any of it becomes a series you can query. That work is precisely what every paid option here is selling.
If your universe is a handful of managers and you are happy owning a parser, this is a legitimate answer and the price is unbeatable. Read the 6 problems in the section above before you commit, because those are the ones you would be taking on yourself.
WhaleWisdom
If this category has an elder statesman, this is it. WhaleWisdom launched in 2008 out of South San Francisco, which makes it older than a fair number of the funds it tracks, and that longevity shows up directly in the product. History runs back to 2001.
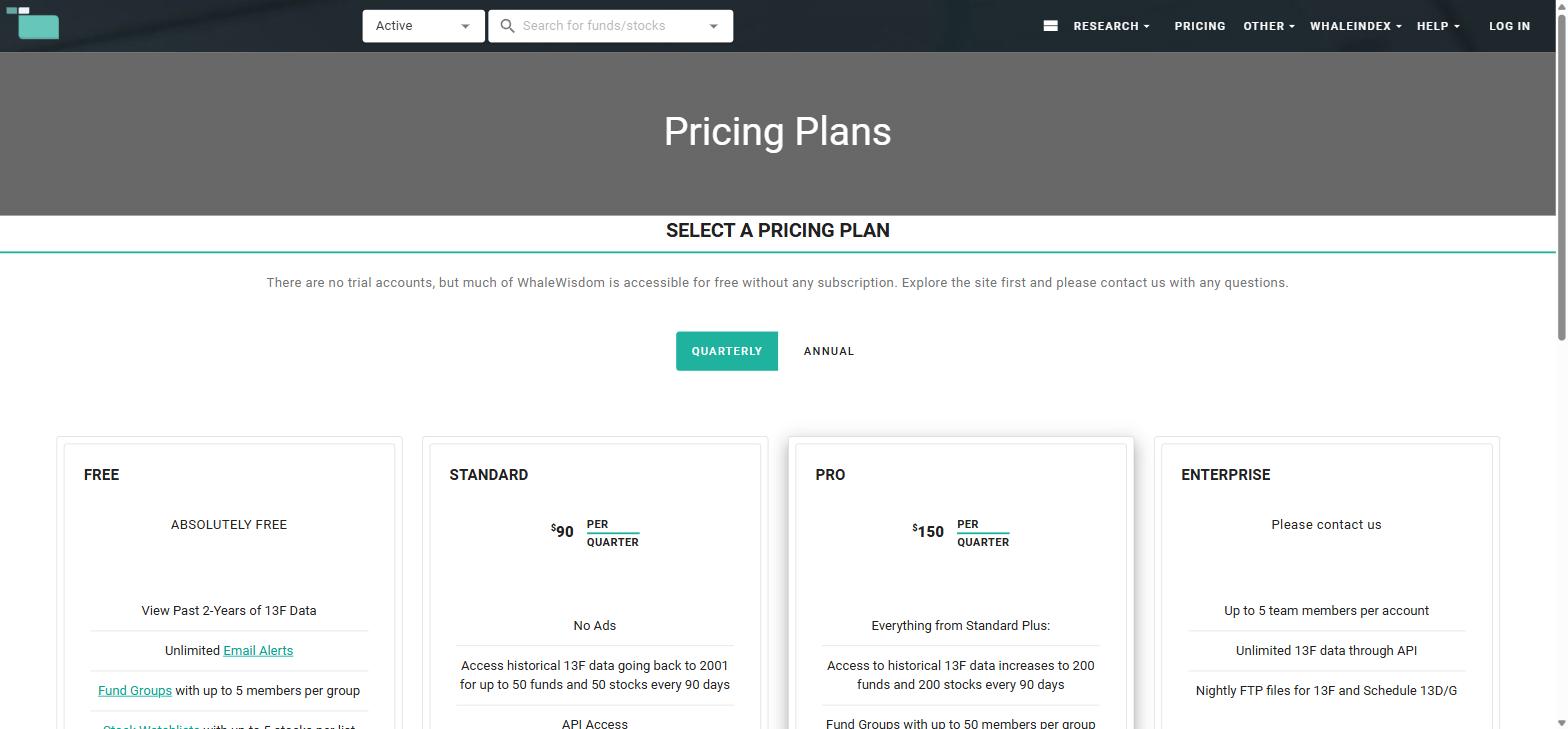
- Free. 2 years of 13F data, alerts, and fund groups of 5.
- Standard is $90 a quarter or $300 a year, and this is where API access begins.
- Pro is $150 a quarter or $500 a year, adding the Combined Holdings Report, full WhaleTrader access and the advanced backtester.
- Enterprise is priced on contact, and adds unlimited API access plus nightly FTP files covering 13F and Schedule 13D/G, across up to 5 seats.
Here is the line to read twice if you are considering it for anything programmatic. On Standard, historical access is capped at 50 funds and 50 stocks every 90 days. Not per day. Per quarter. Pro raises that to 200 and 200. Excel exports are separately capped at 3,000 records per download, and export is not offered on the 13D/G search or Global Holdings views at all.
That shape suits sustained research on a defined set of managers. If your plan involves thousands of filers, enterprise is the tier to price against rather than the $300 headline.
Quiver Quantitative
Quiver came out of the retail data wave and went sideways rather than deeper. Instead of competing on 13F coverage it assembled datasets nobody else was structuring: congressional and senate trading, politician net worth, corporate lobbying, government contracts, patents, executive compensation, even app store ratings.
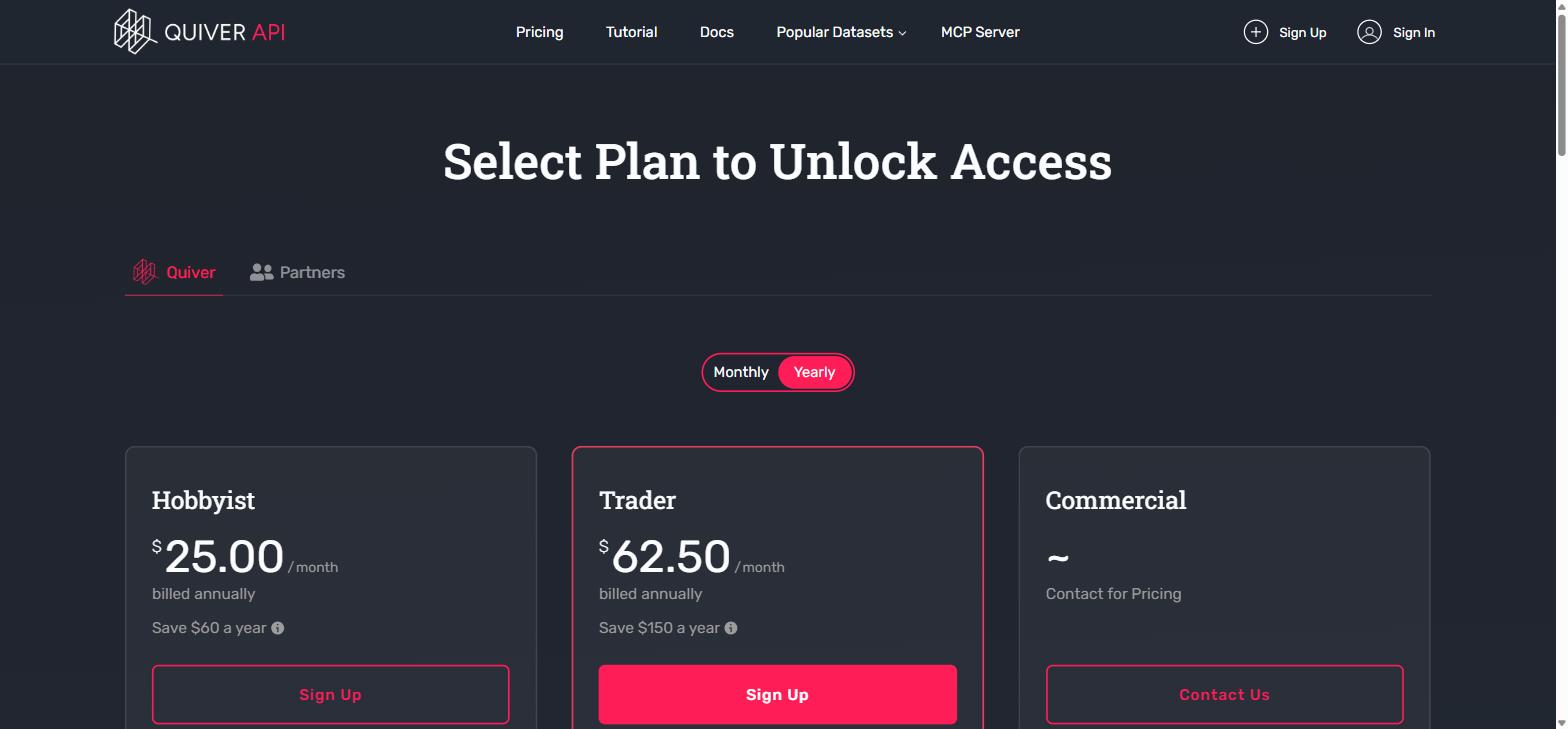
- Hobbyist is $30 a month, or $25 annually, and covers the political and government feeds with 10 of their 18 MCP tools.
- Trader is $75 a month, or $62.50 annually, and is where 13F holdings, insider trading and top shareholders begin, along with all 18 MCP tools.
- Commercial is priced on contact and is the only tier carrying commercial rights.
Two boundaries here are easy to miss. The first is that the $30 plan contains no ownership data at all, so if you came for institutional holdings your entry price is $75. The second is that Hobbyist and Trader are both non-commercial licences, so anything shipping to customers needs a conversation before you build.
Their MCP server is the most developed on this page: 18 tools, with the same API key working across REST and MCP.
Fintel
Fintel was founded in 2015 by Wilton Risenhoover, and it holds a corner of this market that nobody else here occupies. It pairs institutional ownership with the short side, in one interface, at retail prices.
The ownership half is broad: 13F and 13D/G institutional filings plus Form 4 insider transactions, sourced directly from the SEC and traceable back to the filing that produced each row. On top of the raw records Fintel layers proprietary models, an Ownership Score that ranks accumulation and a Short Squeeze Score, and exposes the catalogue through its API. Coverage runs to hundreds of thousands of securities and thousands of funds, including international markets.
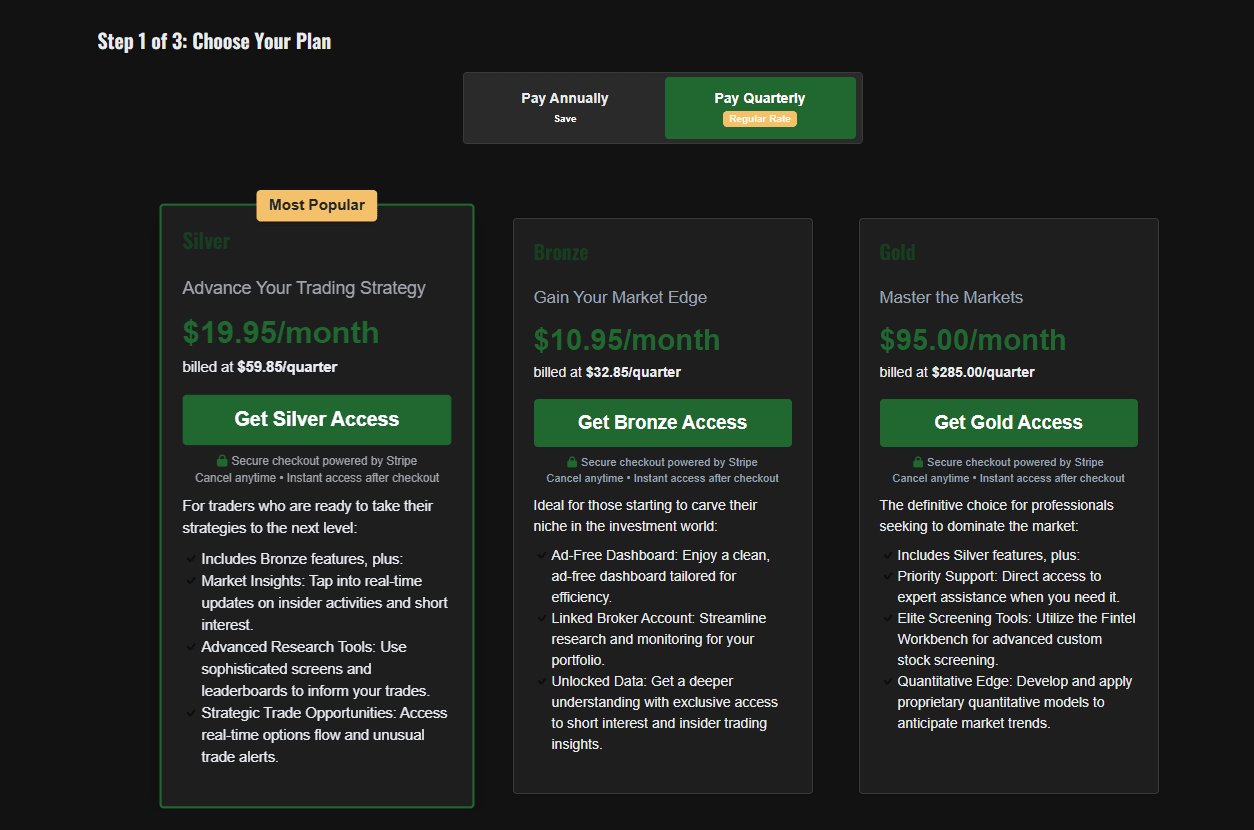
- Bronze is $10.95 a month, billed at $32.85 a quarter: an ad-free dashboard, a linked broker account, and unlocked access to the deeper short-interest and insider data.
- Silver, $19.95 a month, adding real-time insider activity, short interest and options flow.
- Gold, $95.00 a month, adding the Workbench and proprietary quantitative models.
- Annual billing discounts every tier, and the API is licensed separately from the dashboard plans.
What makes Fintel distinctive is the short-side stack sitting beside the ownership data: NASDAQ short interest, FINRA off-exchange short volume, SEC fails-to-deliver, and cost-to-borrow rates that update through the day. Assembling those 4 from primary sources yourself is a genuine project. One thing to design around: official short interest publishes on a lag of roughly twice a month, so it is a periodic snapshot rather than a live series, and the daily FINRA volume is what fills the gap between prints.
Unusual Whales
Unusual Whales is an options flow platform that also carries ownership, and I put it that way round deliberately because it explains the shape of the product. Its centre of gravity is the tape: real-time options flow across every US exchange, dark pool prints, gamma exposure, market maker positioning.
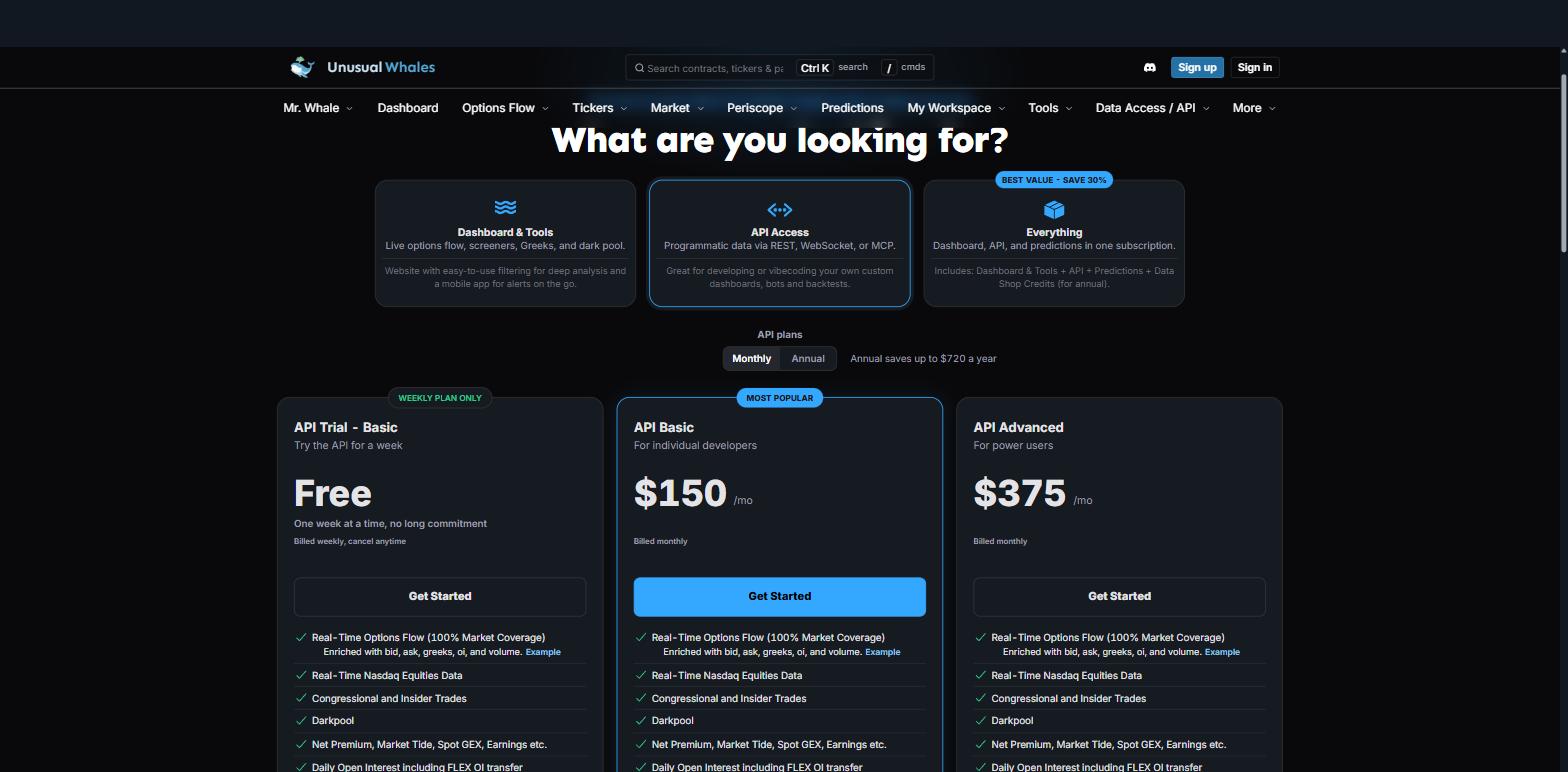
- API Trial costs nothing, billed weekly and cancellable anytime, with 30,000 requests a day and a 90-day lookback.
- API Basic is $150 a month for 40,000 requests a day and a 2-year lookback.
- API Advanced is $375 a month for unlimited daily requests plus WebSocket streaming.
- Business plans start around $625 a month billed annually, and that is where commercial licensing lives.
- Dashboard products are a separate ladder at $50, $75 and $120 a month, and that is where institutional holders appear.
The 2-year lookback is the number to weigh if you are studying ownership across a full cycle, and holdings sit alongside the options data rather than at the centre of it. They also ship an MCP server.
sec-api.io
sec-api.io comes at ownership from the filings side, which shows in what it gives you back: not just the holdings, but the cover page that came with them.
- Holdings and cover pages from Form 13F filings, 1994 to present, so the reporting manager's own metadata travels with the positions.
- Query by name, CIK or CRD of the fund or manager, plus filing publication date and the quarter the filing references, which covers the owner-side question directly.
- Issuer, class, CUSIP, CIK, ticker, value and share count on every holding.
- REST, with SDKs for Python, C#, Node.js and R, and a sandbox for testing queries before you write code.
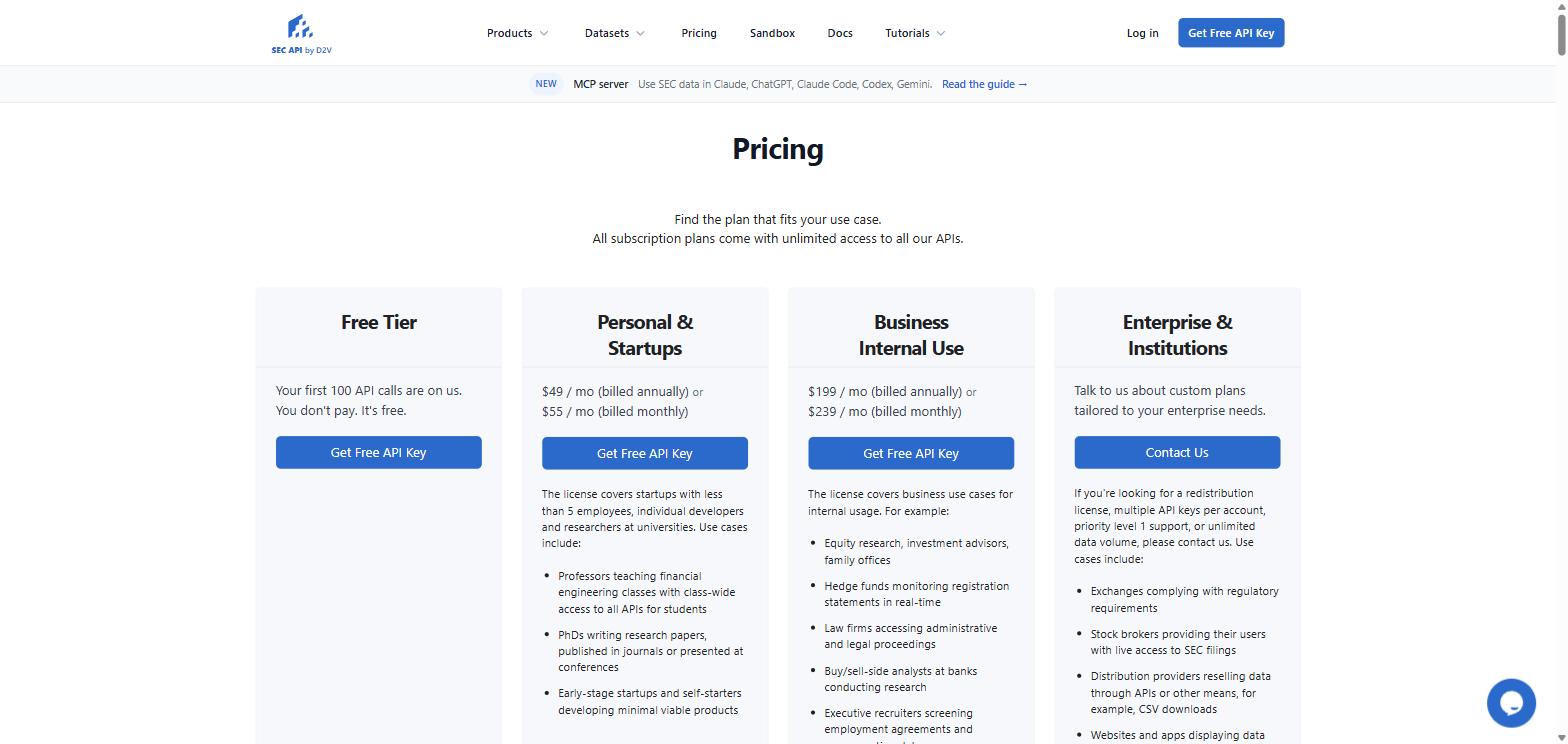
- Pricing starts at $49 a month on the Personal and Startups plan, with redistribution rights on Enterprise.
The cover page data is the part people underuse. It carries the manager's own declaration of what the filing includes, which is how you catch confidential-treatment omissions and amendment relationships rather than inferring them from the numbers.
Kaleidoscope
Kaleidoscope bundles ownership into a wider SEC data platform, and the ownership piece is more considered than a bundled feed usually is.
- 5,000+ investors tracked since 1999, which is the second-deepest 13F history in this comparison.
- Quarterly position diffs and full historical trends supplied directly, so the change calculations are not left to you.
- Insider trading across Forms 3, 4, 5 and 144, and the 144 coverage is unusual, since planned sales by affiliates rarely appear alongside ordinary insider data.
- 18 data APIs in total, spanning 18M+ filings since 1994 and 400+ form types with full-text boolean search.
- Pricing is not published, and integrations are handled through their sales team.
Precomputed diffs plus Form 144 in the same place is a genuinely useful pairing if you are trying to see accumulation and distribution together. Budget for a sales conversation rather than a signup, since no tiers are listed publicly.
Financial Modeling Prep
FMP has been going since 2017 and now claims more than 100,000 customers, mostly on the strength of covering an enormous amount of ground cheaply. What I had not appreciated until I read the endpoint list properly is how developed its ownership suite is.
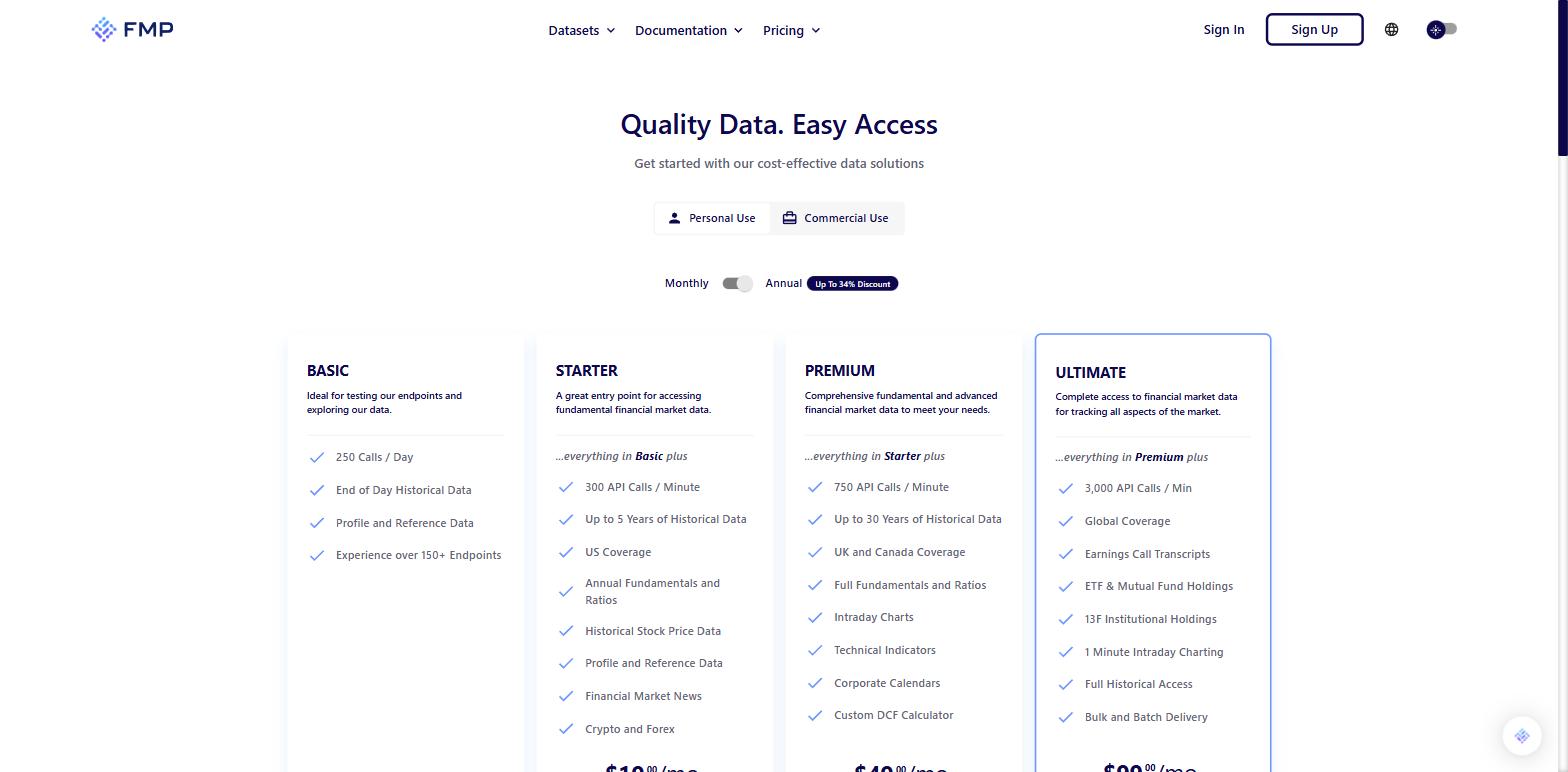
There are 8 dedicated Form 13F endpoints, and several go past raw holdings into analysis: filings extract with analytics by holder, holder performance summary, holders industry breakdown, positions summary and industry performance summary.
- Basic costs nothing and allows 250 calls a day on end-of-day data.
- Starter is $19 a month for 300 calls a minute and 5 years of history.
- Premium is $49 a month for 750 calls a minute and 30 years.
- Ultimate is $99 a month, and is the only tier carrying 13F institutional holdings, alongside global coverage, fund holdings and bulk delivery.
There is also a bandwidth ceiling measured on a trailing 30 days: 500 MB on free, 20 GB on Starter, 50 GB on Premium and 150 GB on Ultimate. Bulk ownership pulls are heavy, so check that against your plans. Display or redistribution needs a separate licensing agreement.
Intrinio
Intrinio approaches this from the opposite end. Rather than selling ownership as a product, it includes institutional holdings and insider transactions inside its US Fundamentals feed, sourced directly from the SEC, with history back to 2006.
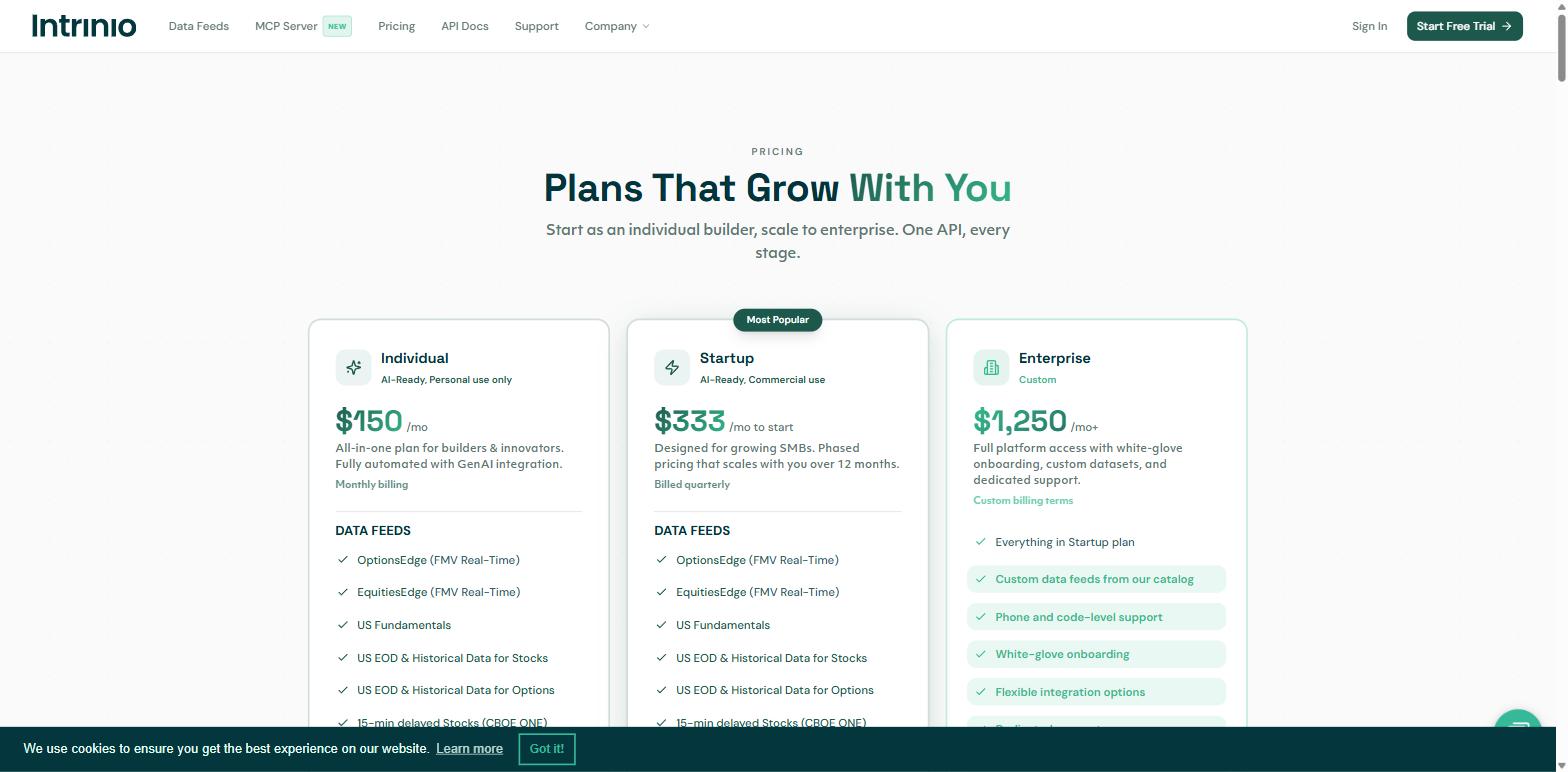
- Individual is $150 a month, personal use only, one seat, with no redistribution or display rights.
- Startup begins at $333 a month billed quarterly, carries commercial use and display rights on a business-wide licence, and steps to $666 and then $999 across 12 months.
- Enterprise starts at $1,250 a month with custom feeds, an SLA and an account manager.
- Delivery is available through API, CSV, Snowflake or S3, which matters if your team works in a warehouse rather than against REST.
Their plans are structured around what you are allowed to do rather than what you get, which makes the licensing question unusually easy to answer up front. Ownership is one feed among many, so the entry price reflects the whole platform rather than the holdings alone.
Business Quant
The thing I would ask you to test Business Quant on is the question this whole comparison turns on: the dataset is queryable from both ends.
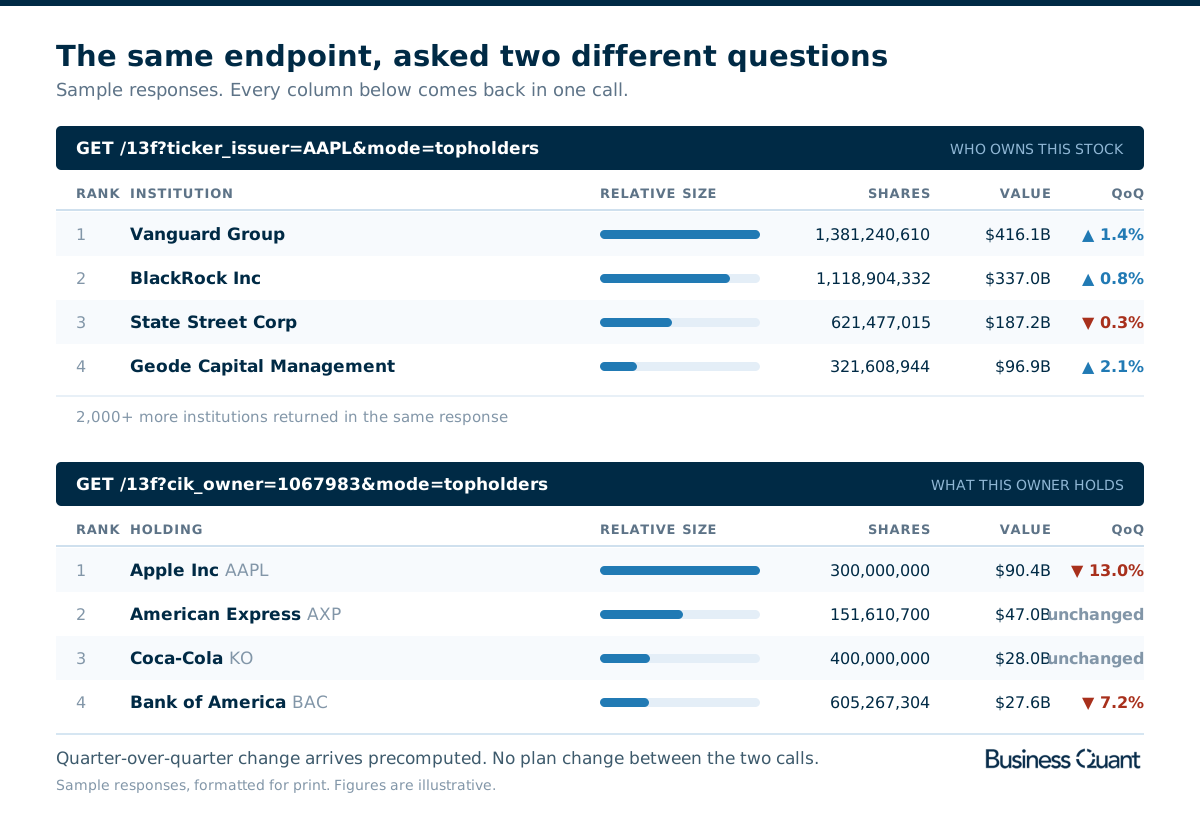
Pass an issuer and you get its holders. Pass an owner and you get that institution's entire portfolio. Here is what comes with that:
- 5 modes on the same endpoint. Top holders, aggregate statistics, quarterly history with position deltas already computed, every individual transaction, and a summary.
- Deltas calculated server-side. Quarter-over-quarter and year-over-year changes arrive computed, which removes the step where most people quietly introduce errors.
- Insider data under the same key, Forms 3, 4 and 5 with transaction codes.
- Roughly 15 years of history, with 2,000+ institutions on a typical mega-cap.
- Published within about 5 minutes of a filing appearing on EDGAR.
- Free to use for research, with commercial use on the enterprise plan.
Parameters, modes and a sample response are in the 13F Institutional Ownership API documentation.
One thing worth understanding about where this data comes from, because it explains the numbers above. Business Quant collects and parses everything itself, straight from the source, rather than licensing a feed from an upstream vendor and reselling it. That removes the constraints an intermediary inherits: there is no supplier contract dictating how often the data can refresh, no redistribution clause forcing artificial rate limits, and no queue behind another company's processing schedule. It is why the latency is 5 minutes rather than a day, and why new fields and endpoints ship on our own timetable.
Holdings also carry sector and industry from BQ-MICS, the Business Quant Multi-Industry Classification System, covering 11 sectors, 71 industry groups and 288 industries. It gives each company one primary industry plus every other industry it genuinely operates in, so a conglomerate is not forced into a single bucket when you roll a fund's positions up by sector. The full methodology is published, and the system is licensable separately.
That last point is worth a moment, because it changes an answer rather than a label. Take a fund holding Amazon, Apple and Alphabet. Under a single-bucket scheme you get a portfolio that looks concentrated in consumer discretionary and technology, and the retail, advertising, cloud infrastructure and media exposure inside those 3 positions is invisible. BQ-MICS tags each company with everything it actually does, so the same portfolio rolls up to show the advertising and cloud exposure explicitly. If you are measuring what a manager is really long, that distinction is the analysis rather than a presentational detail.
The ownership data also sits alongside the rest of the platform under the same key, which matters more than it sounds. Holdings tell you who owns a company. The financial statements, segment revenue, KPI and operating data tell you what they own, and the filings API gives you the documents underneath. Answering "which institutions increased their position ahead of a segment inflecting" is one key and 3 calls rather than a procurement exercise across 3 vendors. All of it is first-party, so those datasets share identifiers and update on the same schedule instead of arriving from different suppliers at different times.
Two names you might have expected
HedgeFollow and 13F.info come up in almost every conversation about this data, and neither publishes an API, so neither belongs in a comparison of them.
They are worth knowing anyway. HedgeFollow tracks more than 10,000 funds and attaches computed 3-year performance, assets under management and concentration figures to each manager, which is more arithmetic than most trackers do for you. 13F.info is a fast, account-free viewer for raw filings that has quietly added Form D coverage. Both answer questions in a browser in seconds. Neither exposes an endpoint you can build against.
What the Business Quant API returns
| What you want | How you get it |
|---|---|
| Every institution holding a stock | ticker_issuer with the top holders mode |
| A fund's entire reported portfolio | cik_owner on the same endpoint |
| How a position changed over time | Historic mode, with deltas precomputed |
| Every filer in a stock, paginated | All transactions mode |
| Insider buying and selling | Forms 3, 4 and 5 under the same key |
| Quarterly insider flow | Net trading activity mode |
| Sector rollups across a portfolio | BQ-MICS classification on every holding |
| To ship it in a product | Commercial use, on the enterprise plan |
My pick, and a 10-minute way to test it
If what you need is the ownership data itself, queried properly and at volume, I would start with Business Quant, and I would start today.
The reasoning is checkable against everything above. You can query by issuer and by owner from the same endpoint. You get 5 precomputed modes instead of raw rows you have to aggregate yourself. Insider transactions come under the same key rather than as a second subscription. And none of it costs anything to try.
I would push you to try rather than read, because this dataset rewards having hands on it. Pick a company you know well and pull its holders. Then take the largest 2 or 3 institutions from that list and pull their entire portfolios. It takes about 10 minutes. Either the shape of what comes back tells you something you did not know, in which case you have your answer, or it does not, and you have lost 10 minutes and learned something real about your own requirements.
Grab a key and run that test. There is nothing to cancel afterwards.
If you want to go a layer deeper on the filings underneath all of this, I wrote up the SEC filings API comparison separately, and the financial statements API comparison covers how ownership sits alongside fundamentals in a full stack.
How this comparison was made
One test decided the roster: a documented, publicly available API that returns institutional ownership data. Two well-known trackers were excluded for having no API at all, and are named in the article rather than quietly dropped. Everything that failed it was left out, however well known.
Prices, limits and coverage figures were read off each vendor's own published material on 13 August 2026, not from other roundups, and screenshots are dated where they appear. Where a vendor does not publish a figure, the table says so rather than carrying an estimate.
Every provider here is described from its own published material rather than characterised, and Business Quant appears in roster order rather than at the top. Business Quant, which publishes this page, makes one of the 10 products compared here.
Image credits. Header photograph by Douglas Lopes on Unsplash, used under the Unsplash License. Vendor screenshots were captured on 13 August 2026 from each provider's own pricing page and are reproduced for comparison, except the Fintel plans page, which is reproduced via CurvedTrading's Fintel review. Diagrams are Business Quant originals.
Frequently asked questions
Is there a free institutional ownership API?
Yes. Business Quant is free to use for institutional holdings and insider transactions. Commercial use sits on the enterprise plan. The filings themselves are public on EDGAR at no cost, so what you are paying anyone for is parsing, history and query shape rather than the data.
How quickly does 13F data appear after a filing?
Business Quant publishes within about 5 minutes of a filing landing on EDGAR. It matters less than you would expect, because the form carries a 45-day reporting deadline, so the data already describes a portfolio roughly 6 weeks old by the time anyone can publish it.
Can I look up everything one fund owns, not just who owns one stock?
Yes, and this is the question that separates these products. Most are issuer-first: you pass a ticker and get its holders. The Business Quant API takes owner-side parameters on the same endpoint, so you can pass an institution and get its entire reported portfolio without a different plan or a different call.
Does 13F show short positions?
No, and this is the most common mistake made with the data. The form covers long positions in US-listed equities and some options. Short positions, cash, bonds and foreign listings are excluded, so a manager who looks fully long may be hedged in instruments the filing never shows.