Top 6 Stock Screener APIs Compared
6 APIs will take a screen and run it for you. How much of yours fits in a single request?

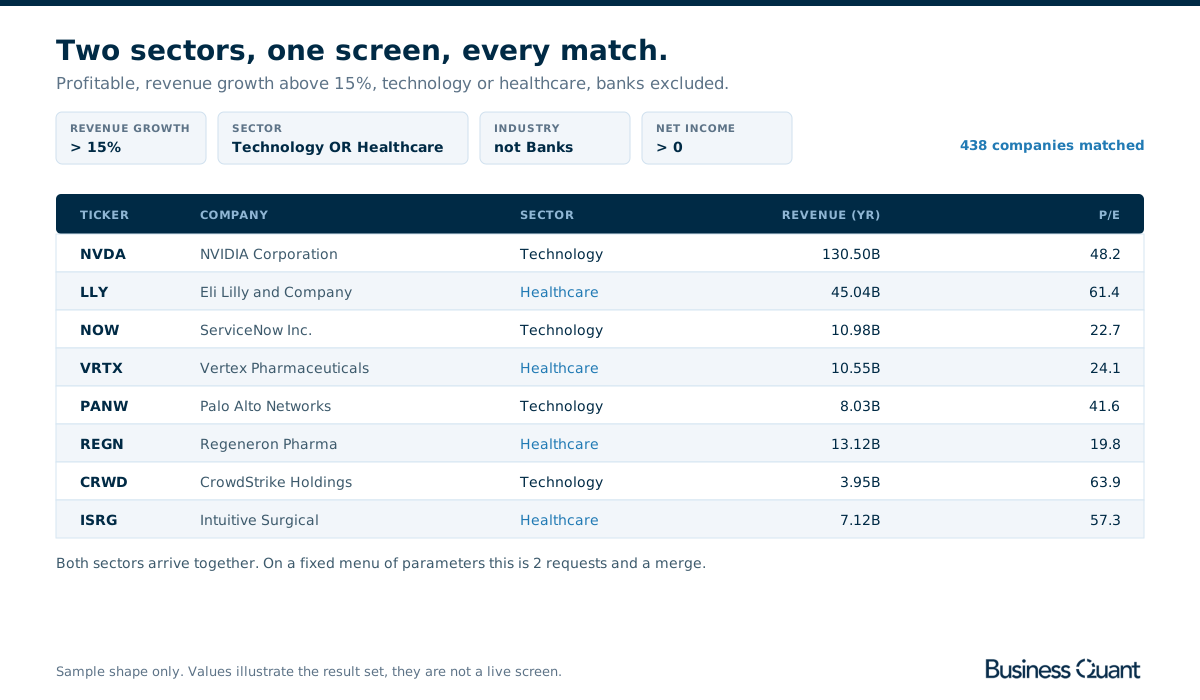
Picture the screen you actually run: profitable, growing faster than 15%, technology or healthcare, and not a bank. Most screener APIs cannot express it, because they accept a fixed menu of named filters joined silently with AND and nothing else.
6 products ship an endpoint you can send real conditions to. This compares what each one lets you ask, how far into the results it will let you page, and what it costs. Business Quant makes one of the 6.
Several well-known APIs are missing from that list on purpose. A section near the end names them and says what they return instead.
Two filter models
Every screener API in this comparison is one of 2 designs, and the design decides the ceiling far more than the metric count does.
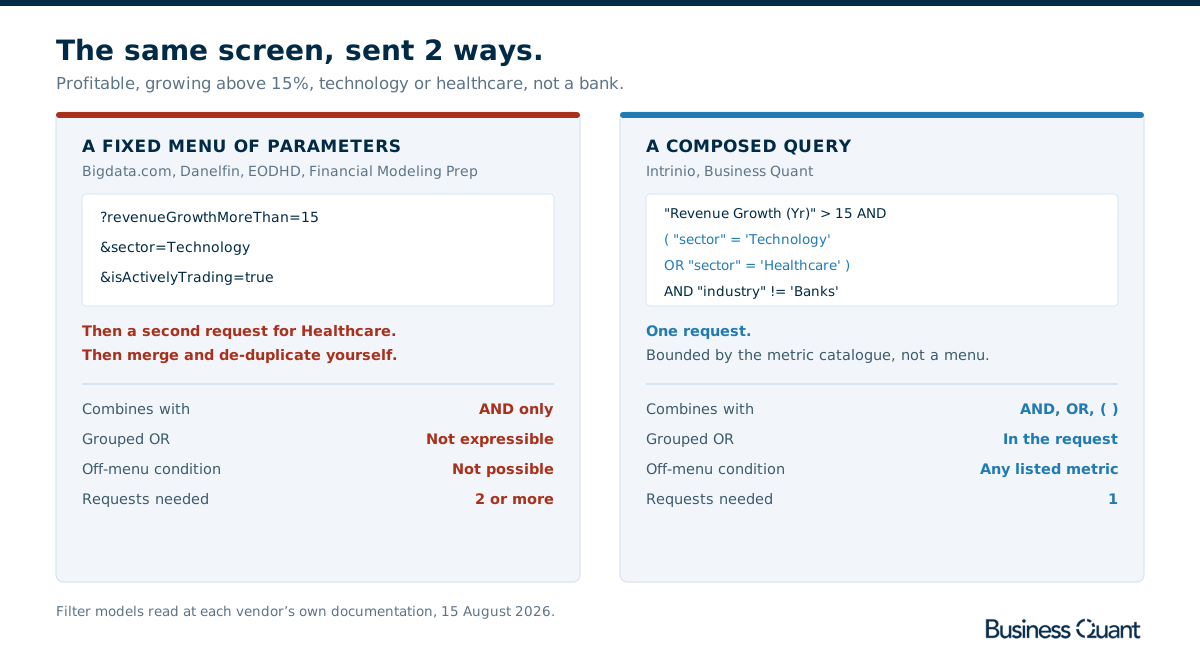
A fixed menu of parameters is the common design and the easier one to learn. The vendor exposes a bounded set of named filters, you set the ones you want, and they are joined with AND. Bigdata.com, Danelfin, EODHD and Financial Modeling Prep all work this way. The parameter names are self-documenting, the requests are readable, and for a great many screens this is genuinely enough.
Two things stop it. There is no disjunction, so "technology or healthcare" has to become 2 requests that you merge and de-duplicate yourself. And there is no extension mechanism, so any condition the vendor did not expose as a parameter is simply unavailable, whatever the underlying database holds. The second limit is the one that bites, because it has no workaround short of pulling more rows than you wanted and finishing the job in code.
A composed query inverts the relationship. Rather than offering parameters, the API accepts an expression and evaluates it against a catalogue of metrics. Intrinio takes a logic structure of operators, clauses and nested groups. Business Quant takes a composed condition using AND, OR and parentheses over its metric catalogue. Expressiveness stops being bounded by a parameter list and becomes bounded by the catalogue, which is a much higher ceiling.
The practical difference shows up the first time a screen refuses to fit. On a parameter list you go away and write orchestration code. On a composed query you add a clause.
The ceiling nobody advertises
The second question separates the field just as sharply and it is almost never on a product page: once your screen matches, how many of the matches can you actually retrieve?
EODHD is the clearest case because its documentation is explicit. The limit parameter caps at 500 rows and the offset parameter caps at 999. Those 2 numbers together mean the first 1,000 matching companies are reachable and the rest are not, regardless of how many matched. A screen returning 4,000 names gives you a quarter of them, and nothing in the response announces that you are looking at a truncated set.
Bigdata.com caps its limit at 1,000, defaults to 100, and documents no offset or cursor at all, so the ceiling and the page are the same thing. Intrinio documents a page_size maximum of 50,000, which for a US equity screen is effectively no ceiling. The Business Quant screener reports the full match count alongside the results, so a pipeline can page to the end and know when it has arrived.
This matters most in exactly the situation where a screener earns its keep. A narrow screen returning 40 names works everywhere and tells you nothing about the product. A broad screen across the full universe, the kind you run to build a research universe or a backtest population, is where a 1,000-row ceiling silently changes your answer. Test with a deliberately loose screen before you commit.
Screening without a screener
It is worth being straight about the option that costs nothing, because for many workloads it is the right answer.
You can screen without a screener endpoint. Pull a fundamentals snapshot for your universe, load it into a dataframe or a table, and filter it locally. The expressiveness problem vanishes completely: pandas does not care whether your condition is a disjunction, and SQL will group whatever you like. There is no ceiling either, because you already hold every row.
The cost is not the filtering, it is everything around it. You have to assemble the universe before you can filter it, which is one request per symbol on most fundamentals APIs unless the vendor sells a bulk file, and it has to be reassembled on whatever cadence keeps your screen current. You own the metric definitions, so when trailing twelve month revenue has to mean the same thing for a company that changed its fiscal year, that is yours to solve. And you carry the storage, the refresh and the reconciliation when a restatement lands.
At 200 tickers and a weekly screen, that trade is fine. It gets worse as the universe widens and the cadence tightens, which is the entire argument for a screener endpoint: the vendor has already assembled the universe, already normalised the metrics and already keeps them current. If you are assembling that snapshot from statements today, the financial statements API comparison covers who normalises those numbers well enough to filter on.
The 6 compared
| Platform | Filter model |
Conditions combine with |
Result ceiling |
|---|---|---|---|
| Bigdata.com | Named parameters | AND only | 1,000 rows |
| Danelfin | Named parameters | AND only | Top 100 unfiltered |
| EODHD | Named parameters | AND only | First 1,000 matches |
| Financial Modeling Prep | Named parameters | AND only | Caller-set limit |
| Intrinio | Composed query | Nested groups | 50,000 per page |
| Business Quant | Composed query | AND, OR, parentheses | Paged to the full set |
Scroll the table sideways for every column. Rows run by filter model, simplest first, alphabetically within each model, with Business Quant placed last.
Each screener up close
Bigdata.com
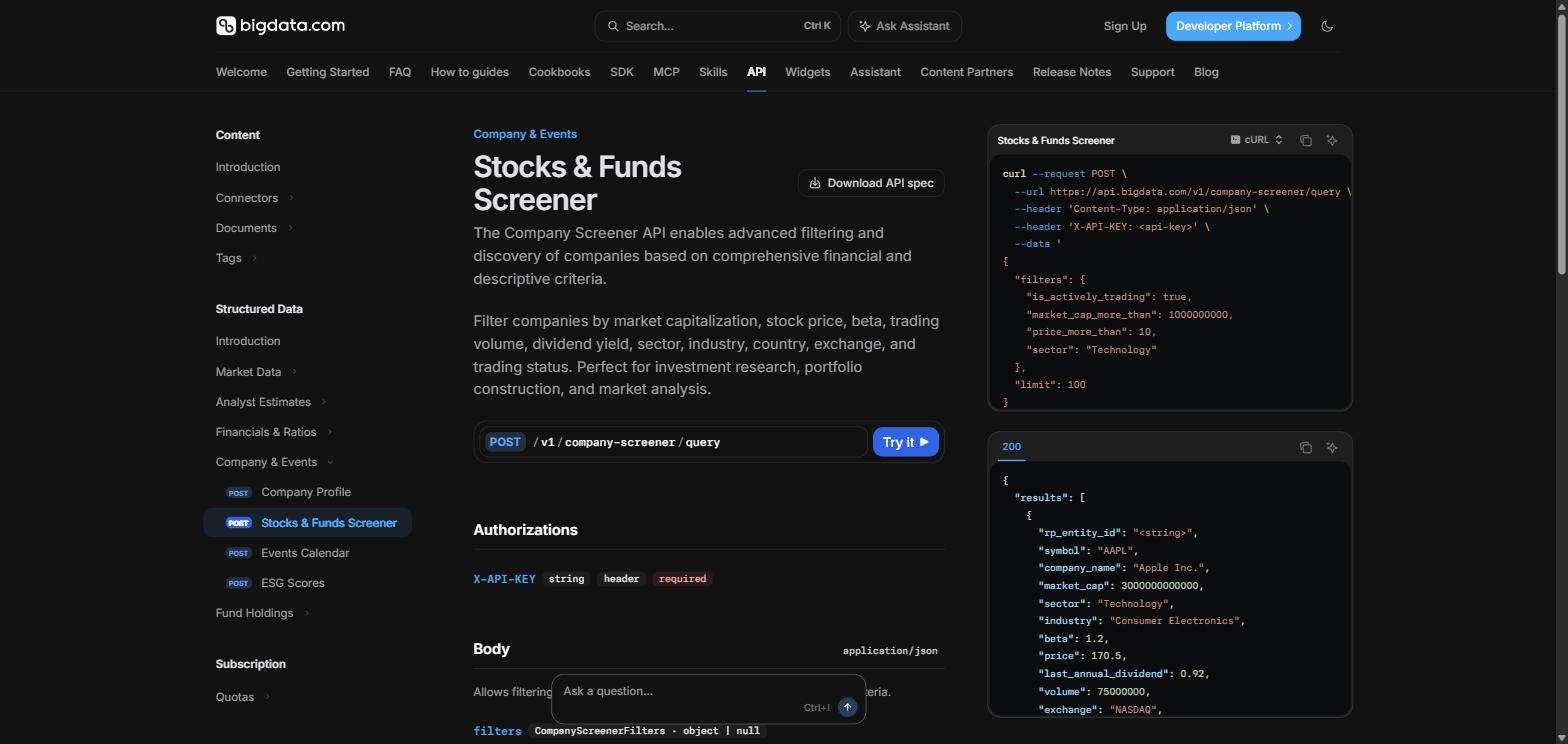
The newest name here and the most conventionally designed. Screening is a POST to a company screener endpoint with the filters as a JSON object, which reads more cleanly than a long query string while behaving in exactly the same way underneath.
- Roughly 15 filter dimensions.
- Ranged filters for market cap, price, beta, volume and dividend yield.
- AND only. No OR, no nesting.
- Limit caps at 1,000, defaults to 100.
- No offset or cursor documented.
- No published price.
The filter set covers the classic first-pass screen: size, valuation, sector, country, exchange, and flags to keep ETFs and funds out of an equity screen. Its real constraint is the pagination story, or rather the absence of one. With the limit capped at 1,000 and no cursor documented, a broad screen has no mechanism to reach whatever sits beyond the first response, so this is a product for narrowing rather than for enumerating.
Danelfin
The odd one out, and worth understanding before you either dismiss it or adopt it. Danelfin does not let you filter on revenue or margins at all. It scores every US-listed and main European stock on 5 proprietary measures from 1 to 10, and the screening endpoint filters on those scores rather than on anything drawn from a financial statement.
- GET /ranking, with 14 query parameters.
- 5 score filters, each 1 to 10, with minimum thresholds.
- No statement line items. Scores only.
- Sector, industry, asset and market filters.
- A fields parameter selects the returned columns.
- Top 100 returned when only a date is supplied.
- Daily scores since 2017, US and Europe.
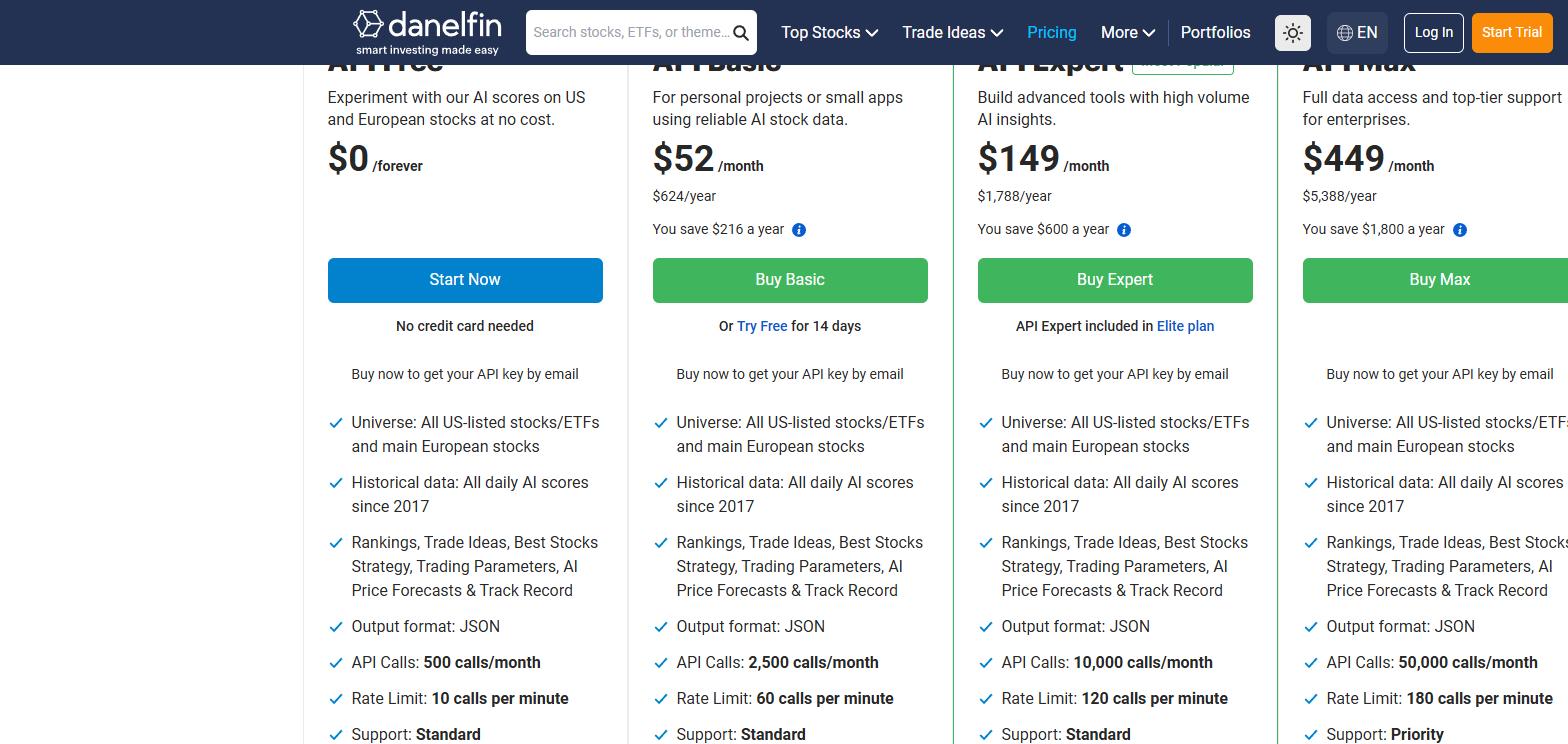
- $0 to start, then $52, $149 and $449 a month.
The scores are the product, so a screen here runs over somebody else's model rather than over the underlying financials. Whether that is the appeal or the dealbreaker depends on whether you want to form your own view. It cannot answer "companies trading under 15 times earnings". It can answer "healthcare companies whose fundamental score is 8 or better", which is a different kind of question and a legitimate one.
The history is the genuinely useful part for anyone testing an idea. Daily scores back to 2017 across the covered universe make the endpoint a backtesting source as much as a screener, and the free plan is enough to find out whether the scores carry signal for you before paying. At that tier the limit is 10 calls a minute and 500 a month, which is a trial rather than a workload.
EODHD
End-of-day and fundamental data at accessible prices across a long tail of global exchanges, and a screener whose documentation is unusually explicit about its own limits. That candour is rare enough to be worth saying plainly, and it makes the product easy to evaluate before you spend anything.
- 14 filterable fields.
- Rich operators, including in and not in for set membership.
- AND only. Stated in those words in the docs.
- 6 precomputed signals, including new 200-day highs and lows.
- First 1,000 matches only. Limit caps at 500, offset at 999.
- Each request costs 5 API calls.
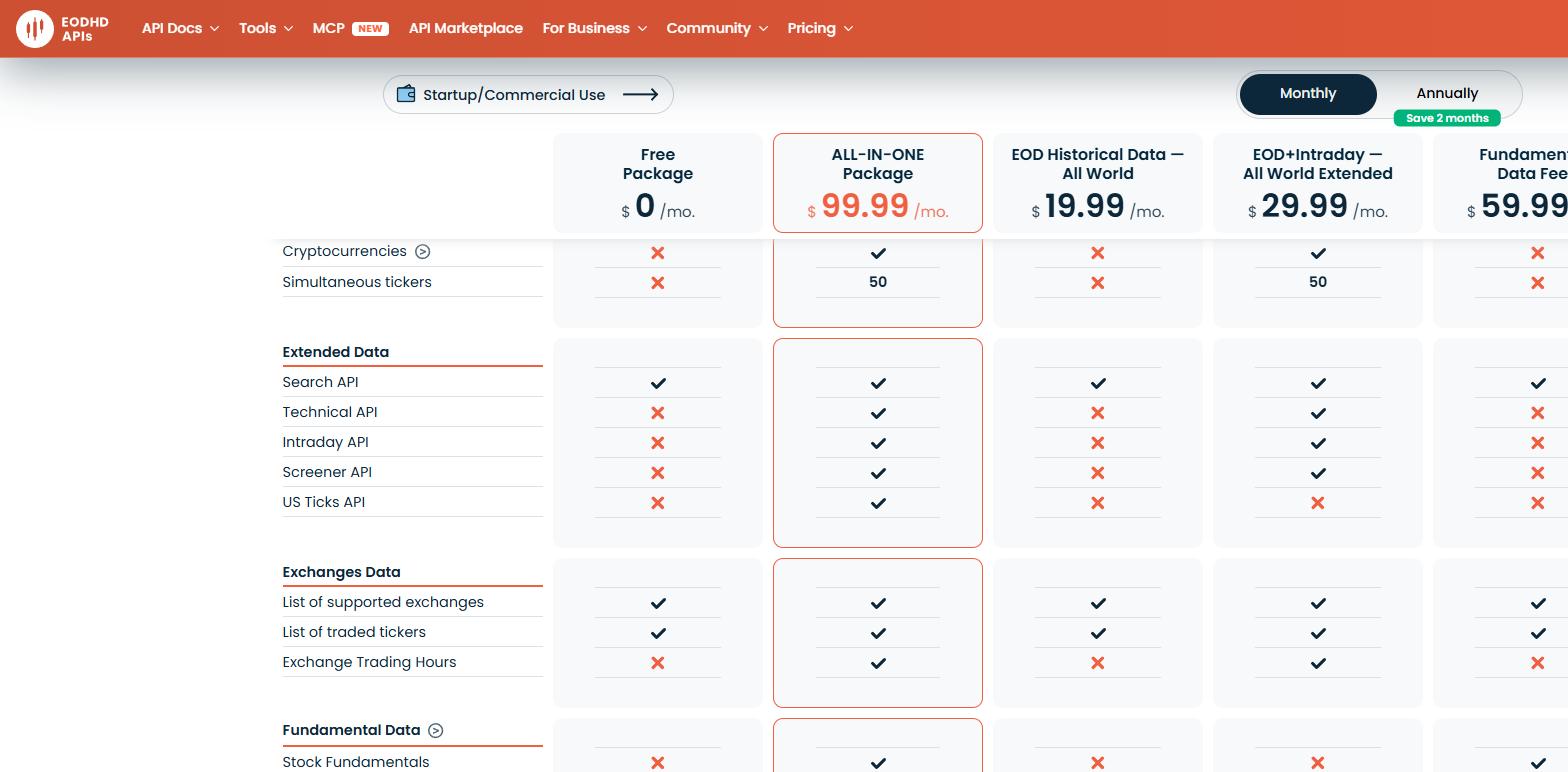
- $29.99 a month on EOD+Intraday All World Extended.
The operator set does more work than the field count suggests. Set membership in particular handles "any of these 6 sectors" in a single condition, which is the one shape of disjunction a strict AND parameter list can usually still express, and most competitors do not offer it. The signals are a genuine convenience too, since a new 200-day high is the kind of derived condition you would otherwise compute from a price series yourself.
The offset ceiling is what to check first against your own use. It is invisible while you are testing on a narrow screen and severe the moment you widen one, and the 5-call cost per request means a paging loop consumes an allowance faster than the row count suggests.
Financial Modeling Prep
The name that comes up most when this category is searched, and the screener is a real one: a documented company screener endpoint taking named comparison parameters and returning the matching set. It is the clearest example of the parameter model, and it is popular for a good reason, which is that you can read a request and know exactly what it does.
- Named comparison parameters, such as marketCapMoreThan and betaLowerThan.
- Sector, industry and country filters.
- Instrument flags for isEtf, isFund and isActivelyTrading.
- AND only. No OR, no grouping.
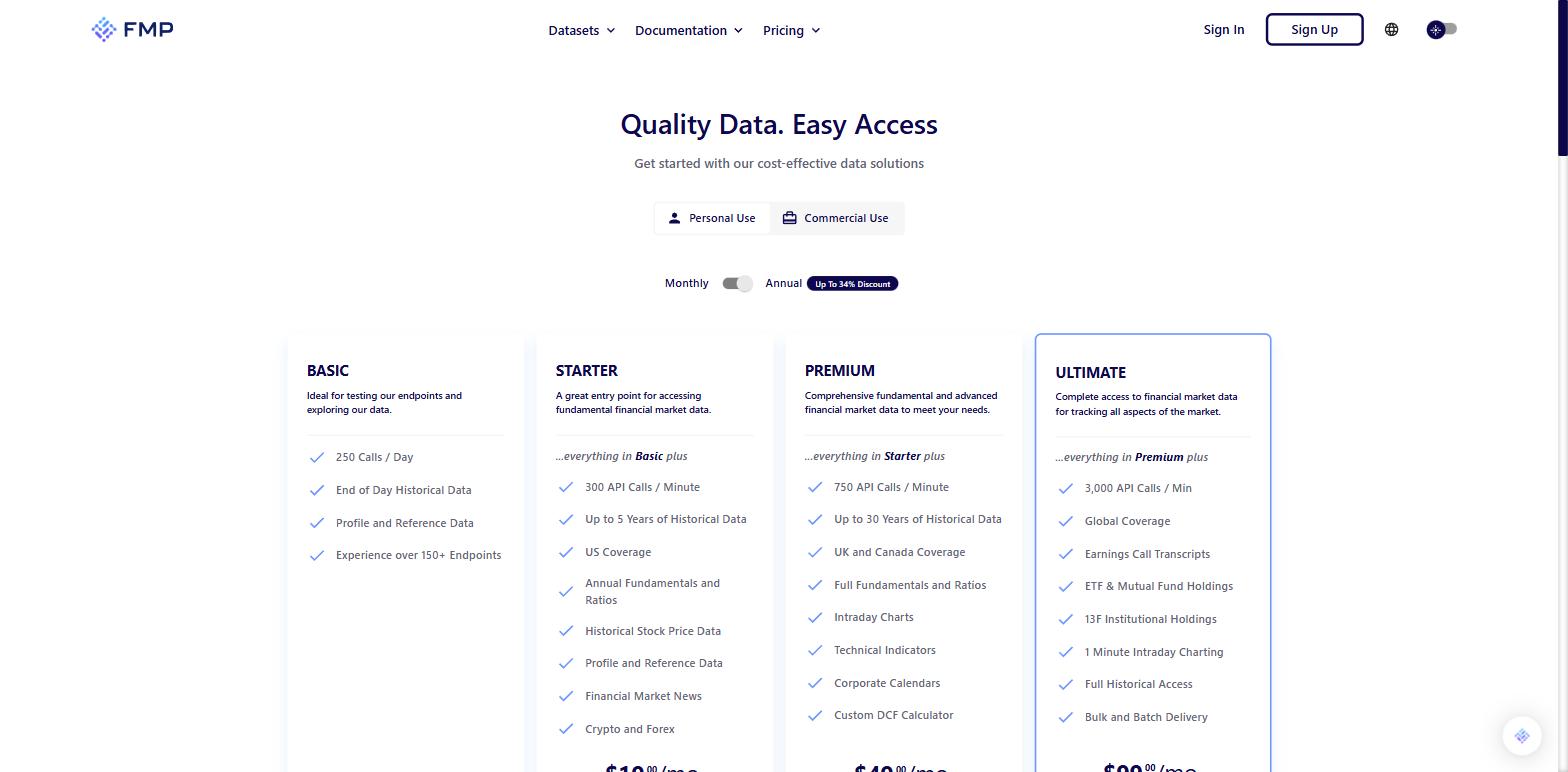
- Basic free, Starter $19, Premium $49, Ultimate $99 a month.
- Coverage well beyond US listings.
The instrument flags deserve more credit than they usually get. Keeping funds and ETFs out of an equity screen is a step people forget until a screen returns a leveraged ETF alongside the operating companies, and having it as a first-class parameter is a small kindness.
The ceiling is the same as the rest of this group. There is no OR, no grouping, and no route to any condition that is not already a parameter. The screener starts on Starter at $19 a month billed annually, limited to US exchanges; Premium adds the UK and Canada, and Ultimate is global.
Intrinio
A fundamentals and market data platform whose screening endpoint is built on the second model, and on the evidence of its own documentation it is the most capable general screener in this comparison. It is also the product closest to what Business Quant sells, which is worth stating plainly rather than leaving a reader to notice.
- POST /securities/screen, taking a logic structure.
- Operators, clauses and nested groups.
- Ordering in the request, through order_column and order_direction.
- A primary_only flag for collapsing multiple listings.
- page_size reaches 50,000.
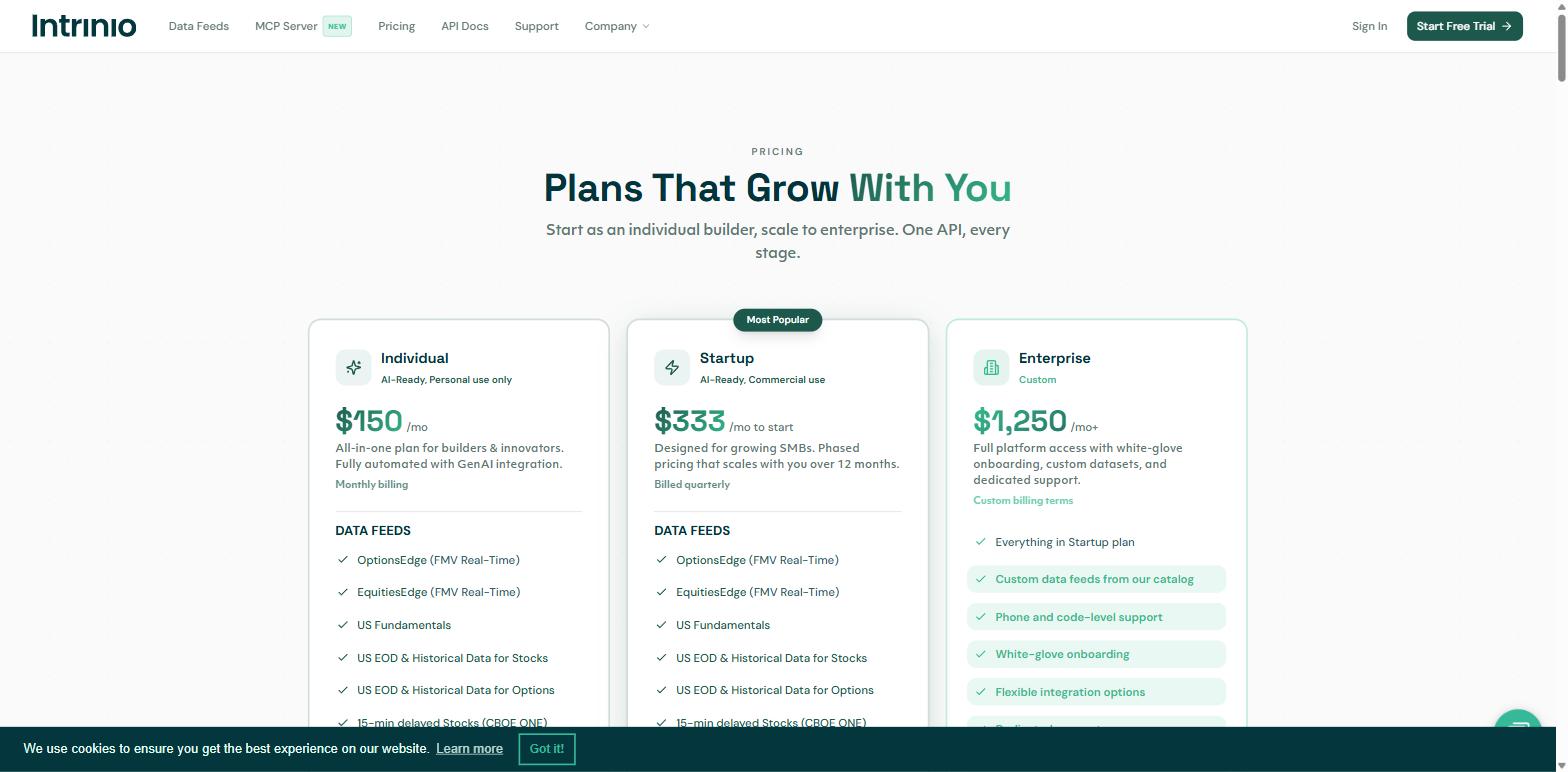
- Individual $150, Startup $333, Enterprise $1,250 a month.
Nested groups plus a 50,000-row page is a combination nothing else here matches, and if raw screening capability with global coverage is the deciding factor, this is the strongest option on the page. The primary_only flag quietly removes a class of duplicate that spoils a lot of screens, since a company with several listed share classes will otherwise appear more than once and distort any count you take.
The one friction is discovery. The endpoint reference defers both the condition syntax and the list of screenable fields to a separate guide, so you cannot tell from the endpoint documentation alone what you are able to filter on. Everything else about the product is unusually transparent, including a published Individual price at a depth of data where most vendors route you to a sales call first.
Business Quant
Built for research on US-listed equities, with the screener as the entry point to the rest of the data rather than a standalone tool. A filtered universe carries straight through to the normalised statements behind it, because both share the same identifiers.
- 1,000+ fundamental metrics.
- AND, OR and parentheses in a single condition.
- The metric catalogue is published and readable before you filter.
- You choose which metrics come back.
- The full match count arrives with the results.
- Values refresh every minute.
- Free to use, no card.
The published metric catalogue is the part that matters most in practice, and it is the thing the rest of this field is weakest on. It means you find out what you can screen on by looking it up rather than by reading prose and guessing, and it is what makes a query builder or an input validation layer possible in a product you ship on top.
The scope worth stating up front: coverage is US-listed equities only, which is narrower than every other product on this page. The screener is also fundamentals-only by design, and the documentation says so in terms rather than letting you discover it, so a moving-average crossover is not a screen you can write here. Within that scope the universe is deep, at roughly 35,700 US-listed securities including OTC names, ETFs and mutual fund share classes, and it holds up across the platform the same way the price history does in the end-of-day data comparison. Commercial use sits on the enterprise plan rather than the free access.
The dividing questions
4 questions separate these 6 once the marketing is set aside, and each changes what you can build rather than how the response looks.
| Platform | OR and grouping |
Every match reachable |
Statement line items |
Ordering in the request |
Price from |
|---|---|---|---|---|---|
| Intrinio | ✓ | ✓ | ✓ | ✓ | $150/mo |
| Business Quant | ✓ | ✓ | ✓ | ✗ | $0 |
| Bigdata.com | ✗ | ✗ | ✗ | ✗ | Not published |
| Danelfin | ✗ | ✗ | ✗ | ✗ | $0 |
| EODHD | ✗ | ✗ | ✗ | ✗ | $29.99/mo |
| Financial Modeling Prep | ✗ | ✗ | ✗ | ✗ | $19/mo |
Ordered by tick count, then by the number of filterable fields the vendor documents. A tick means the capability is documented in that platform's own published material. A cross means it is absent from that material or outside the product's stated scope, not that it is impossible to work around. "Every match reachable" asks whether paging can reach the end of a result set rather than a capped slice. Prices are the published figure for the cheapest tier carrying the screener.
All 4 columns probe the same axis, which is depth, so a row of crosses describes a product built for a simpler job rather than a worse product. A first-pass narrowing screen over a global universe is a real requirement and the 4 parameter-list products serve it at a fraction of the price of the 2 above them. Read the table as a description of range, not a scoreboard.
What screening with Business Quant gives you
The point of a composed query is that the screen you wrote on paper is the screen you send. Here is what that buys, against what a fixed menu of parameters can offer instead.
| What you want | What you get |
|---|---|
| A grouped either-or condition | AND, OR and parentheses in a single screen |
| To know what you can filter on | The full metric catalogue, published |
| Filters on statement line items | 1,000+ metrics across all 3 statements |
| A narrow result for a dashboard | Only the metrics you asked for |
| Every match, not the first page | The match count arrives with the results |
| A universe to carry into the rest of the data | Ticker and CIK on every row |
| Screens that react to an earnings release | Values refreshed every minute |
| ETFs and OTC names in scope | Roughly 35,700 US-listed securities |
| To try the whole thing before paying | Free to use, no card |
APIs that do not screen as of August 2026
Several of the best-known APIs in this market turn up in searches for a screener and do not have one. This is not a criticism of any of them, and it is worth knowing before an afternoon disappears.
- Alpha Vantage. A top gainers and losers function, no filters.
- Finnhub. No screener endpoint in the documented set.
- Twelve Data. A market movers list, from the $29 tier.
- Alpaca. Movers and most actives, under a screener URL.
- Massive. Top 20 gainers or losers from full market snapshots.
- Barchart OnDemand. Roughly 80 endpoints, precomputed leader lists, and an options screener.
- ChartMill. A capable web screener with no documented REST API.
- FactSet. A screening API that only runs screens built elsewhere.
What most of these publish is a movers endpoint, which answers a question the vendor chose in advance, almost always the largest percentage moves since the previous close. That is a genuinely useful thing for a market-open dashboard and it is not screening, because the criteria are not yours. Barchart is the most striking case: a catalogue of roughly 80 endpoints including full statements and a working options screener, with no equity screener anywhere in it, which suggests a deliberate view that its customers screen inside their own systems.
FactSet is a separate case and the most interesting one. Its Universal Screening API is real, with endpoints to calculate, archive and export a screen and proper pagination on the results. What it will not accept is a screen. The documentation states that screen documents can only be created or modified in the Universal Screening application, so the API takes the name of a screen you built in the workstation and runs it on demand. If you already work in that environment that is a genuine automation tool. If you wanted to express a screen in code, it is not one.
All of them remain good sources of the underlying data. If you use one, you are in the position described earlier, assembling a universe and filtering it yourself.
The screener I would reach for
If you need a global universe, the answer is not us, and the products above that do it well are priced accordingly.
For US equity research, which is most of what this data gets used for, I would build on the Business Quant screener.
The argument is the one the opening makes. A real screen has an "or" in it and a "not" in it, and a parameter list has nowhere to put either, so the work leaks out of the API and into orchestration code you then maintain. A condition carrying AND, OR and parentheses across 1,000+ fundamental metrics means the screen you designed is the screen you send, and the match count arriving with the results means you get every company that matched rather than the first slice of them.
3 specifics sit behind that, each checkable against what this page has already stated. The metric catalogue is published in full, so you discover what you can filter on by looking rather than by guessing. Values refresh every minute, so a threshold crossed on an earnings release is caught on the next run instead of tomorrow. And the same identifiers carry from the screen into statements, filings and ownership, so a universe becomes an analysis without a join you had to invent.
The limits, in the same breath: US-listed equities only, fundamentals only with no price or chart-pattern filters, no ordering parameter in the request, and commercial use on the enterprise plan rather than the free access.
Here is the 10-minute test I would run before paying anyone, including us. Take the last screen you ran by hand, write it out in full including the clause you dropped because your tool could not express it, then try to send it as one request and page to the end of the results. Whichever endpoint accepts the whole thing and gives you every match is your answer. The metric catalogue and the screener are both free to use here, so you can run that test this afternoon without talking to anybody.
How this comparison was made
One test set the roster: a documented, publicly available endpoint that accepts filter conditions over a universe of equities and returns the matching set. Products that return a list the vendor chose in advance did not qualify however well known they are, and they are named in their own section rather than quietly omitted. 6 products met the test and 6 are reviewed. The number is what the test produced rather than a target set in advance.
Figures were read at each vendor's own documentation and pricing pages on 15 August 2026 rather than taken from other roundups, and the Business Quant figures come from its own API documentation read the same day. Where a vendor publishes no price the table says so instead of carrying an estimate. The Financial Modeling Prep plan boundaries were re-read at its own pricing page on 3 October 2026.
2 orderings are used, each by a stated rule. The reviews and the bullet list run by filter model, simplest first and alphabetically within each model, with Business Quant placed last. The capability table runs by tick count, ties broken by the number of filterable fields each vendor documents, which puts Intrinio first and Business Quant second. Business Quant makes one of these 6 products and is measured on the same 4 questions as the other 5, including the one it does not win.
Image credits. Header photograph by Anne Nygård on Unsplash, used under the Unsplash License. Vendor screenshots were captured on 13 and 15 August 2026 from each provider's own pricing or documentation pages and are reproduced for comparison. Diagrams are Business Quant originals.
Frequently asked questions
Is there a stock screener API that is free to use?
The Business Quant screener is free to use with no card, and the metric catalogue behind it can be read before you write a filter. Elsewhere the pattern is worth knowing: screening is usually the thing that sits above the free line. EODHD puts its screener on a $29.99 package, and Intrinio starts at $150 a month. Financial Modeling Prep runs a free Basic plan, but its screener starts on Starter at $19 a month billed annually, limited to US exchanges. Several APIs that cost nothing do publish a daily gainers and losers list, but that is not screening and the closing section explains why.
Which stock data APIs do not have a screener?
More than you would expect, and some of the biggest names in the category. Alpha Vantage, Finnhub, Twelve Data, Alpaca, Massive and Barchart OnDemand were all checked against their own documentation and none exposes an endpoint that accepts filter conditions. Several publish a market movers or top gainers list instead, which answers a question the vendor picked rather than one you wrote. Alpaca even ships its version under a URL containing the word screener. If you need to screen, treat all of them as sources of raw data you will filter yourself.
Can a stock screener API combine filters with OR?
In 4 of these 6, no. Most screener APIs are a fixed list of named parameters combined implicitly with AND, and EODHD states the constraint in its own documentation in exactly those words. That handles "large cap technology under 15 times earnings" and it cannot handle "technology or healthcare, either growing fast or paying a high yield" without splitting the screen into several requests and merging the results in your own code. Intrinio and Business Quant are the exceptions, both accepting nested groups so the whole screen travels in one request.
How many results can a stock screener API return?
Check this before you build on one, because it is rarely on the marketing page. EODHD caps its limit parameter at 500 rows and its offset at 999, so a screen matching 4,000 companies will only ever surrender the first 1,000. Bigdata.com caps limit at 1,000 and documents no offset or cursor at all. Intrinio documents a page_size maximum of 50,000. The Business Quant screener reports how many companies matched and pages through all of them, so a pipeline can reach the end of a result set rather than a capped slice.
Can I screen on technical indicators like RSI or moving averages?
Not with the Business Quant screener, which is fundamentals-only by design and says so in its documentation rather than leaving you to discover it: every filterable metric derives from financial statements, valuation models or derived ratios. EODHD is the better fit here among the products reviewed, carrying adjusted close, average volume over 1 and 200 days, and 6 precomputed signals including new 200-day highs and lows. Bigdata.com and Financial Modeling Prep both expose price, beta and volume ranges as filter parameters.