9 Best YCharts Alternatives for 2027
YCharts quotes its price by phone. 9 alternatives that chart fundamentals at a published price, compared on statement data, segments, KPIs, export and API access.

YCharts is a research platform known for charting a company's fundamentals over time, such as revenue, margins and cash flow, often for several companies on one chart. It does not publish a price: its plans page lists 4 tiers and asks you to call its sales team.
Below are 9 YCharts alternatives that chart fundamentals over several years at a price published on their own sites. We compare them on price, history, statement data, segments, KPIs, data export and API access.
What YCharts sells, and to whom
YCharts is sold mainly to financial advisers. Its plans page lists Enterprise, Professional, Presenter and Analyst, and the first 3 are described in adviser terms: broker-dealers, model portfolio distribution, proposal generation and client relationship management. Only Analyst mentions individual investors, with screeners and tables, charting and "most data".
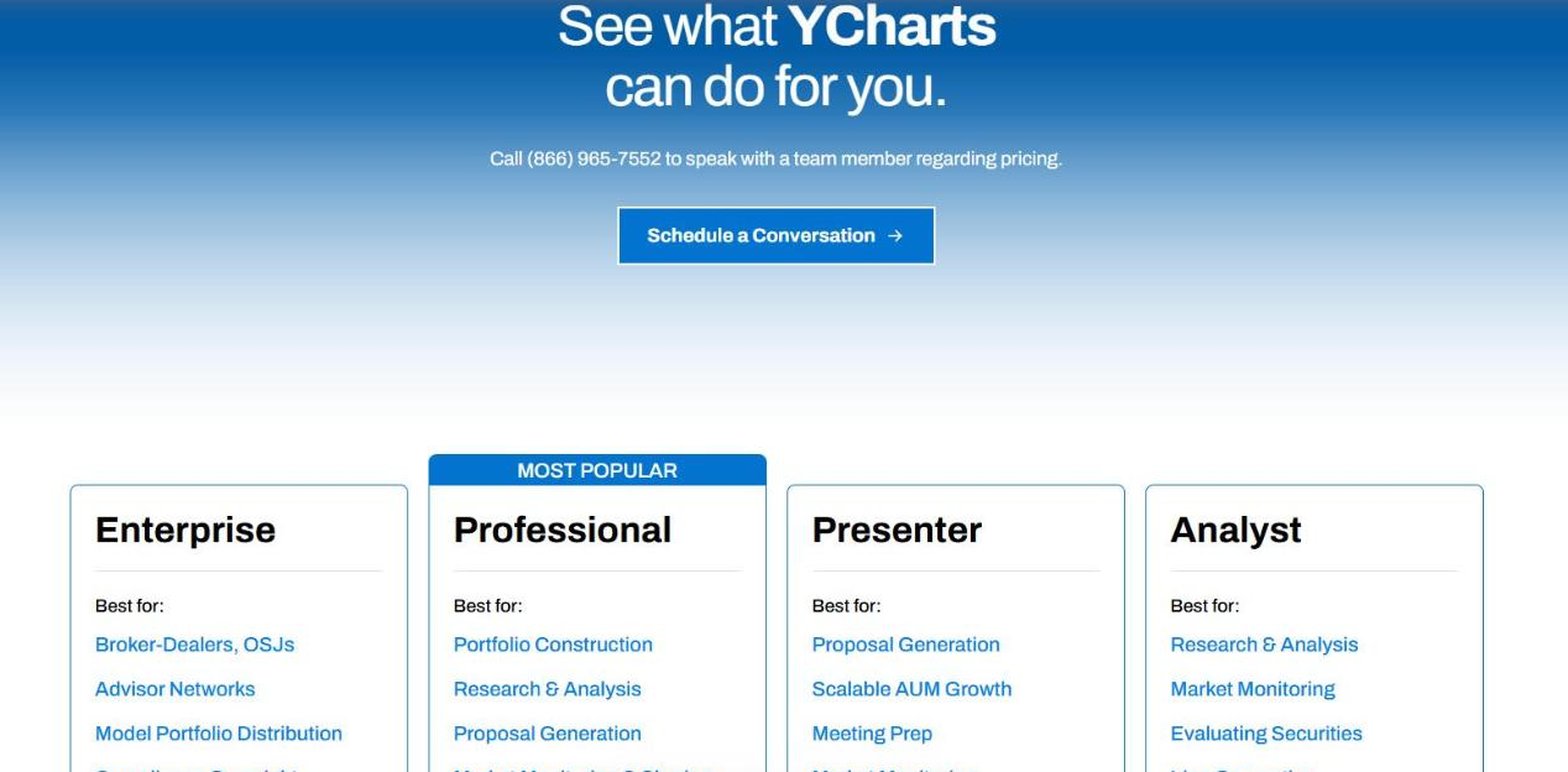
Add-ons such as the Excel add-in and mutual fund data are marked as extra cost. That suits an advisory firm buying seats. It does not suit one investor who wants to chart a company's numbers tonight and know the cost before signing up.
What that investor wants is the fundamental chart: revenue, earnings per share, operating margin or free cash flow over many years, often for 2 or 3 companies at once, and sometimes rebased so a small company and a large one share an axis. Every product below was tested on that job.
How to choose a YCharts alternative
- Fundamentals, not just price. Revenue, margins and cash flow, not only the share price.
- History. How many years it charts without paying, and on its cheapest paid plan.
- Comparison. Several companies on one chart, and a way to rebase them.
- The numbers behind the chart. A table by period that you can export.
If you mainly compare stocks on price performance, our stock comparison tools guide covers that side in more depth.
The 9 YCharts alternatives at a glance
- FAST Graphs
- Koyfin
- Seeking Alpha
- Stock Analysis
- Stock Rover
- Stock Unlock
- TIKR
- TradingView
- Business Quant
| Platform | Best for | Plans from |
|---|---|---|
| FAST Graphs | Earnings and cash flow drawn against price | $15.95/mo |
| Koyfin | Terminal-style dashboards and graphs | $39/mo |
| Seeking Alpha | Charts next to ratings and analysis | $299/yr |
| Stock Analysis | Long history at a low price | $6.58/mo |
| Stock Rover | Comparison charts across a portfolio | $24/mo |
| Stock Unlock | Free-form graphing of statements and KPIs | $7.50/mo |
| TIKR | Global fundamentals priced by years of history | $17.95/mo |
| TradingView | Fundamentals beside a trading chart | $12.95/mo |
| Business Quant | Charting fundamentals, segments and KPIs across companies, with export and API access | $29/mo |
Rows are alphabetical, Business Quant last. "Plans from" is the cheapest paid plan's lowest advertised monthly price on 16 October 2026; Seeking Alpha advertises only a yearly renewal.
YCharts alternatives reviewed
FAST Graphs
FAST Graphs is a charting tool built on one idea: draw a company's earnings or cash flow first, then lay the share price over it, so you can see whether the market is paying a sensible multiple.
- Best for earnings and cash flow drawn against the share price.
- 7-day free trial, no card needed.
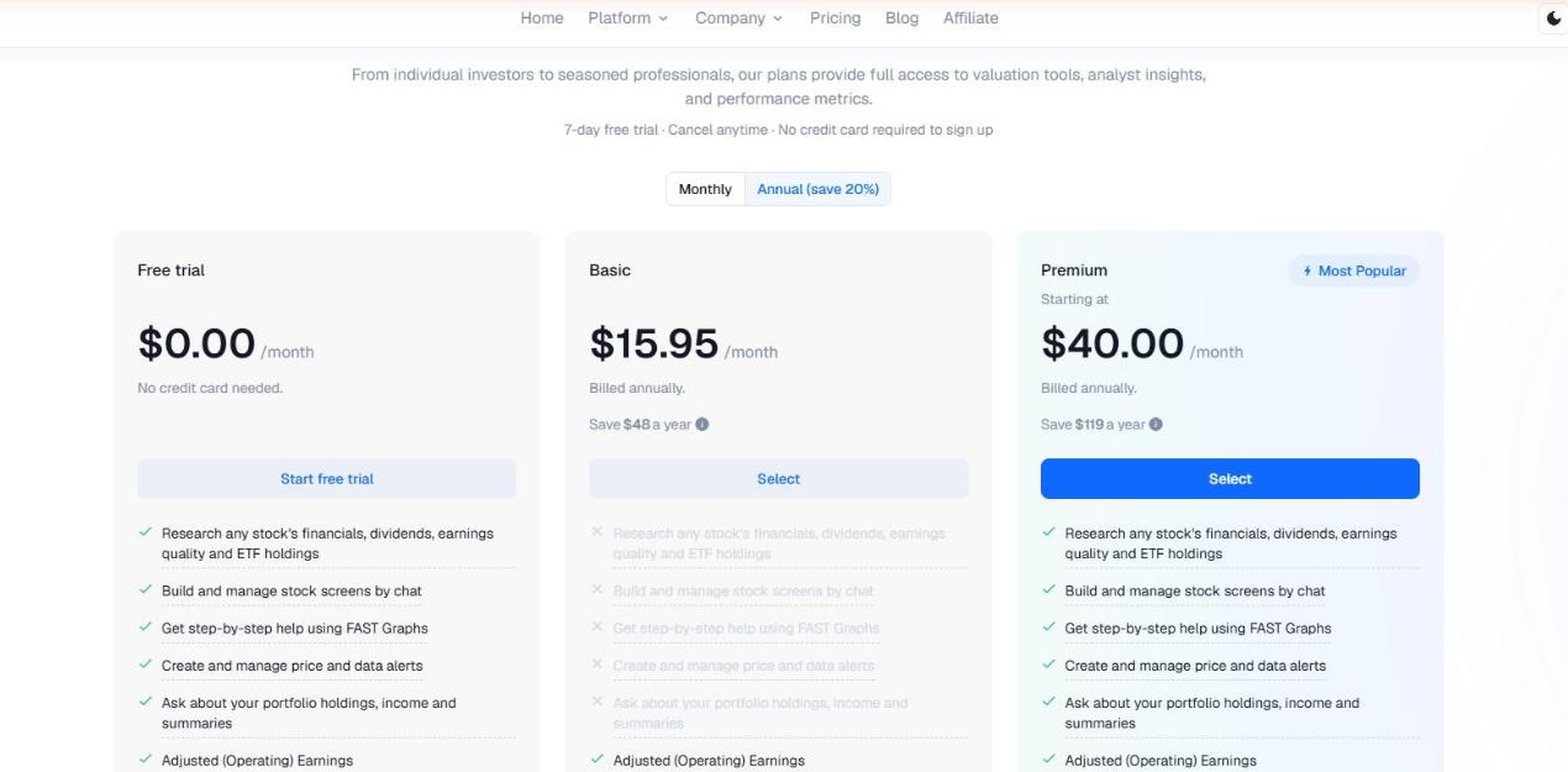
- Basic from $15.95 a month, with earnings, operating cash flow and FFO charts.
- Premium from $40 a month, adding sales, EBIT and EBITDA.
- Analyst expectations drawn on the chart.
FAST Graphs suits a value investor who asks one question of every chart: is the price above or below what the earnings justify? Basic covers adjusted, basic and diluted earnings, operating cash flow, free cash flow to equity, and funds from operations for REITs.
Where it falls short: there is no $0 plan beyond the trial, charting sales needs Premium, and the pricing page does not say how many years the graphs cover. It documents no data export, segment or KPI data, ownership, filings or API.
Koyfin
Koyfin is a terminal-style platform for individuals and advisers, and its own comparison page ranks first for this search. Its advisor plans sell the model portfolios and client proposals YCharts is known for, at published prices.
- Best for terminal-style dashboards and graphs.
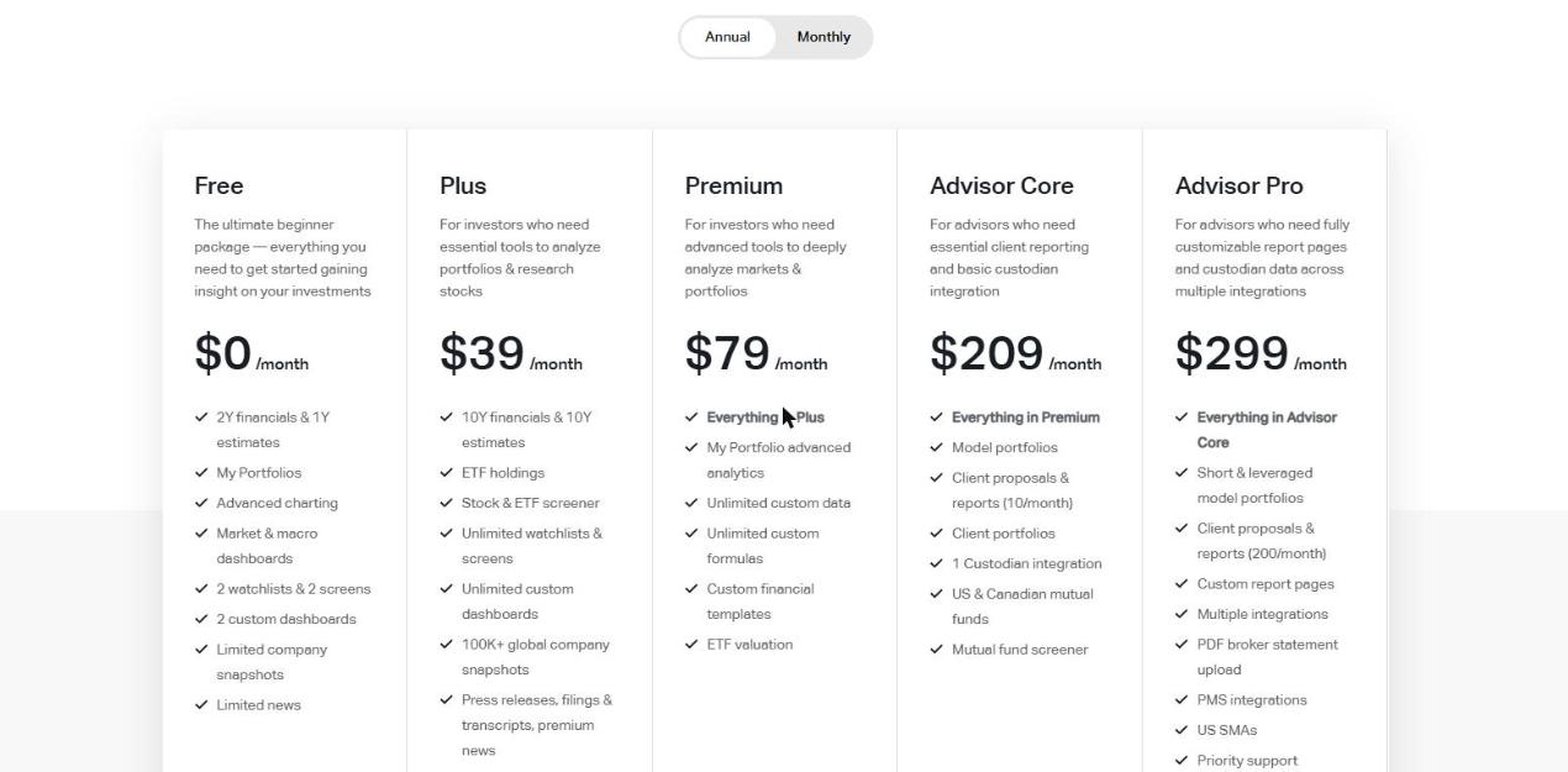
- Free plan with 5 graphs and 2 years of financials.
- Plus from $39 a month, with 10 years and 40 quarters, and 50 graphs.
- 300+ fundamental series to add to a graph.
- Advisor Core $209 and Advisor Pro $299, with model portfolios and client proposals.
Koyfin's graphs work the way a YCharts user expects: add a security, add a metric, and the metric carries across when you add a second company. Its plans also cover filings, transcripts and a World Economics dashboard, and its advisor plans are the closest published-price match for YCharts' adviser features.
Where it falls short: 2 years of financials on the free plan is a short window for a fundamental chart. Koyfin's help page says its data vendor, Capital IQ, does not allow equity financials, valuation, estimates or growth rates to be exported, and there is no segment or KPI data and no API.
Seeking Alpha
Seeking Alpha is an investing community known for its contributor articles and Quant Ratings. Every stock has a charting tab that plots statement lines as well as price.
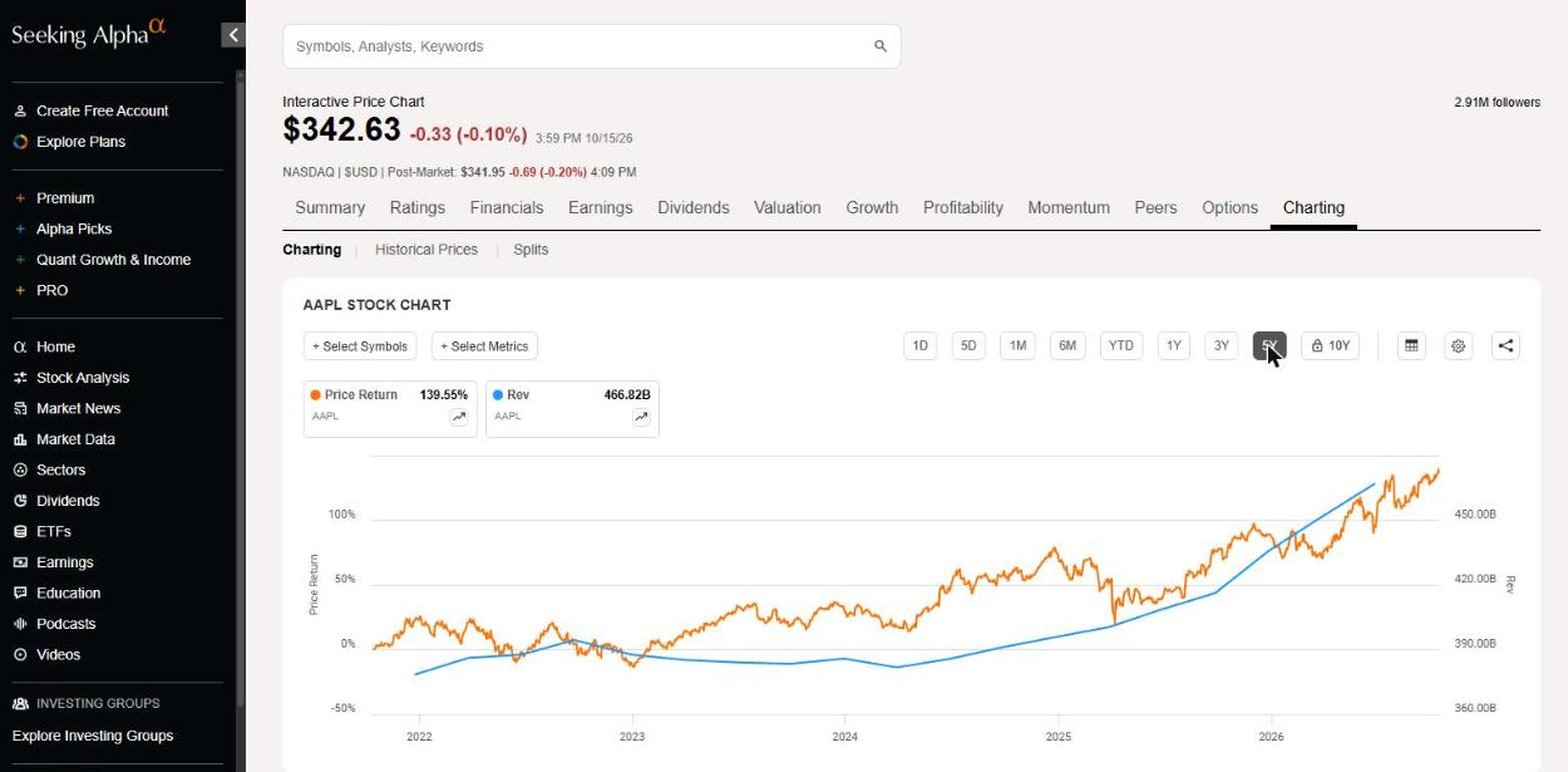
- Best for fundamental charts next to ratings and analysis.
- Charts to 5 years without an account.
- Premium renews at $299 a year, after $4.95 for the first month.
- Up to 7 metrics per chart from the income statement, balance sheet and cash flow.
- Consensus estimates, ownership and SEC filings on each stock.
The metric picker is deep: revenue, gross profit, operating income, EBITDA and diluted EPS from the income statement alone, plus valuation, growth, profitability and dividend series. If you would pay for the ratings and articles anyway, the charts come with them.
Where it falls short: the 10-year interval opens the Premium offer, and several metrics can be charted together only for a single company, so comparing companies means one metric at a time. Export covers only the stock comparison, and there is no segment or KPI data or API.
Stock Analysis
Stock Analysis is a stock data site with a free account and a low-cost Pro plan. Its comparison chart plots fundamentals as easily as returns.
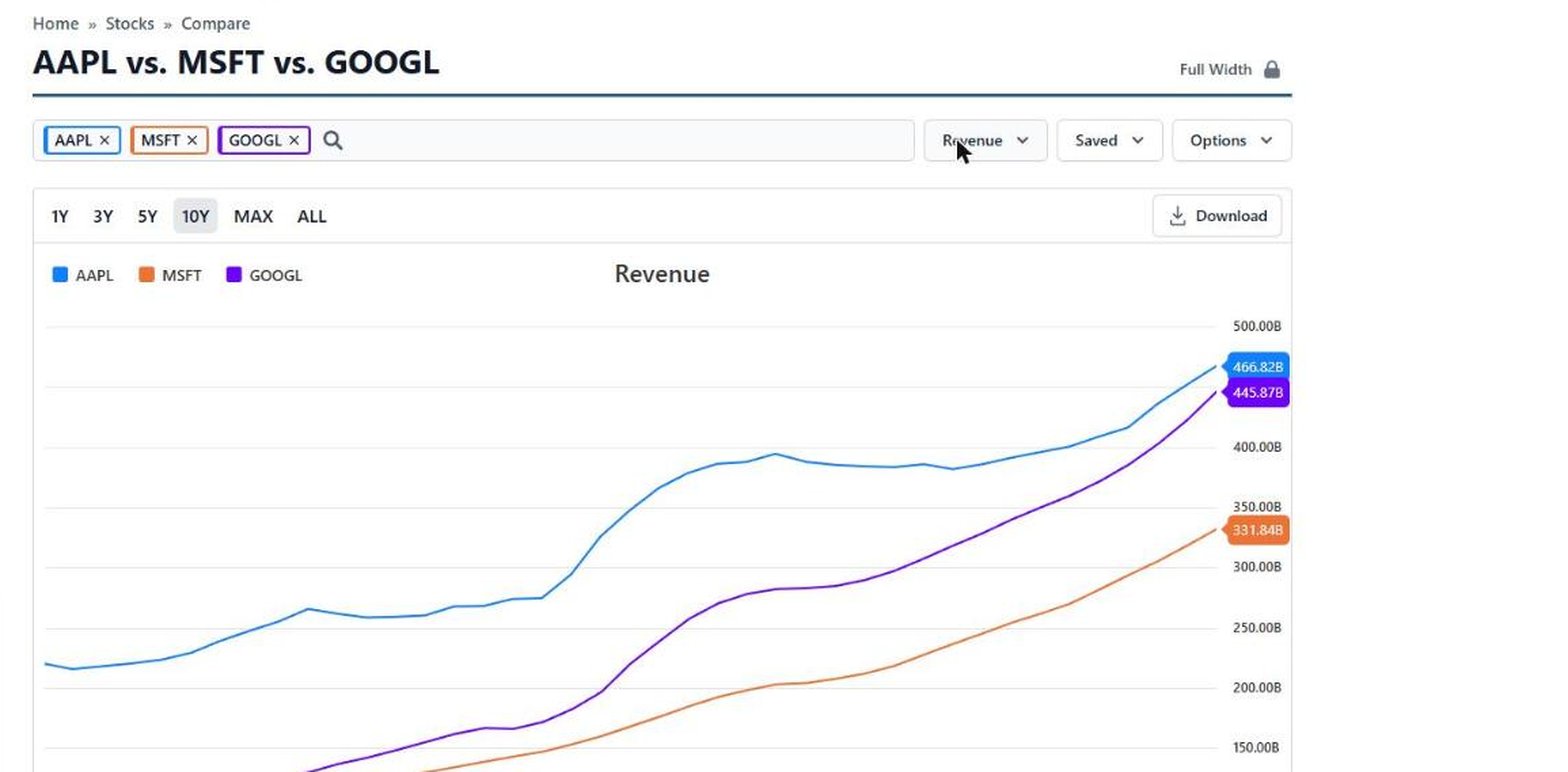
- Best for long history at a low price.
- Comparison chart of revenue, EPS, margins, free cash flow and valuation ratios.
- Pro from $6.58 a month, or $9.99 billed monthly.
- 10 to 40 years of financial history on Pro.
- One download a day to Excel, CSV or Google Sheets on Pro.
Pick 2 or 3 tickers, switch the metric from total return to revenue or operating margin, and choose a range. On a free account the 10-year revenue chart for Apple, Microsoft and Alphabet drew in full. Its statements use bank line items for banks, its metrics tab carries segment revenue, and Pro lists business metrics for 50,000+ stocks at the lowest entry price in this list.
Where it falls short: Pro allows one download a day, and there is no ownership data, filing list, API or MCP server.
Stock Rover
Stock Rover is a research and portfolio platform whose charts compare stocks, funds, portfolios, watchlists and even screens, with fundamentals layered on the main ticker.
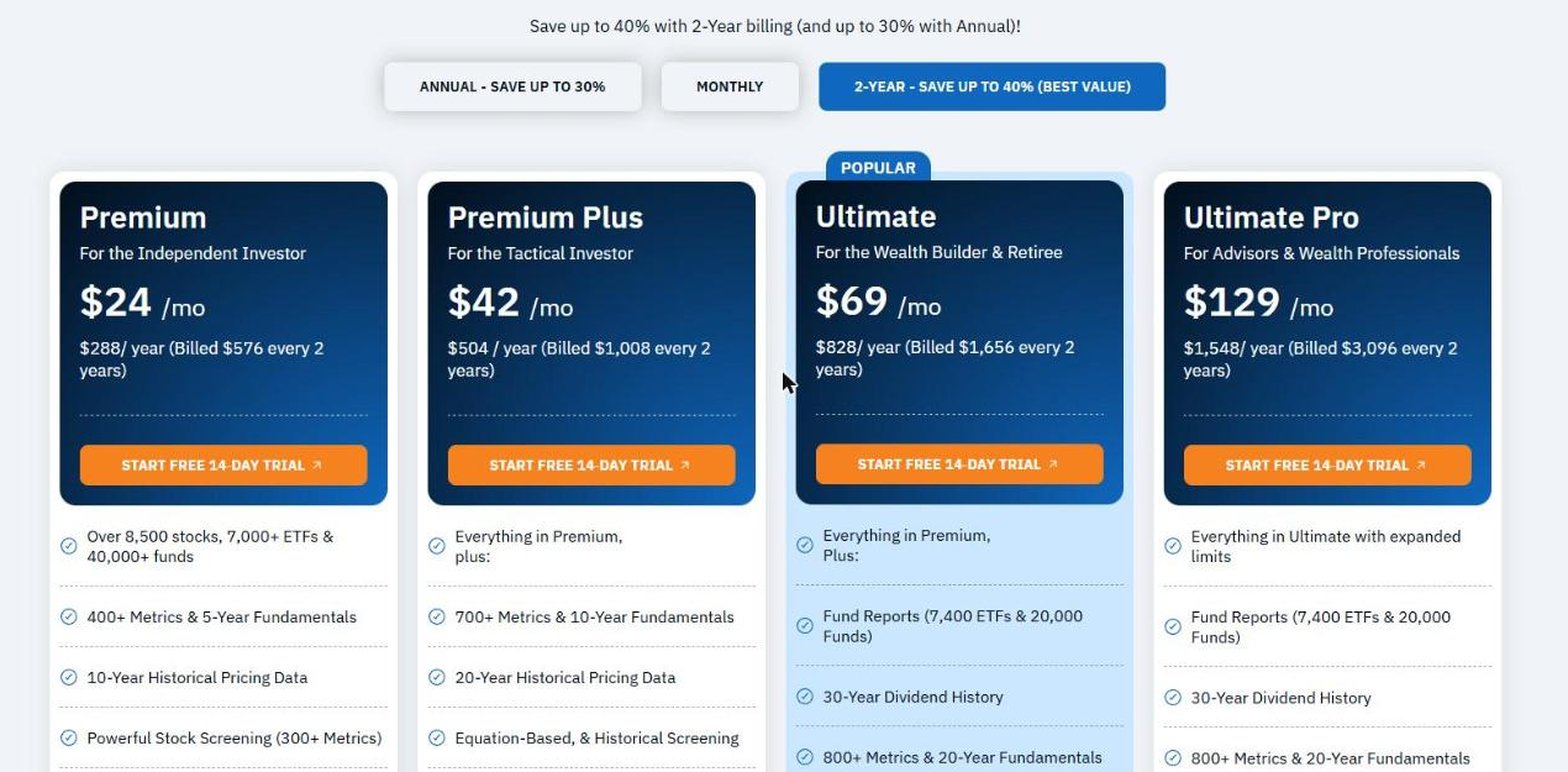
- Best for comparison charts across a portfolio.
- Premium from $24 a month on 2-year billing, with 5-year fundamentals.
- Premium Plus $42, with 10-year fundamentals and valuation and ratio charts.
- Ultimate $69, with 20-year fundamentals.
- Up to 12 comparison tickers on one chart.
- 14-day free trial on every plan.
Stock Rover's charts are strongest at relative performance: baseline one line, and every other line shows how it did against that one. Data export comes with the first paid plan, and its feature list adds analyst estimates and insider transactions.
Where it falls short: fundamentals attach only to the primary ticker, so a comparison chart compares prices and returns rather than revenue or margins. Premium carries 5 years of fundamentals, and there is no segment, KPI or filing data and no API.
Stock Unlock
Stock Unlock is a research site backed by Y Combinator, built around free-form graphing: pick financial data points and plot them for one stock or several.
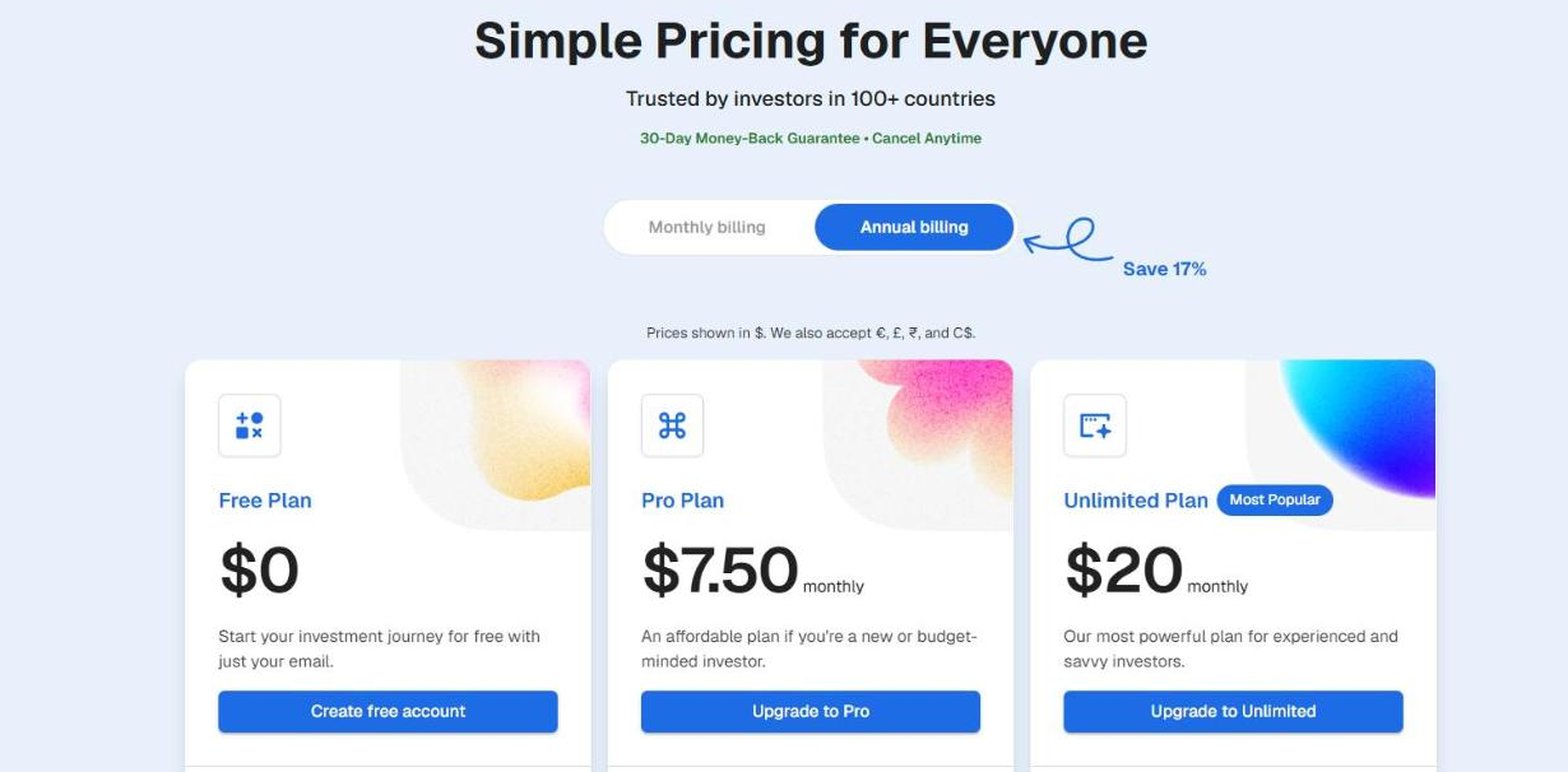
- Best for free-form graphing of statements and KPIs.
- Free plan with limited financial data and graphing.
- Pro from $7.50 a month, with 10 years of data and unlimited graphing.
- Unlimited $20, with 35 years of data and all key business metrics.
- Analyst estimates and insider data on each stock.
- 30-day money-back guarantee.
Stock Unlock's graphs reach deep into a company. JPMorgan's income statement shows interest income and loan-loss provisions, Tesla's KPI tab charts production and deliveries by model next to segment and geographic revenue, and a "View as %" toggle lets a small company and a large one share an axis.
Where it falls short: key business metrics stay limited on Pro and open fully only on Unlimited. It documents no spreadsheet export, filing list or API.
TIKR
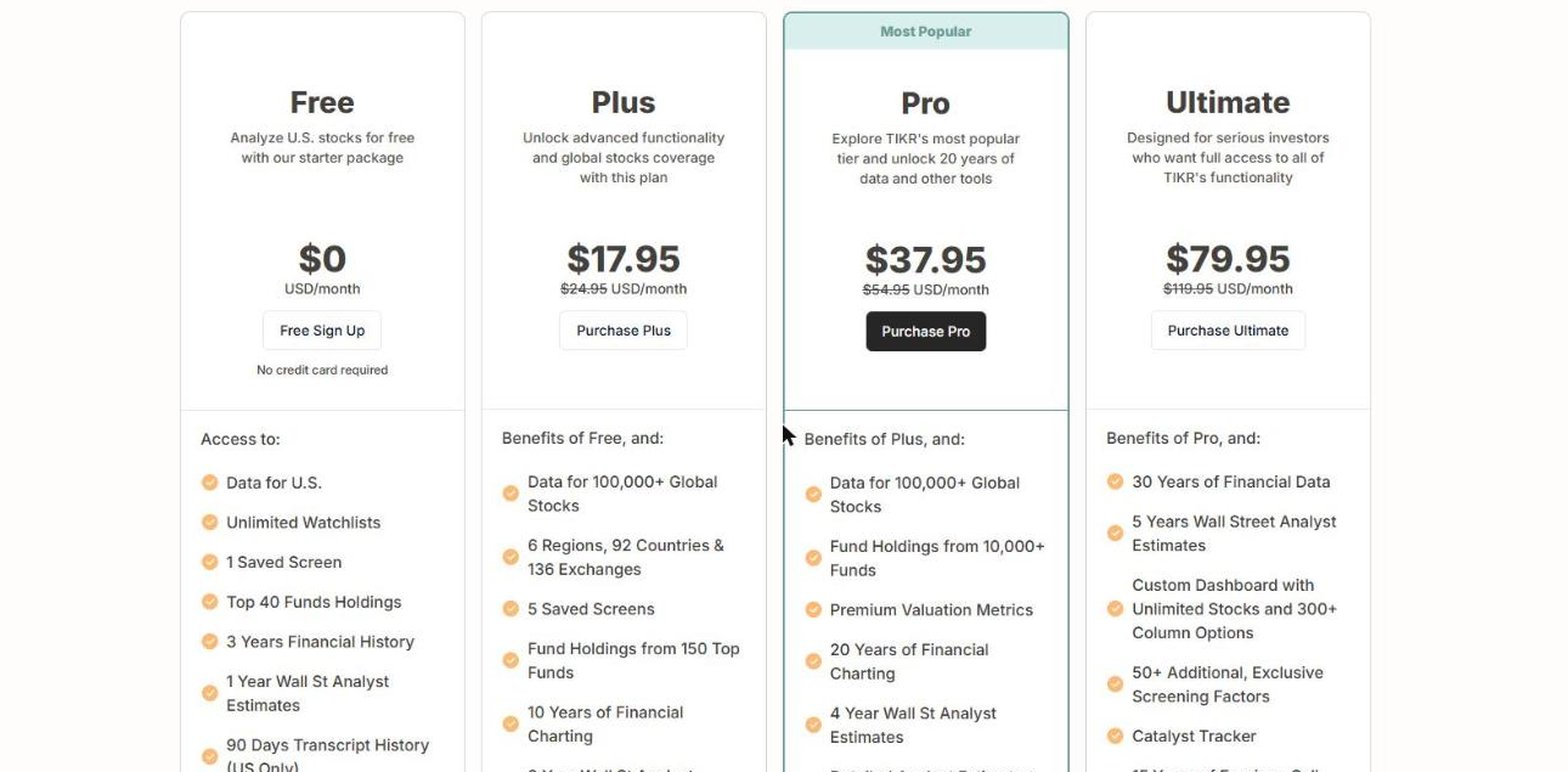
TIKR is a global fundamentals platform that sells its charting by years of history, from 10 years on its first paid plan to 30 years of data at the top.
- Best for global fundamentals priced by years of history.
- Free plan with US data and 3 years of financial history.
- Plus from $17.95 a month, with 10 years of financial charting.
- Pro $37.95, with 20 years of financial charting.
- 100,000+ global stocks in 92 countries, from Plus.
- 14-day money-back guarantee.
TIKR was the top answer in a Reddit thread on YCharts alternatives that ranks for this search, and the pricing page shows why: 10 years of charting for under $18 a month, with global coverage included. Its stock pages add segment revenue, analyst estimates, ownership and filings.
Where it falls short: the free plan covers US stocks and 3 years. Export starts on Pro, according to TIKR's help centre, which also says there is no API, and there is no KPI or economic data.
TradingView
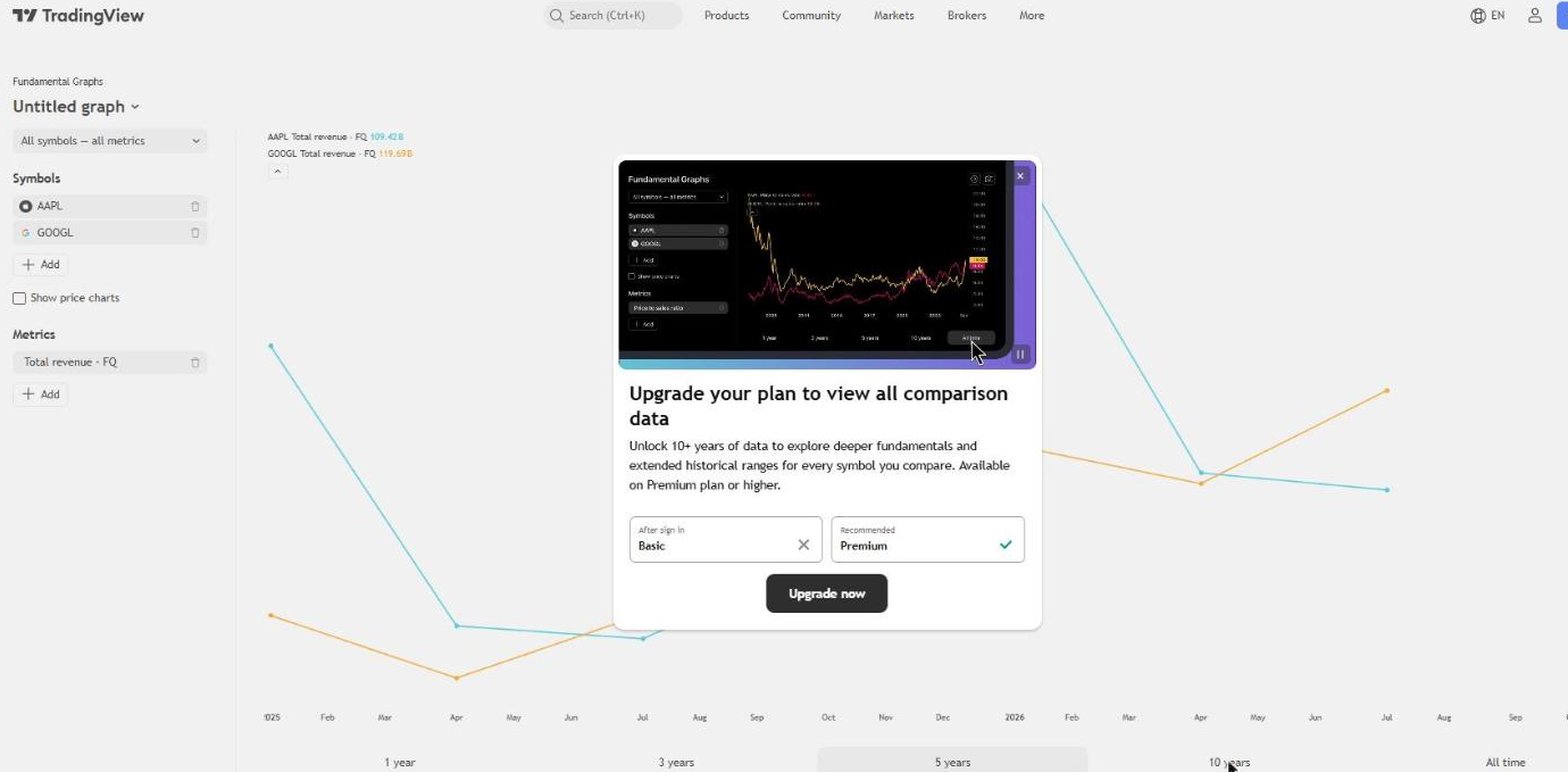
TradingView is a charting platform best known for price charts, with a separate tool for fundamentals: Fundamental Graphs, which takes up to 9 symbols and 9 metrics on one chart.
- Best for fundamentals beside a trading chart.
- Fundamental Graphs with up to 9 symbols and 9 metrics.
- Essential from $12.95 a month.
- Premium from $59.95 a month, for 10+ years of fundamentals.
- Economic data, filings and an MCP server alongside the charts.
TradingView covers more columns in the table below than any other product here except ours: bank line items for banks, segment revenue, analyst forecasts, filing lists, economic data and an MCP server. Fundamental Graphs charted Apple's and Alphabet's quarterly revenue signed out, and each graph saves to its own link.
Where it falls short: signed out, the graph drew only the latest 7 quarters, and the 10-year and all-time ranges need Premium, 2 plans above Essential. There is no company KPI data, ownership data or data API.
Business Quant
Business Quant is ours. Our advanced charting plots prices and 100+ fundamental metrics for several companies on one chart, and every chart has a table of the same numbers behind it.
- Best for charting fundamentals, segments and KPIs across companies, with export and API access.
- Free to use, 5 years and 20 quarters, no card.
- Pro from $29 a month, full history, export and API access.
List of features
- Advanced charting: original, normalized or % from high or low, 3 panel layouts
- Time series tables of 1,000+ metrics
- Financial statements: annual, quarterly and TTM
- 4 standardised statement templates: general, real estate, utilities and capital markets
- Financial results from 10-K, 10-Q, 8-K, 20-F, 40-F and 6-K filings
- Ratios and growth metrics
- History page for every line item
- CSV and XLSX download
- Segment financials
- KPI and operating data
- Analyst estimates
- BQ-MICS industry classification: 11 sectors, 71 industry groups, 288 industries
- Industry financials
- Peers
- Stock screener
- Institutional ownership and insider trades
- 18 million+ SEC filings since 1993
- Economic data: 617 indicators
- ETF and mutual fund screener
- Fund comparison
- Portfolio tracker
- API access
- MCP server
- Results within 10 to 15 minutes of release
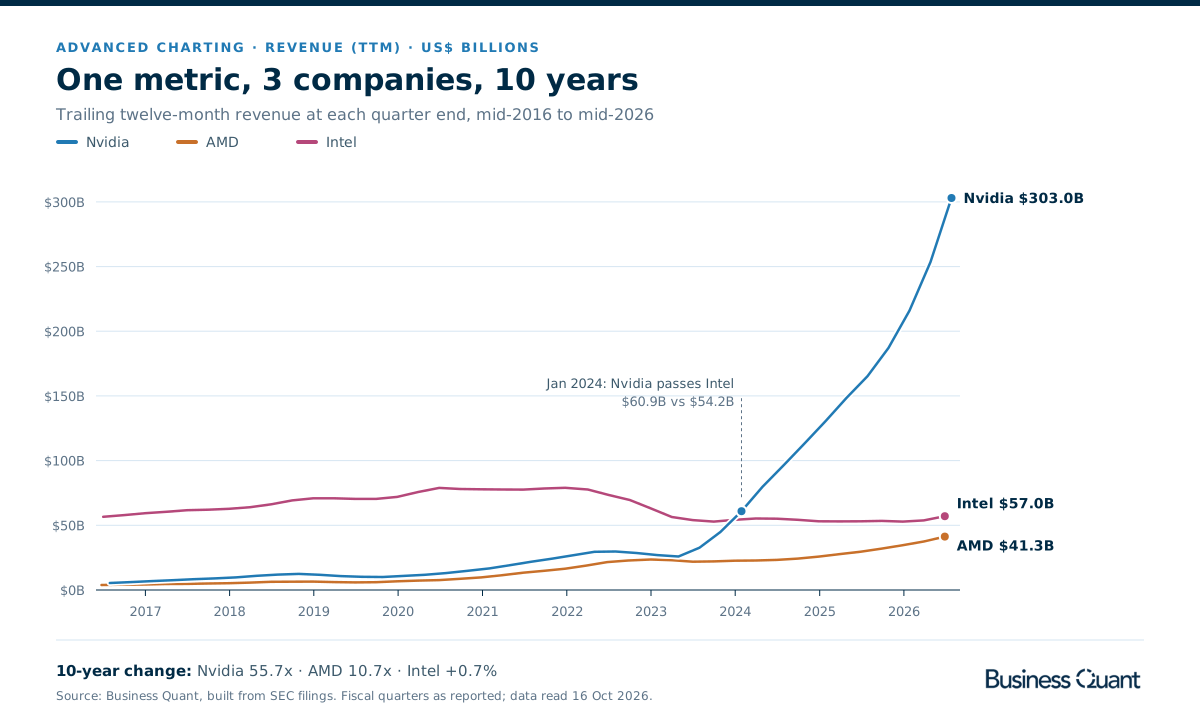
The figure above takes a few clicks: pick Nvidia, AMD and Intel, pick trailing twelve-month revenue and set the range to 10 years. Nvidia's line passes Intel's in the quarter to January 2024. Switch the format to Normalized and all 3 start from zero, which is how you compare a $5 billion company with a $56 billion one; switch to a panel per security and each gets its own scale. The same chart takes margins, EPS, free cash flow or P/E, and downloads when you are done.
Behind each chart, time series tables lay the same metrics out quarter by quarter, for the companies you pick or a whole industry, and our economic data charts the macro series YCharts is also known for. We take results from 10-K, 10-Q, 20-F and 40-F filings, and also from the 8-K and 6-K filings that carry earnings releases, so a new quarter appears within 10 to 15 minutes. Pro adds the full statement history, company KPIs such as deliveries and subscribers, longer segment history, CSV and XLSX downloads and our API.
YCharts alternatives feature by feature
| Platform | Spreadsheet export |
Industry‑specific statements |
Segment financials |
Company KPIs |
Analyst estimates |
Insider & Inst. Ownership |
SEC filings |
Economic data |
API access |
MCP server |
Plans from |
|---|---|---|---|---|---|---|---|---|---|---|---|
| Business Quant | ✓ | ✓ | ✓ | ✓ | ✓ | ✓ | ✓ | ✓ | ✓ | ✓ | $29/mo |
| TradingView | ✓ | ✓ | ✓ | ✗ | ✓ | ✗ | ✓ | ✓ | ✗ | ✓ | $12.95/mo |
| Koyfin | ✗ | ✓ | ✗ | ✗ | ✓ | ✓ | ✓ | ✓ | ✗ | ✗ | $39/mo |
| Stock Analysis | ✓ | ✓ | ✓ | ✓ | ✓ | ✗ | ✗ | ✗ | ✗ | ✗ | $6.58/mo |
| Stock Unlock | ✗ | ✓ | ✓ | ✓ | ✓ | ✓ | ✗ | ✗ | ✗ | ✗ | $7.50/mo |
| TIKR | ✗ | ✗ | ✓ | ✗ | ✓ | ✓ | ✓ | ✗ | ✗ | ✗ | $17.95/mo |
| Seeking Alpha | ✗ | ✗ | ✗ | ✗ | ✓ | ✓ | ✓ | ✗ | ✗ | ✗ | $299/yr |
| Stock Rover | ✓ | ✗ | ✗ | ✗ | ✓ | ✓ | ✗ | ✗ | ✗ | ✗ | $24/mo |
| FAST Graphs | ✗ | ✗ | ✗ | ✗ | ✓ | ✗ | ✗ | ✗ | ✗ | ✗ | $15.95/mo |
Sorted by ticks, ties broken alphabetically. A tick means the platform's own pages or help centre document the feature on a self-serve plan; a cross means we found no such documentation. Every product here charts fundamentals, so charting has no column. "Spreadsheet export" refers to the cheapest paid plan. "Industry-specific statements" means a bank, for example, is shown with bank line items such as net interest income and loan-loss provisions rather than a generic template; we checked JPMorgan's income statement on each site. "Segment financials" means revenue by segment, product or geography over several years. "Company KPIs" means operating metrics such as subscribers or deliveries. "Analyst estimates" means consensus revenue or earnings forecasts. "Insider & Inst. Ownership" covers insider trades or holdings and institutional holders. "SEC filings" means a company's filing list. "Economic data" means macro series such as GDP, inflation and interest rates, not only an economic calendar. "API access" and "MCP server" mean a self-serve API and an AI-assistant connector.
Business Quant is the only product here that ticks every column. TradingView comes closest with 7, but has no company KPIs, ownership data or data API. Koyfin, Stock Analysis and Stock Unlock follow with 5 each: Koyfin for filings and economic data, Stock Analysis and Stock Unlock for segments and KPIs. FAST Graphs ticks one, because it sells a single kind of chart rather than a data set. A cross shows what a product was built for, not how good it is.
What about Morningstar and Fiscal.ai?
Both come up alongside YCharts, and both were checked against the same test. Morningstar Investor is priced from $20.75 a month, but its plan page describes screeners and custom views, not charts of a metric over time. Fiscal.ai's pricing page offers a 7-day trial on each product and no price. AlphaSense, FactSet and Bloomberg, which review sites list first, are institutional platforms sold to professional teams.
Which YCharts alternative is right for you?
- You value a stock by its earnings line: FAST Graphs.
- You want dashboards and adviser tools at a published price: Koyfin.
- You read ratings and articles and want charts with them: Seeking Alpha Premium.
- You want 10 years or more for a few dollars a month: Stock Analysis Pro.
- You chart relative performance across a portfolio: Stock Rover.
- You want to graph KPIs freely, with 35 years of data: Stock Unlock Unlimited.
- You follow companies outside the US: TIKR.
- You chart prices as much as fundamentals: TradingView.
- You want fundamentals, segments and KPIs charted across companies, with export and an API: Business Quant.
Where I would chart fundamentals first
If you need an adviser's proposal and model-portfolio tools, buy a product built for advisers. If you came for the fundamental chart, I would start on Business Quant's advanced charting.
It does the YCharts job at no cost: several companies on one chart, any of 100+ fundamental metrics, rebased when the companies differ in size, and downloadable when you are done. When a chart raises a question, the same numbers sit in time series tables by quarter, and new results arrive within 10 to 15 minutes of a company's release. Pro, from $29 a month, opens the full statement record, segment revenue, company KPIs, export and our API.
A 10-minute test: choose 3 companies in one industry and one metric you care about, such as operating margin. Chart it over the longest range each tool allows without paying, then on its cheapest paid plan, and note where each one stops. The point where the line is cut off tells you what the subscription is really selling.
How this comparison was made
To make the list, a product had to chart a US company's fundamentals, not only its share price, over several years, and be available to an individual at no cost or at a price published on the vendor's own site. Sales-led terminals and adviser-only proposal tools were not included. 9 products met that bar.
Every price, plan limit and feature was read on the vendor's own pricing, plan, charting, help or stock pages on 16 October 2026, and the screenshots were taken there. TradingView's US prices were taken from its own pricing page as listed in Google's US index. Prices are each platform's lowest advertised monthly price on that date; Seeking Alpha advertises only a yearly renewal. The Business Quant chart was built from our own data the same day.
The list, the summary table and the reviews run alphabetically, with Business Quant last, and the feature table is sorted by the number of ticks, with ties broken alphabetically. We make Business Quant, one of the 9 products compared here. For company-specific operating numbers, our KPI data sources guide compares where to get them, and our economic data websites guide covers the macro side.
Image credits. Header photograph by rc.xyz NFT gallery on Unsplash, used under the Unsplash License. Vendor screenshots were captured on 16 October 2026 from each provider's own pricing, plan or charting pages and are reproduced for comparison. The chipmaker revenue chart is our own, built from our data.
Frequently asked questions
Is there a free version of YCharts?
YCharts offers a free trial from its plans page, but none of its 4 plans (Analyst, Presenter, Professional and Enterprise) is free, and the page asks you to call for pricing. Among the alternatives, Business Quant is free to use with charting, time series tables and 5 fiscal years of statements on every US-listed company. Koyfin has a $0 plan with 2 years of financials, TradingView's Fundamental Graphs chart the latest quarters signed out, and Seeking Alpha charts statement lines over 5 years signed out.
How expensive is YCharts?
YCharts does not print a price. Its plans page lists 4 tiers and a phone number to speak with its team about pricing, with add-ons such as the Excel add-in and mutual fund data marked as extra cost. Every alternative in this list publishes its price: paid plans start at $6.58 a month on Stock Analysis, $7.50 on Stock Unlock, $12.95 on TradingView, $15.95 on FAST Graphs, $17.95 on TIKR, $24 on Stock Rover, $29 on Business Quant and $39 on Koyfin, all at their lowest advertised monthly price, and Seeking Alpha Premium renews at $299 a year.
What are some alternatives to YCharts?
For an individual investor who wants fundamental charts at a published price, the main alternatives are Business Quant, FAST Graphs, Koyfin, Seeking Alpha, Stock Analysis, Stock Rover, Stock Unlock, TIKR and TradingView. Review sites also list AlphaSense, FactSet and Bloomberg, which are institutional platforms built for professional teams.
What is the best free alternative to YCharts?
For charting fundamentals without paying, Business Quant is free to use: its advanced charting plots revenue, earnings, margins, P/E and 100+ other metrics for several companies on one chart, in original, normalized or percent-from-high form, with a download button. Koyfin's $0 plan allows 5 graphs on 2 years of financials, and Seeking Alpha charts statement lines over 5 years signed out.
Is Koyfin better than YCharts?
They are built for different buyers. Koyfin publishes its prices, from $0 to $299 a month, and its advisor plans add model portfolios and client proposals, the work YCharts is sold for. For an individual who mainly wants fundamental charts, the question is history: Koyfin's $0 plan carries 2 years of financials and Plus, at $39 a month, carries 10 years and 40 quarters.
Which YCharts alternative charts fundamentals rather than just price?
All 9 in this list do. TradingView's Fundamental Graphs, Seeking Alpha's charting tab and Stock Analysis's comparison chart all plot statement lines such as revenue. FAST Graphs is built around earnings and cash flow drawn against price. Business Quant, Koyfin, Stock Analysis, Stock Unlock and TradingView chart one fundamental metric for several companies at once, and TIKR sells its financial charting by years of history.