9 Best Websites for Financial Statements in 2027
Every site here will show you a company's income statement. Which one shows you enough years, enough quarters and the right lines to trust it?


Every US-listed company files its income statement, balance sheet and cash flow statement with the SEC, and many websites republish them. The sites differ in how many years and quarters they show without paying, how they lay out the lines, and what they charge for the rest.
Below are 9 websites where you can read a company's financial statements as figures on a page. We compare them on price, history, statement layout, segments, KPIs, estimates, ownership, data export and API access.
Why the same income statement differs from site to site
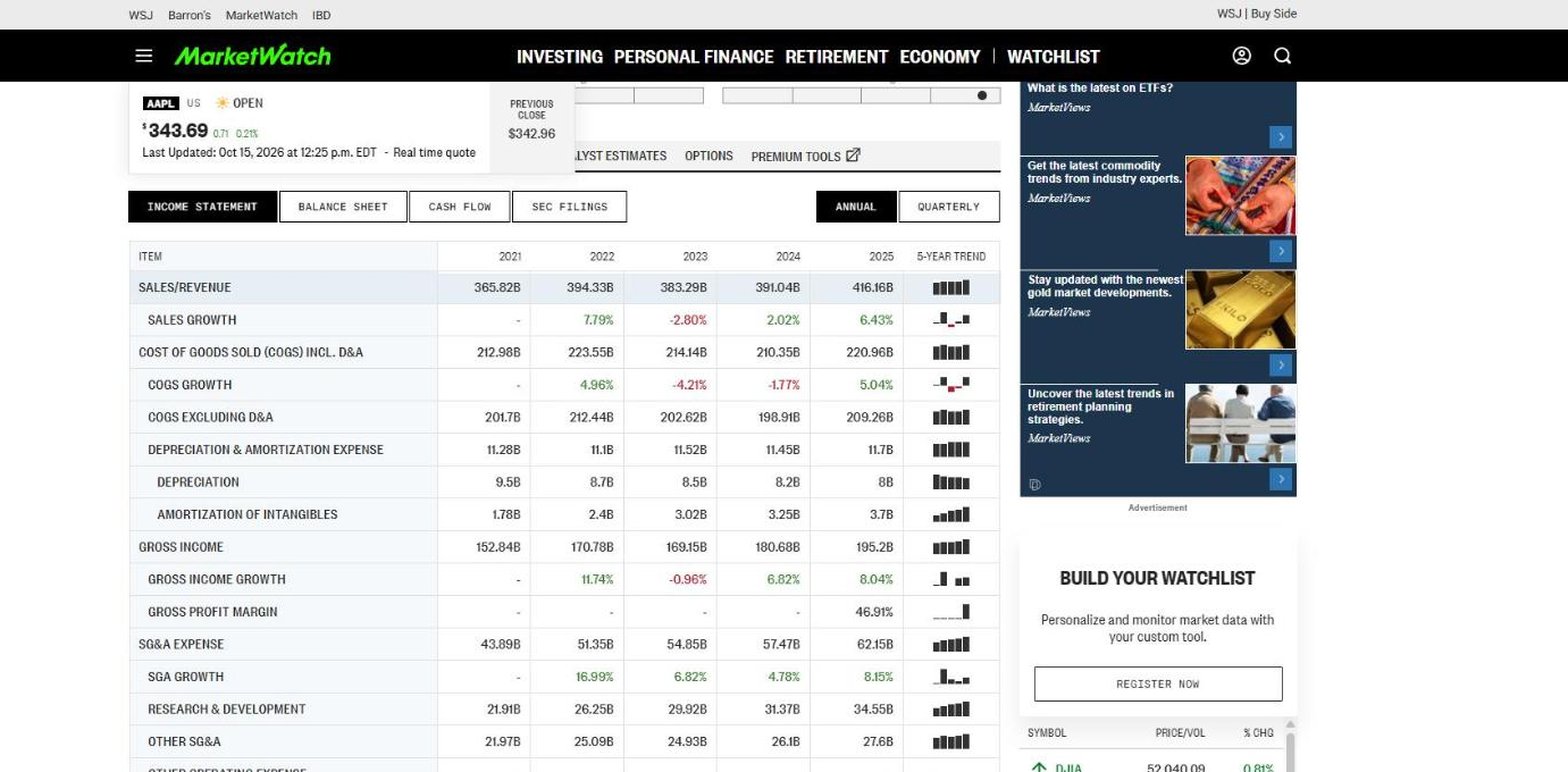
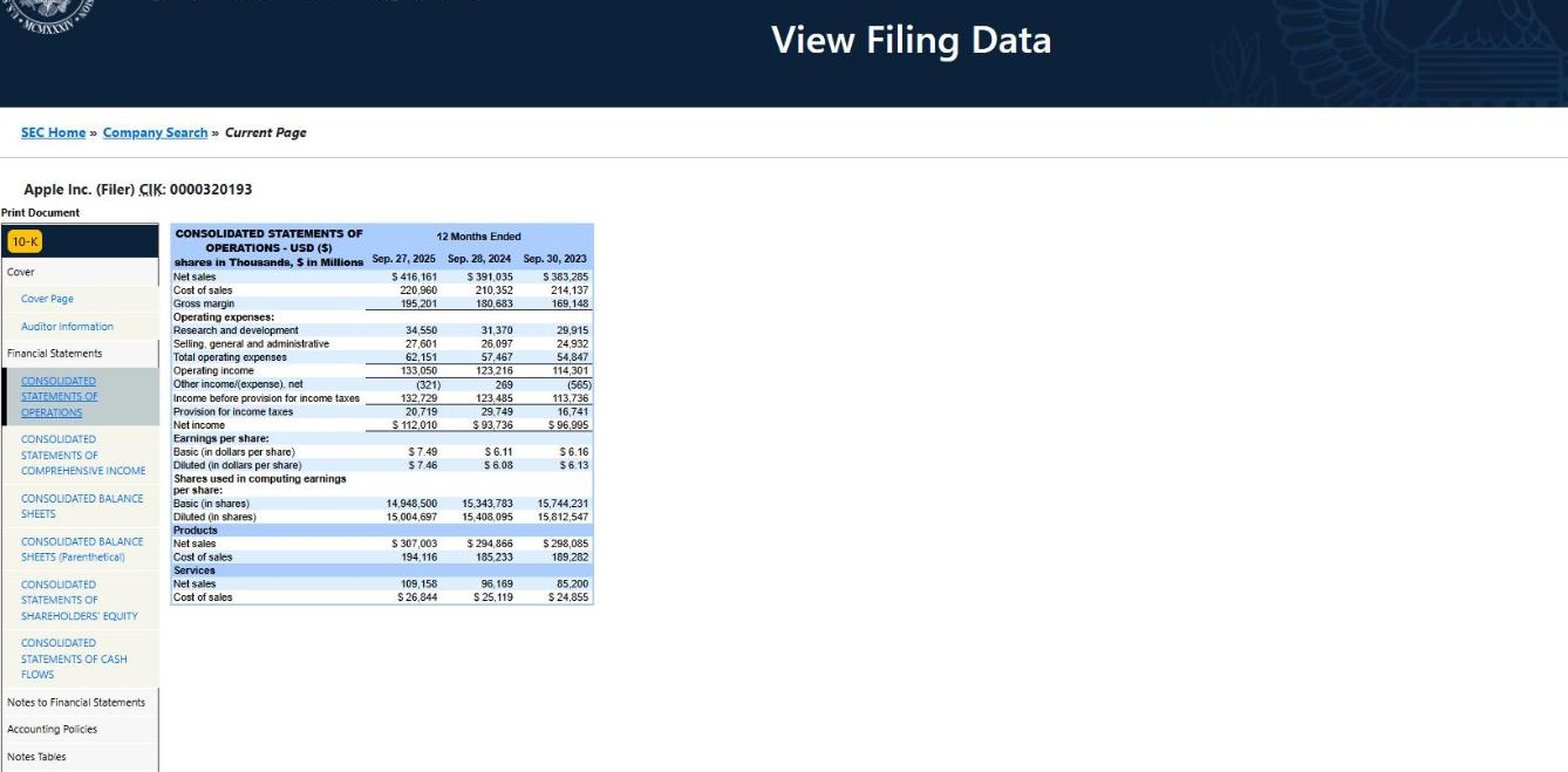
Layout is the difference most people never notice. Apple's own 10-K for fiscal 2025 prints one cost of sales line, $220,960 million. MarketWatch shows the same total and then splits it into $209.26 billion excluding depreciation and amortization plus $11.7 billion of depreciation and amortization, lines that come from its standardised template rather than from Apple's statement. Neither is wrong: a template lets you line up 2 companies, and an as-filed statement tells you exactly what the company said. The trouble starts when a template built for a manufacturer is applied to a bank and the lines stop meaning anything.
Quarters differ for a reason that surprises people. Companies file a 10-Q for their first 3 quarters only, and the fourth quarter sits inside the annual 10-K. Unless a site derives it, you are left subtracting 9 months from the full year yourself.
History is the third difference. A 5-year window is shorter than most business cycles, and restatements make older years tricky to compare. How restatements and amended filings change history explains what to watch for before you read a decade of numbers side by side.
How to choose a financial statements website
- Years and quarters. How much you see without paying, and how far back the cheapest plan goes.
- Layout. As filed, standardised, or fitted to the company's industry.
- Around the statements. Segments, KPIs, estimates and ownership beside them.
- Getting the data out. Spreadsheet export or an API, and on which plan.
If you want the same statements in code, our financial statements API comparison covers that side.
The 9 financial statement websites at a glance
- Koyfin
- MarketWatch
- Morningstar
- SEC EDGAR
- Seeking Alpha
- Stock Analysis
- TIKR
- Yahoo Finance
- Business Quant
| Platform | Best for | Plans from |
|---|---|---|
| Koyfin | Statements beside charts and dashboards | $39/mo |
| MarketWatch | A quick 5-year look, no account | $0 |
| Morningstar | Statements next to analyst fair values | $20.75/mo |
| SEC EDGAR | Filings exactly as reported | $0 |
| Seeking Alpha | Statements beside contributor analysis | $299/yr |
| Stock Analysis | Long history at a low price | $6.58/mo |
| TIKR | Global statements and segments | $17.95/mo |
| Yahoo Finance | Quick checks, with decades of statements on Gold | $7.95/mo |
| Business Quant | Statements in industry layouts, with segments, KPIs, export and API access | $29/mo |
Rows are alphabetical, Business Quant last. "Plans from" is the cheapest paid plan's lowest advertised monthly price on 15 October 2026, or its yearly price where only that is advertised; $0 means the site sells no statement plan.
Financial statement websites reviewed
Koyfin
Koyfin is a market dashboard and charting platform where financial statements are one panel among many. It is built for looking at a company against its peers and the market, and it prices statement depth plainly in its plan grid.
- Best for statements beside charts, dashboards and peers.
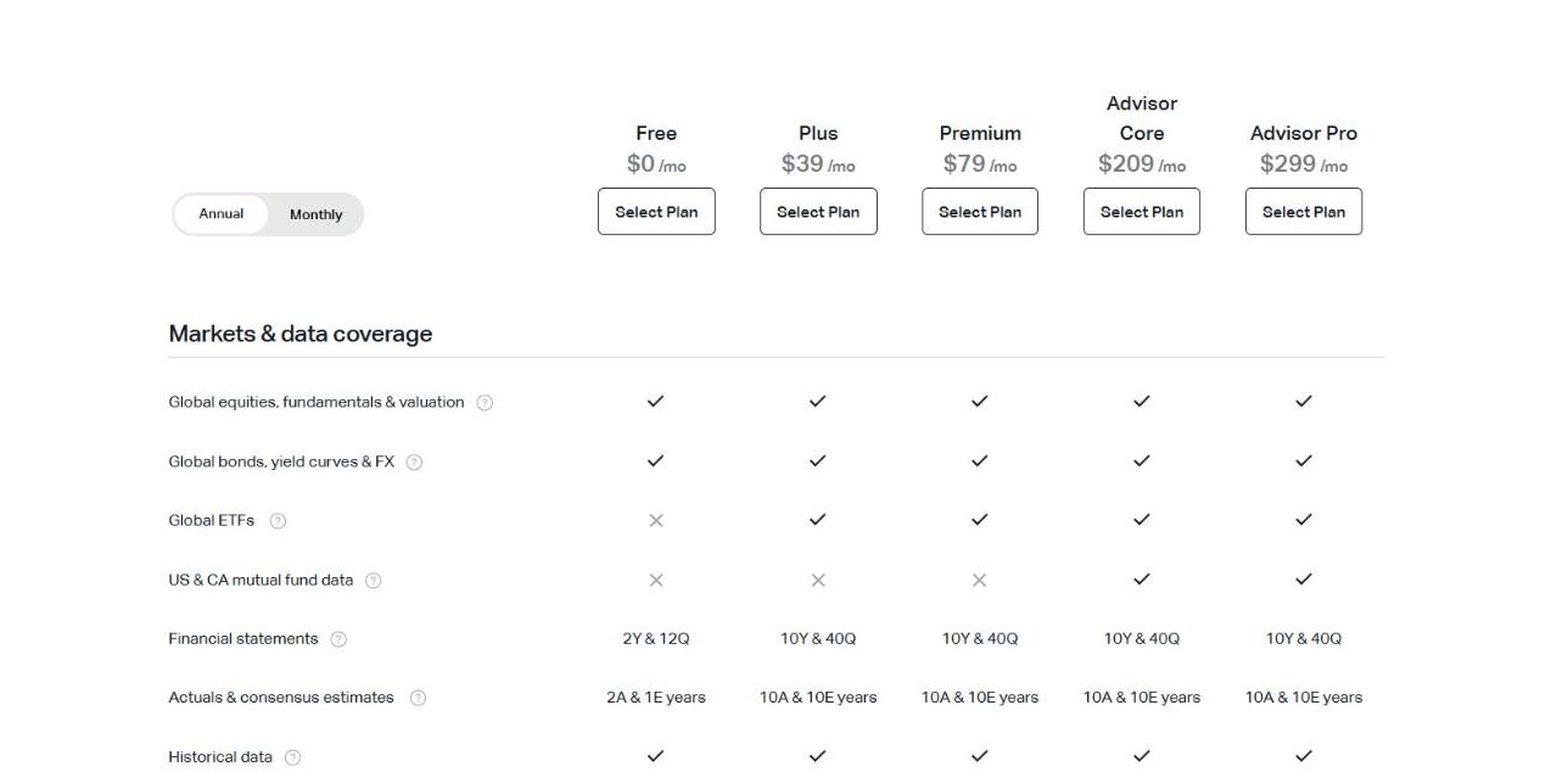
- Free plan with 2 years and 12 quarters of statements.
- Plus from $39 a month, with 10 years and 40 quarters.
- Consensus estimates, 10 years on paid plans.
Koyfin's 40 quarters on Plus is generous: 10 years of quarters shows seasonality and turning points that annual figures hide. Its statements use bank line items for a bank, and its plans add filings, ownership and macro dashboards.
Where it falls short: 2 years on the free plan is the shortest free history here, and paying more than Plus adds tools rather than years. Koyfin's help page says its data vendor, Capital IQ, restricts equity financials from being downloaded, and there is no segment or KPI data and no API.
MarketWatch
MarketWatch is the Dow Jones markets site, and a free place to look up a company's numbers without signing in. Its financials pages show all 3 statements with a small trend chart beside every line.
- Best for a quick 5-year look with no account.
- 5 fiscal years and 5 quarters of all 3 statements.
- Analyst estimates, insider actions and SEC filings on each stock.
- No paid statement plan.
For a fast check of whether sales and margins are rising, MarketWatch is hard to beat: open the page and the answer is there with a sparkline. JPMorgan's income statement starts from interest income and runs through the loan-loss provision, so its template does fit a bank.
Where it falls short: 5 years and 5 quarters is all it shows, so it suits a first look rather than a long study. There is no export, segment or KPI data, or API.
Morningstar
Morningstar is an investment research firm whose stock pages carry the financial statements alongside its analysts' star rating, fair value estimate and economic moat rating.
- Best for statements next to analyst fair values.
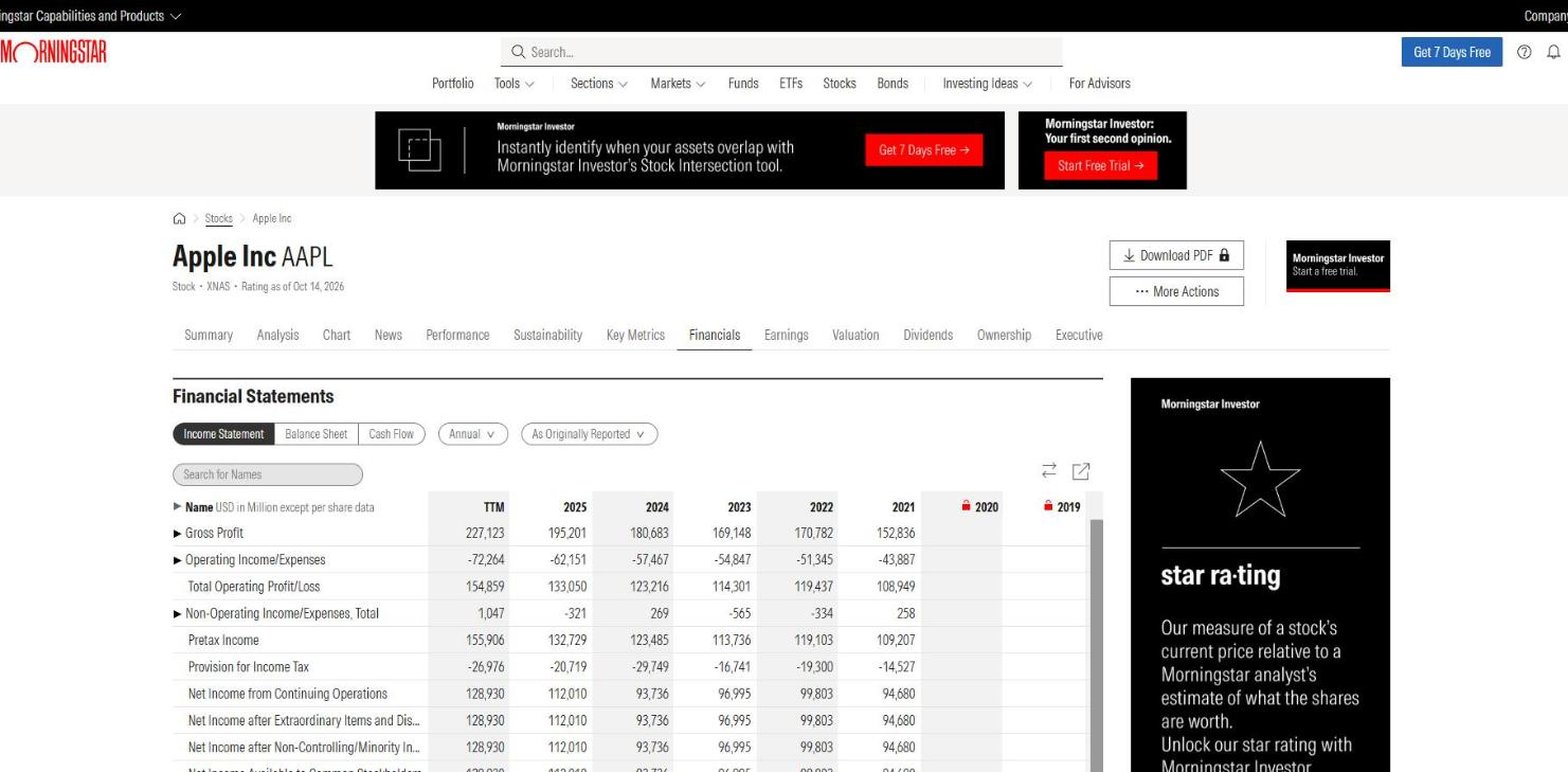
- 5 fiscal years plus TTM without paying, 10 once unlocked.
- Investor from $20.75 a month, or $34.95 billed monthly.
- As Originally Reported or Restated view.
The reported-or-restated selector is the feature worth knowing. When a company reorganises its segments or changes an accounting rule, older years are restated, and seeing what was printed at the time keeps you honest about a trend. Its statements use bank line items for a bank, and each stock lists its fund and institutional holders.
Where it falls short: history stops at 10 years, and the heart of the subscription is the analyst view rather than the statements. We found no segment data, consensus estimates, filing list or statement download, and its API is sold only to enterprise customers.
SEC EDGAR
SEC EDGAR is the source. US public companies file their annual and quarterly reports with the Securities and Exchange Commission, and EDGAR publishes them free as they are accepted.
- Best for statements exactly as the company filed them.
- $0, no account.
- Interactive Data viewer for each 10-K and 10-Q.
- Financial Statement Data Sets from January 2009, as filed.
- Insider ownership reports and a free data API.
Click Interactive Data next to any 10-K or 10-Q and EDGAR shows each statement as a clean table, with the notes, including segment information, in a menu beside it. For bulk work, the Financial Statement Data Sets hold the face financials of every XBRL filing from January 2009 to September 2026, unchanged from the filings and updated each quarter.
Where it falls short: each annual report shows 3 years and each quarterly report 2 periods, so a 10-year view means opening a stack of filings, and no 10-Q covers a fiscal fourth quarter. EDGAR is the record; turning it into a time series is the work every other site here sells.
Seeking Alpha
Seeking Alpha is an investing community known for contributor articles and its Quant Ratings, with a statements view that shows exactly where the free line falls.
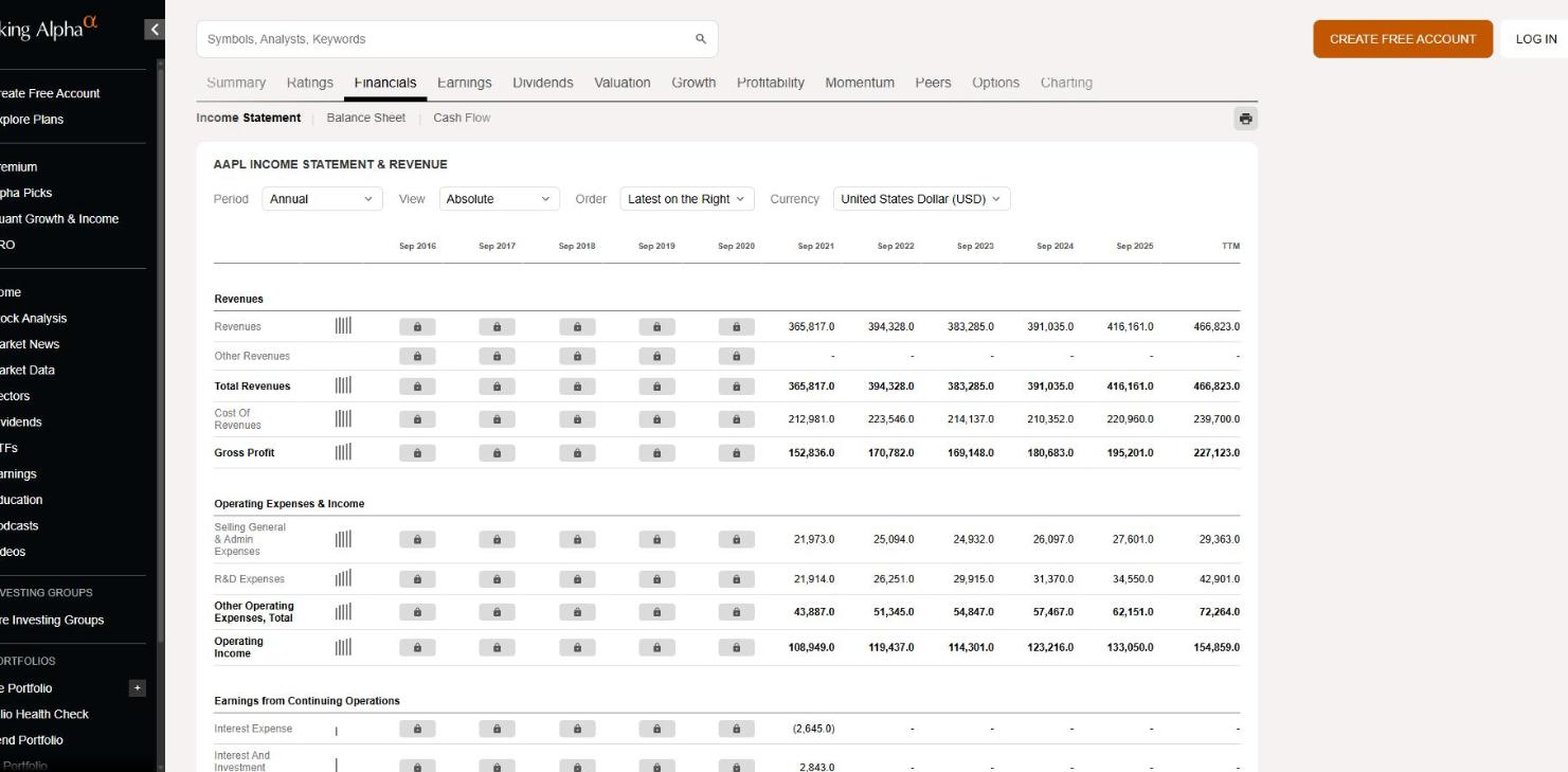
- Best for statements beside written analysis.
- 5 fiscal years plus TTM without paying, 10 on Premium.
- Premium renews at $299 a year, after $4.95 for the first month.
- Period, view and currency selectors on every statement.
The statements are clean and quick to scan, and the currency selector helps with foreign filers. Each stock also carries consensus estimates, ownership and its SEC filings.
Where it falls short: Premium is priced by the year and mostly buys the analysis and ratings around the numbers, and the statements top out at 10 years. There is no segment or KPI data and no API.
Stock Analysis
Stock Analysis is a financial data site that shows a lot without paying and sells long history and downloads for a small fee.
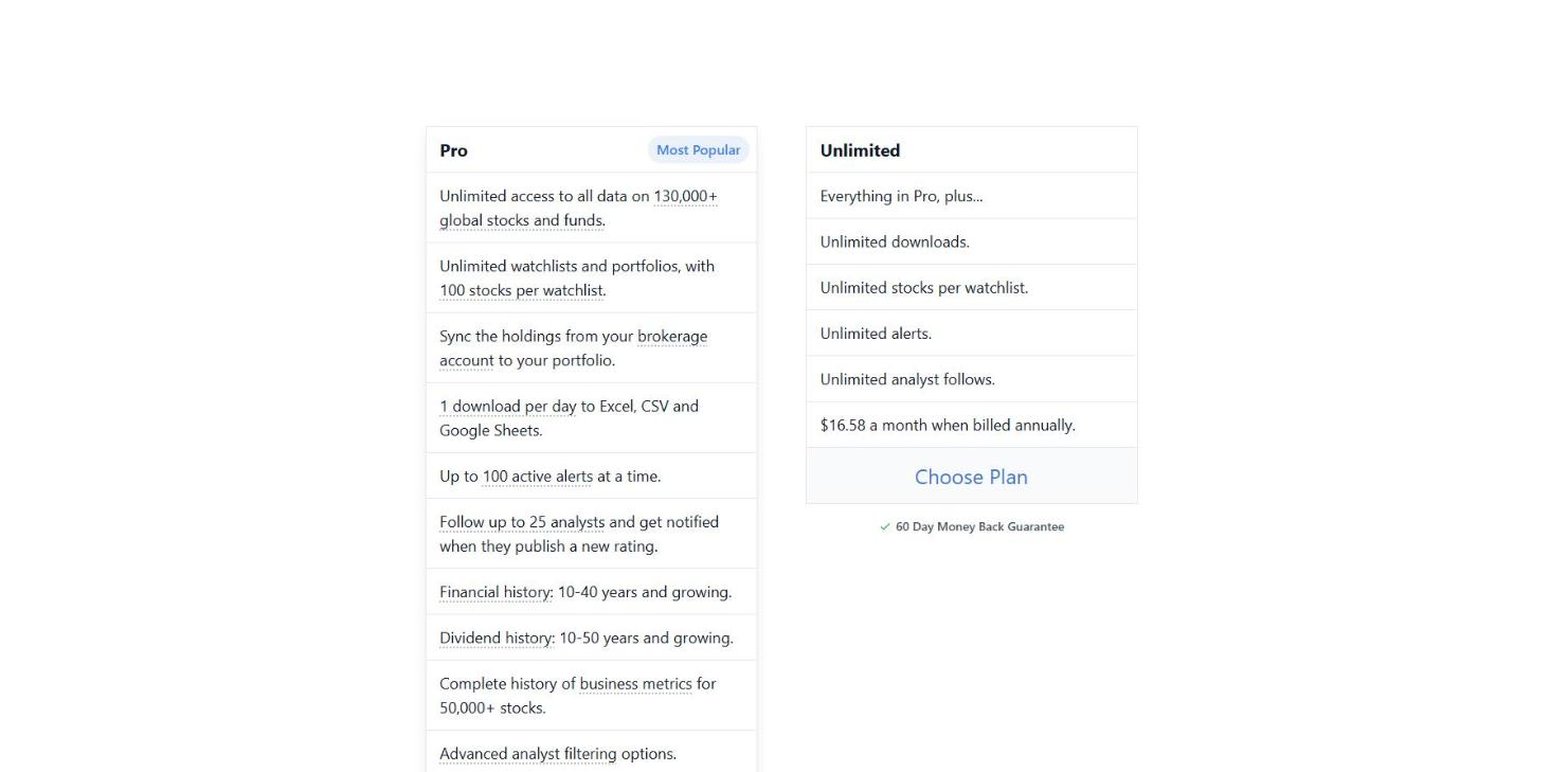
- Best for long statement history at a low price.
- 5 fiscal years and 20 quarters without paying.
- Pro from $6.58 a month, or $9.99 billed monthly.
- 10 to 40 years of financial history on Pro.
- One download a day to Excel, CSV or Google Sheets on Pro.
Stock Analysis is the cheapest paid route to a long record on this list, and its free quarterly view runs a full 20 quarters, fourth quarters included. Its statements use bank line items for banks, and the metrics tab adds revenue by segment and geography and company metrics beside them.
Where it falls short: downloads are metered at one a day on Pro, and there is no ownership data, filing list, API or MCP server.
TIKR
TIKR is a terminal-style platform that sells global company data at retail prices, with a ladder from a few years free to 30 years on its top plan.
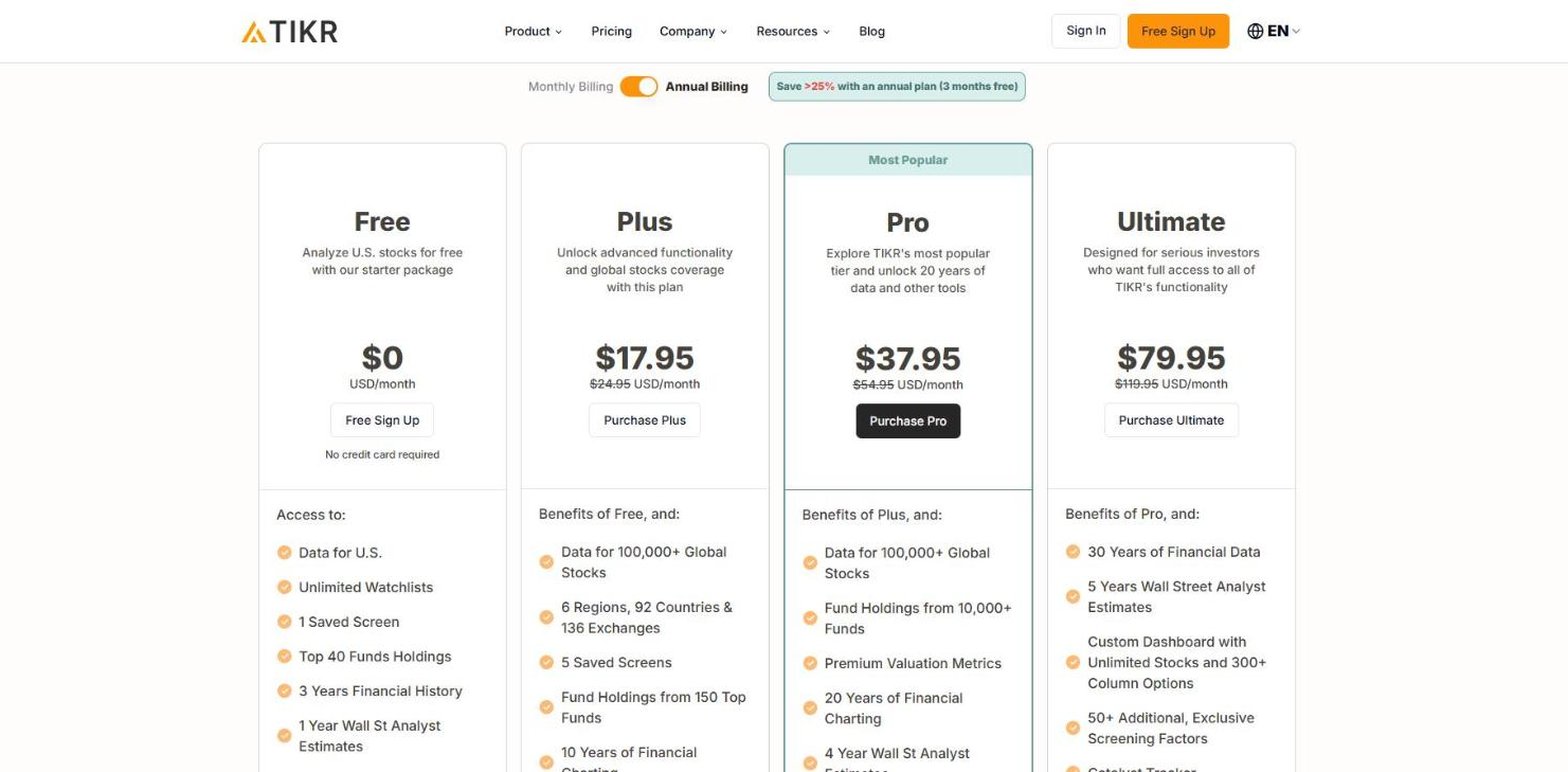
- Best for global statements with segments.
- Free plan for US companies only.
- Plus from $17.95 a month, global, with 10 years and 20 quarters.
- Ultimate $79.95, with 30 years and 40 quarters.
TIKR's Financials tab puts the income statement, balance sheet, cash flow, ratios and segments on sub-tabs of one screen, and global coverage on Plus reaches 100,000+ stocks. Its pages add estimates, ownership and filings, and a 14-day money-back guarantee covers every paid plan.
Where it falls short: its pricing page disagrees with itself about the free plan, with 3 years on the card and 5 years and 8 quarters in the grid. Export starts on Pro, according to its help centre, and there is no API or KPI data.
Yahoo Finance
Yahoo Finance is a free quote and news site with statements a click away on every stock page, and the longest advertised statement history here on its top plan.
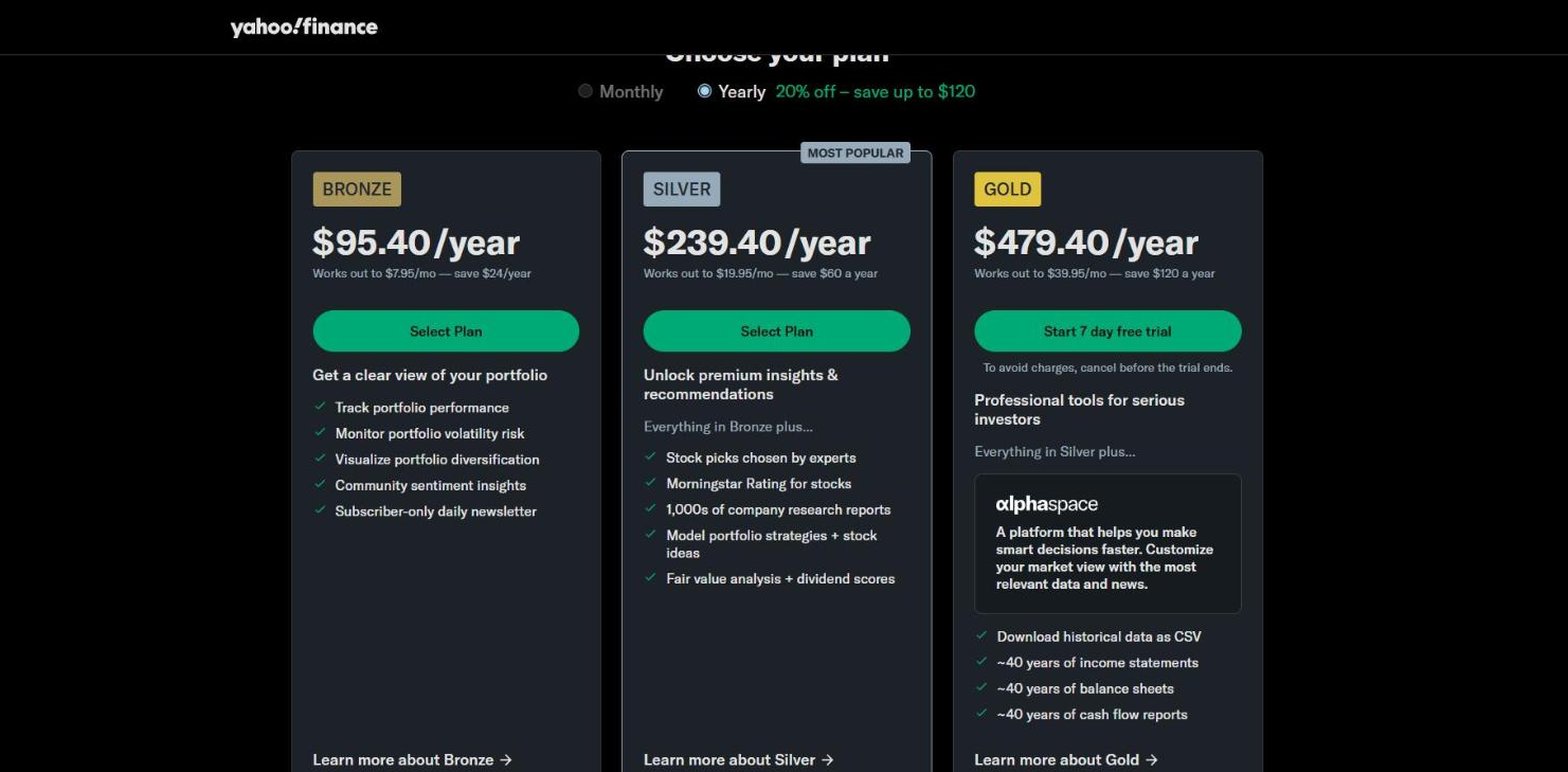
- Best for quick checks, with decades of statements on Gold.
- 4 fiscal years and 5 quarters without paying, plus TTM.
- Bronze from $7.95 a month, for portfolio tools.
- Gold $39.95 a month, with about 40 years of statements.
For checking last year's revenue or this quarter's cash flow while you read the news, Yahoo Finance is right there. Its statements use bank line items for a bank, and each stock shows analyst estimates and its holders without paying.
Where it falls short: the free view is the shortest of the household names at 4 years, and the long record and CSV download sit on Gold rather than Bronze. There is no segment data, filing list or public API.
Business Quant
Business Quant is ours. Every US-listed company has its own income statement, balance sheet and cash flow statement pages, annual, quarterly and TTM, laid out for the company's industry.
- Best for statements in industry layouts, with segments, KPIs, export and API access.
- Free to use, 5 years and 20 quarters, no card.
- Pro from $29 a month, full history, export and API access.
List of features
- Financial statements: annual, quarterly and TTM
- 4 standardised statement templates: general, real estate, utilities and capital markets
- Financial results from 10-K, 10-Q, 8-K, 20-F, 40-F and 6-K filings
- Ratios and growth metrics
- History page for every line item
- CSV and XLSX download
- Segment financials
- KPI and operating data
- Analyst estimates
- Dividends
- Industry financials
- Peers
- Time series tables
- Advanced charting
- Institutional ownership and insider trades
- 18 million+ SEC filings since 1993
- Economic data
- Stock screener
- API access
- MCP server
- Results within 10 to 15 minutes of release
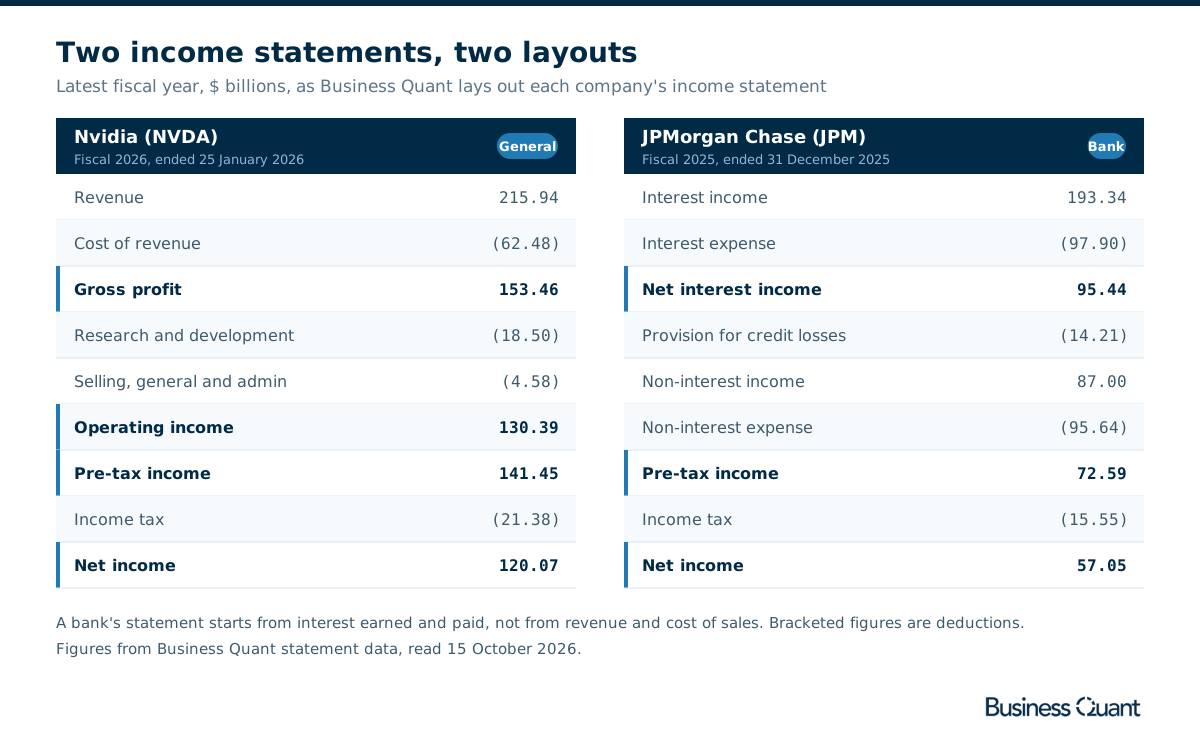
A bank does not have revenue and cost of sales the way a chipmaker does; it earns interest, pays interest and sets money aside for bad loans. Our statements are standardised on one of 4 templates, so JPMorgan Chase's runs from interest income of $193.34 billion through net interest income and the provision for credit losses, while Nvidia's runs from revenue to gross profit to operating income. The fourth quarter appears as a quarter of its own, not a sum you have to work out.
We take results from 10-K, 10-Q, 20-F and 40-F filings, and also from the 8-K and 6-K filings that carry earnings releases, so a new quarter appears within 10 to 15 minutes of the release. The free account shows the latest 5 fiscal years and 20 quarters of all 3 statements, plus recent segment revenue. Pro opens every reported year and quarter, back to fiscal 2009 for long-listed companies such as Walmart, JPMorgan Chase and Nvidia, and adds company KPIs, longer segment history, CSV and XLSX downloads and our API.
Financial statement websites feature by feature
| Platform | Spreadsheet export |
Industry‑specific statements |
Segment financials |
Company KPIs |
Analyst estimates |
Insider & Inst. Ownership |
SEC filings |
Economic data |
API access |
MCP server |
Plans from |
|---|---|---|---|---|---|---|---|---|---|---|---|
| Business Quant | ✓ | ✓ | ✓ | ✓ | ✓ | ✓ | ✓ | ✓ | ✓ | ✓ | $29/mo |
| Koyfin | ✗ | ✓ | ✗ | ✗ | ✓ | ✓ | ✓ | ✓ | ✗ | ✗ | $39/mo |
| SEC EDGAR | ✗ | ✓ | ✓ | ✗ | ✗ | ✓ | ✓ | ✗ | ✓ | ✗ | $0 |
| Stock Analysis | ✓ | ✓ | ✓ | ✓ | ✓ | ✗ | ✗ | ✗ | ✗ | ✗ | $6.58/mo |
| MarketWatch | ✗ | ✓ | ✗ | ✗ | ✓ | ✓ | ✓ | ✗ | ✗ | ✗ | $0 |
| TIKR | ✗ | ✗ | ✓ | ✗ | ✓ | ✓ | ✓ | ✗ | ✗ | ✗ | $17.95/mo |
| Seeking Alpha | ✗ | ✗ | ✗ | ✗ | ✓ | ✓ | ✓ | ✗ | ✗ | ✗ | $299/yr |
| Yahoo Finance | ✗ | ✓ | ✗ | ✗ | ✓ | ✓ | ✗ | ✗ | ✗ | ✗ | $7.95/mo |
| Morningstar | ✗ | ✓ | ✗ | ✗ | ✗ | ✓ | ✗ | ✗ | ✗ | ✗ | $20.75/mo |
Sorted by ticks, ties broken alphabetically. A tick means the platform's own pages or help centre document the feature, on a self-serve plan or at no cost; a cross means we found no such documentation. Every site here shows all 3 statements, so statements have no column. "Spreadsheet export" means downloading a company's statements on the cheapest paid plan. "Industry-specific statements" means a bank, for example, is shown with bank line items such as net interest income and loan-loss provisions rather than a generic template; we checked JPMorgan's income statement on each site. "Segment financials" means revenue by segment, product or geography over several years. "Company KPIs" means operating metrics such as subscribers or deliveries. "Analyst estimates" means consensus revenue or earnings forecasts. "Insider & Inst. Ownership" covers insider trades or holdings and institutional holders. "SEC filings" means a company's filing list. "Economic data" means macro series such as GDP, inflation and interest rates. "API access" and "MCP server" mean a self-serve API and an AI-assistant connector; Morningstar sells its API only to enterprise customers.
Business Quant is the only site here that ticks every column. Koyfin, SEC EDGAR and Stock Analysis come next with 5 each: Koyfin for estimates, ownership, filings and economic data, EDGAR for the filings themselves, insider reports and a free API, and Stock Analysis for export, segments and KPIs. A cross shows what a site was built for, not how good it is.
What about FactSet, Mergent and AnnualReports.com?
These come up in almost every search for company financials, and none shows all 3 statements as figures at no cost or at a published self-serve price. FactSet and Mergent Online are professional and library subscriptions priced by sales call. AnnualReports.com is an archive of annual report PDFs rather than statement data, the FDIC's BankFind Suite holds regulatory reports for banks rather than listed companies' statements, and Fiscal.ai's pricing page shows a trial but no price.
Which financial statements website is right for you?
- You want statements beside charts and peers: Koyfin.
- You want a quick free look with no account: MarketWatch.
- You want an analyst's fair value beside the numbers: Morningstar Investor.
- You want the filing exactly as submitted: SEC EDGAR.
- You read analysis alongside the statements: Seeking Alpha.
- You want long history for a few dollars a month: Stock Analysis Pro.
- You follow companies outside the US: TIKR.
- You want decades of statements: Yahoo Finance Gold.
- You want statements laid out for the industry, with segments, KPIs, export and an API: Business Quant.
For valuation and research tools around the numbers, our stock analysis websites guide compares the wider field, and the financial statements guides explain what each line means before you rely on it.
Where I would read a company's statements
If you only need last year's revenue, any site will do. If you want to understand a company from its own numbers, I would start on Business Quant.
Three things decide whether a statements page can be trusted: enough periods, the right lines and a clear route back to the filing. The free account gives you 5 years and 20 quarters of all 3 statements, fourth quarters included, on every US-listed company. The layout fits the industry, so a bank's statement starts from interest income and a chipmaker's from revenue. New results arrive within 10 to 15 minutes of a company's release, with the filing one tab away. Pro, from $29 a month, adds the full record, segment and KPI data, export and our API.
A 5-minute test before you settle on any site: pick a bank you follow and open its income statement. If the first line says revenue and the second says cost of goods sold, the template was built for someone else's business, and every ratio computed from it inherits the problem.
How this comparison was made
To make the list, a website had to let an individual open a listed company and read its income statement, balance sheet and cash flow statement as figures on a page, either at no cost or on a self-serve plan with a price published on the vendor's own site. Sales-led terminals, PDF archives and sites without a published price were not included. 9 sites met that bar.
Every price, plan limit and history figure was read on the vendor's own pricing, plan or statement pages on 15 and 16 October 2026, and the screenshots were taken there. Years and quarters visible without paying were read on Apple's statement page on each site, or in the vendor's own plan grid. Prices are each platform's lowest advertised monthly price on that date; Seeking Alpha advertises only a yearly renewal. The Business Quant illustration comes from our statement data.
The list, the summary table and the reviews run alphabetically, with Business Quant last, and the feature table is sorted by the number of ticks, with ties broken alphabetically. We make Business Quant, one of the 9 products compared here.
Image credits. Header photograph by Jakub Żerdzicki on Unsplash, used under the Unsplash License. Vendor screenshots were captured on 15 October 2026 from each provider's own pricing, plan or statement pages and are reproduced for comparison. The statement illustration is our own, built from our statement data.
Frequently asked questions
What is the best website to find a company's financial statements?
For reading statements in a clean, comparable format, Business Quant shows the income statement, balance sheet and cash flow statement for every US-listed company in industry-specific layouts, with the latest 5 fiscal years and 20 quarters free to use and the full record on Pro from $29 a month. For the filing exactly as the company submitted it, SEC EDGAR is the source every other site starts from. Stock Analysis is the cheapest paid route to long history, from $6.58 a month.
Where can I find a company's financial statements for free?
SEC EDGAR has every annual and quarterly report a US company has filed, at no cost. Among websites that lay the numbers out for you, Business Quant, Stock Analysis, Morningstar, Seeking Alpha and MarketWatch each show 5 fiscal years without payment; Business Quant and Stock Analysis also show 20 quarters. Yahoo Finance shows 4 years and 5 quarters, and Koyfin's $0 plan shows 2 years and 12 quarters.
What is the best website for historical financial data?
It depends how far back you need to go. Yahoo Finance Gold lists about 40 years of statements at $39.95 a month, TIKR Ultimate 30 years at $79.95, and Stock Analysis Pro advertises 10 to 40 years from $6.58 a month. Business Quant Pro, from $29 a month, opens every reported year and quarter in its database, back to fiscal 2009 for long-listed companies, along with segment financials. The SEC's own Financial Statement Data Sets run from January 2009 and are free.
What is the difference between as-reported and standardized financial statements?
An as-reported statement copies the company's own line items, so it matches the filing but is hard to compare across companies. A standardized statement maps every company onto a common template, which makes comparison easy but can add or merge lines. MarketWatch, for example, splits Apple's cost of sales into a figure excluding depreciation and a separate depreciation line, which Apple's own income statement does not print. Business Quant takes a middle route: statements are standardised on a layout chosen for the company's industry, so a bank starts from interest income rather than from revenue and cost of sales.
Can I download financial statements to Excel?
Yes, on most paid plans. Business Quant includes data export on Pro from $29 a month, and Stock Analysis Pro allows one download a day to Excel, CSV or Google Sheets from $6.58 a month. The SEC publishes its Financial Statement Data Sets as free quarterly downloads. Koyfin's own help page says equity financials cannot be exported because of its data vendor's restriction.
Can ChatGPT read financial statements?
It can read a statement you paste in or upload, but it will not reliably know a company's latest figures on its own. Business Quant runs an MCP server that connects Claude, ChatGPT, Cursor and VS Code to its financial statements, segments and filings data through 23 read-only tools, and it is usable free with one custom connector, so the assistant answers from the reported numbers.