9 Best QuickFS Alternatives for 2027
QuickFS is gone. Plenty of sites show 10 years of financial statements, but few let you take the numbers with you.


QuickFS shut down in February 2026. It was one of the simplest ways to get a decade or more of a company's standardised financial statements into a spreadsheet, through Excel exports, an Excel add-in or an API, and its users now need another source.
Below are 9 QuickFS alternatives that give you at least 10 years of standardised statements for US stocks. We compare them on history, segment and KPI data, spreadsheet export, API access and price.
Why QuickFS closed
On 3 February 2026, QuickFS announced it would close within days and refund Premium users' last payment. A second notice the next day gave the reason. Customers had been told the data came directly from company filings; it was in fact another provider's data, redistributed without permission. That provider would not license downloads through an API, an Excel add-in or Excel exports, the 3 features at the heart of QuickFS Premium. The founder has since decided not to relaunch.
The lesson is that where a site's numbers come from decides what you can do with them. Most financial sites license their fundamentals from a larger vendor, and the licence sets the rules on export. Koyfin and TIKR both name S&P Capital IQ as their source, and Stock Analysis names S&P Global Market Intelligence. Koyfin's help page says Capital IQ does not allow equity financials, valuation, estimates or growth rates to be exported, and TIKR's help centre says some of its data partners restrict export altogether. On screen, none of that matters. In your own spreadsheet, it decides everything.
How to choose a QuickFS replacement
Five things decide whether a site can replace QuickFS for you.
- History depth. 10+ years of annual statements, ideally with quarters.
- Beyond statements. Segment financials and company KPIs alongside the 3 statements.
- Data out. CSV, Excel or Sheets export, an add-on, or an API.
- Standardisation. The same line items across companies, plus ratios and growth.
- Price. The cost of the first plan with the history and export you need.
For reading statements on screen, see our financial statements websites guide.
The 9 QuickFS alternatives at a glance
| Platform | Best for | Plans from |
|---|---|---|
| Koyfin | Dashboards and global coverage | $39/mo |
| Morningstar | Statements beside analyst fair values | $20.75/mo |
| Roic.ai | The closest QuickFS-style statement view | $24/mo |
| Stock Analysis | Long history and downloads on a budget | $6.58/mo |
| Stock Rover | Screening and portfolios on fundamentals | $24/mo |
| TIKR | Global fundamentals at retail prices | $17.95/mo |
| Wisesheets | Replacing the QuickFS add-in | $60/yr |
| Yahoo Finance | Very long history on one plan | $7.95/mo |
| Business Quant | Statements, segments and KPIs with export | $29/mo |
Rows are alphabetical, Business Quant last. "Plans from" is the cheapest paid plan's lowest advertised monthly price, or its yearly price where only that is advertised.
QuickFS alternatives reviewed
Koyfin
Koyfin is a market terminal for individual investors and advisers, built around dashboards, charts and watchlists. Financial statements are one tab among many, next to estimates, valuation and charting, and the plan grid states plainly how much history each tier unlocks.
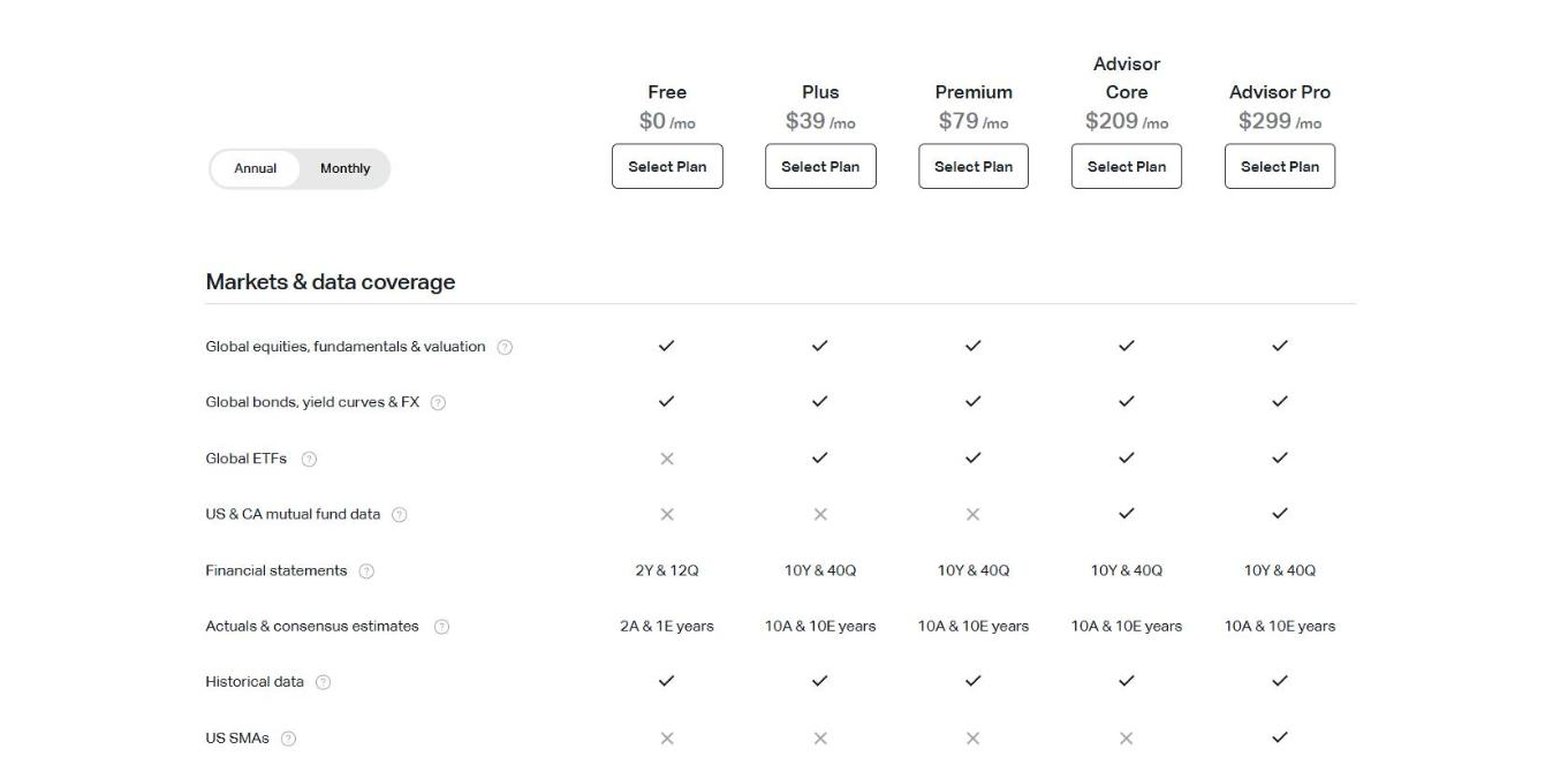
- Best for dashboards, charting and global coverage.
- $0 plan with 2 years and 12 quarters of statements.
- Plus from $39 a month, 10 years and 40 quarters.
- Premium $79, with custom formulas and templates.
- Estimates 1 year ahead free, 10 years on paid plans.
- Transcript summaries with full history on paid plans.
Koyfin's paid plans carry 40 quarters of statements, enough to see how a business moves through a decade, and its global coverage suits anyone who followed European or Australian companies on QuickFS.
Where it falls short: Koyfin is built for analysis on screen, not for filling a spreadsheet. Its data vendor does not allow equity financials to be exported, it has no segment or KPI data, and there is no API.
Morningstar
Morningstar is the investment research firm behind the star ratings and economic moat ratings most investors already know. Its stock pages pair a company's financial statements with an analyst's fair value estimate, so you can read the numbers and a professional view of them side by side. Without a subscription you see 5 fiscal years plus trailing twelve months; Morningstar Investor unlocks the rest of the decade along with the ratings.
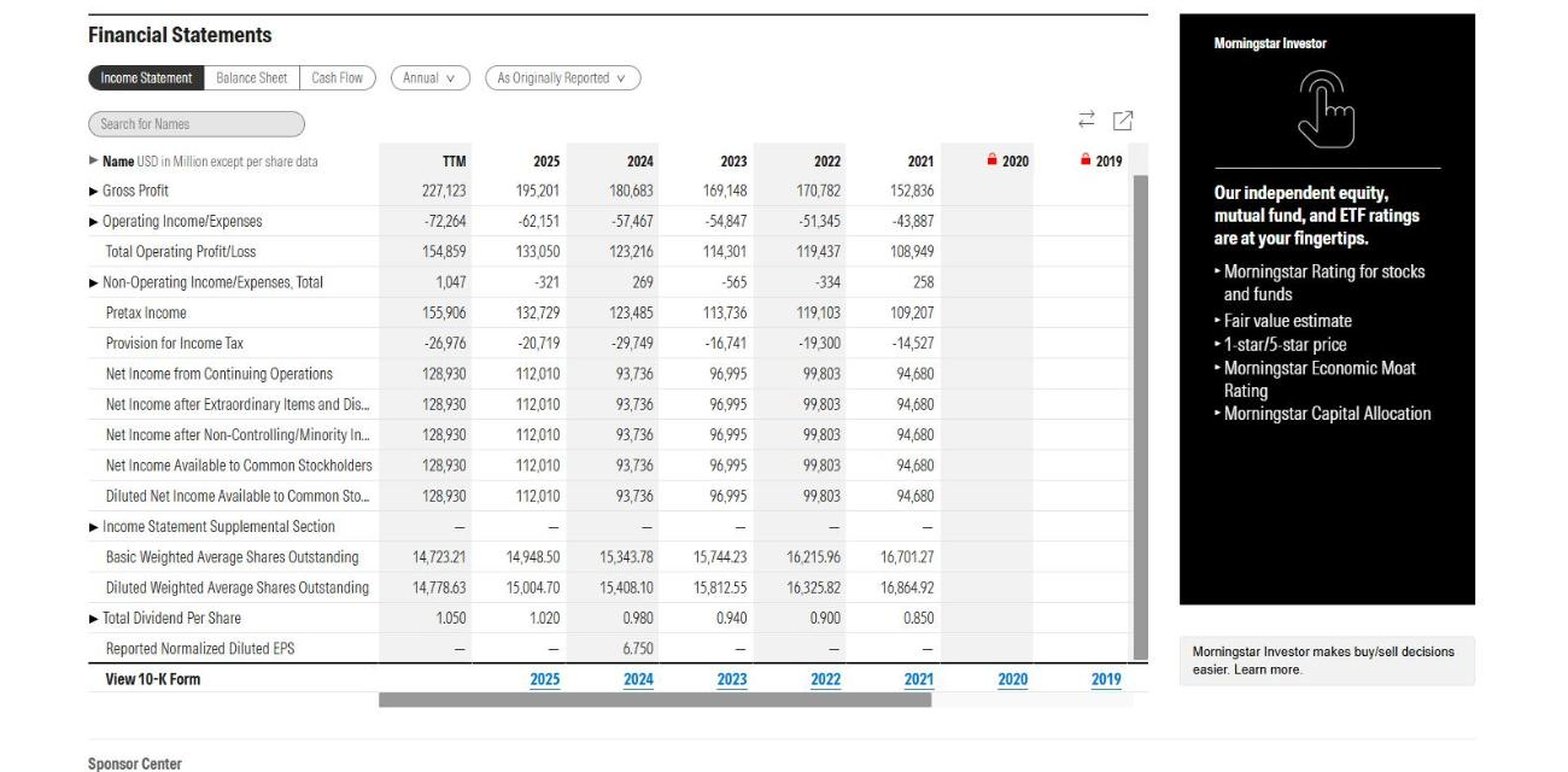
- Best for statements beside an analyst's fair value.
- 5 fiscal years plus TTM visible without paying.
- Investor from $20.75 a month, or $34.95 billed monthly.
- 10 fiscal years on Investor.
- As Originally Reported view of each statement.
- Fair value, star rating and moat rating on Investor.
Its As Originally Reported view shows a company's figures as first filed, before any restatement, which helps when you check an old QuickFS model against what was reported at the time. Morningstar suits investors who want the numbers next to a professional opinion.
Where it falls short: history stops at 10 years, the retail site has no segment data, and Investor documents no way to download statements. Its API and MCP server are sold only to enterprise customers.
Roic.ai
Roic.ai is the closest thing to QuickFS still running. Its statement pages lay out long, dense columns of standardised line items, much as QuickFS did. Behind the website sits an API with a free key, a Google Sheets add-on and an MCP server.
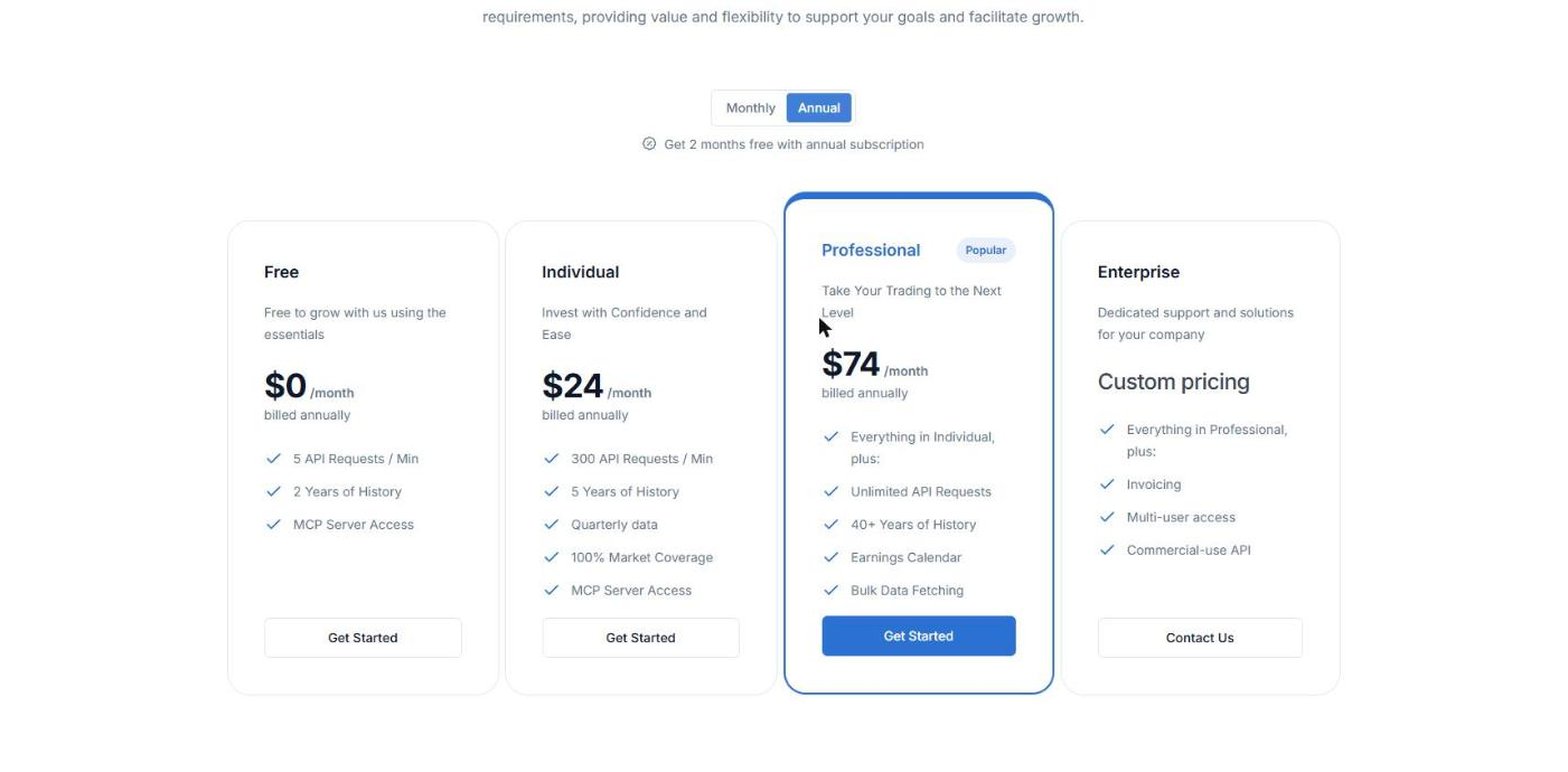
- Best for a QuickFS-style statement view and an API.
- 15 fiscal years of Apple's statements free, no account.
- Free API key with 2 years of history and MCP access.
- Individual from $24 a month, 5 years and 20 quarters.
- Professional from $74 a month, 40+ years and 160+ quarters.
- Google Sheets add-on that runs on your API key.
Roic.ai prices its plans around API access, and the history you can pull grows with the plan. To fill a 10-year spreadsheet through its Google Sheets add-on, you need the $74 Professional plan, which also adds bulk downloads.
Where it falls short: Roic.ai's statements are consolidated only. Its documentation shows no segment fields, and it has no ownership or KPI data either.
Stock Analysis
Stock Analysis is a clean research site covering more than 130,000 stocks and funds worldwide. Each company page carries its statements, ratios and a metrics tab that tracks company-specific numbers alongside revenue by segment and geography.
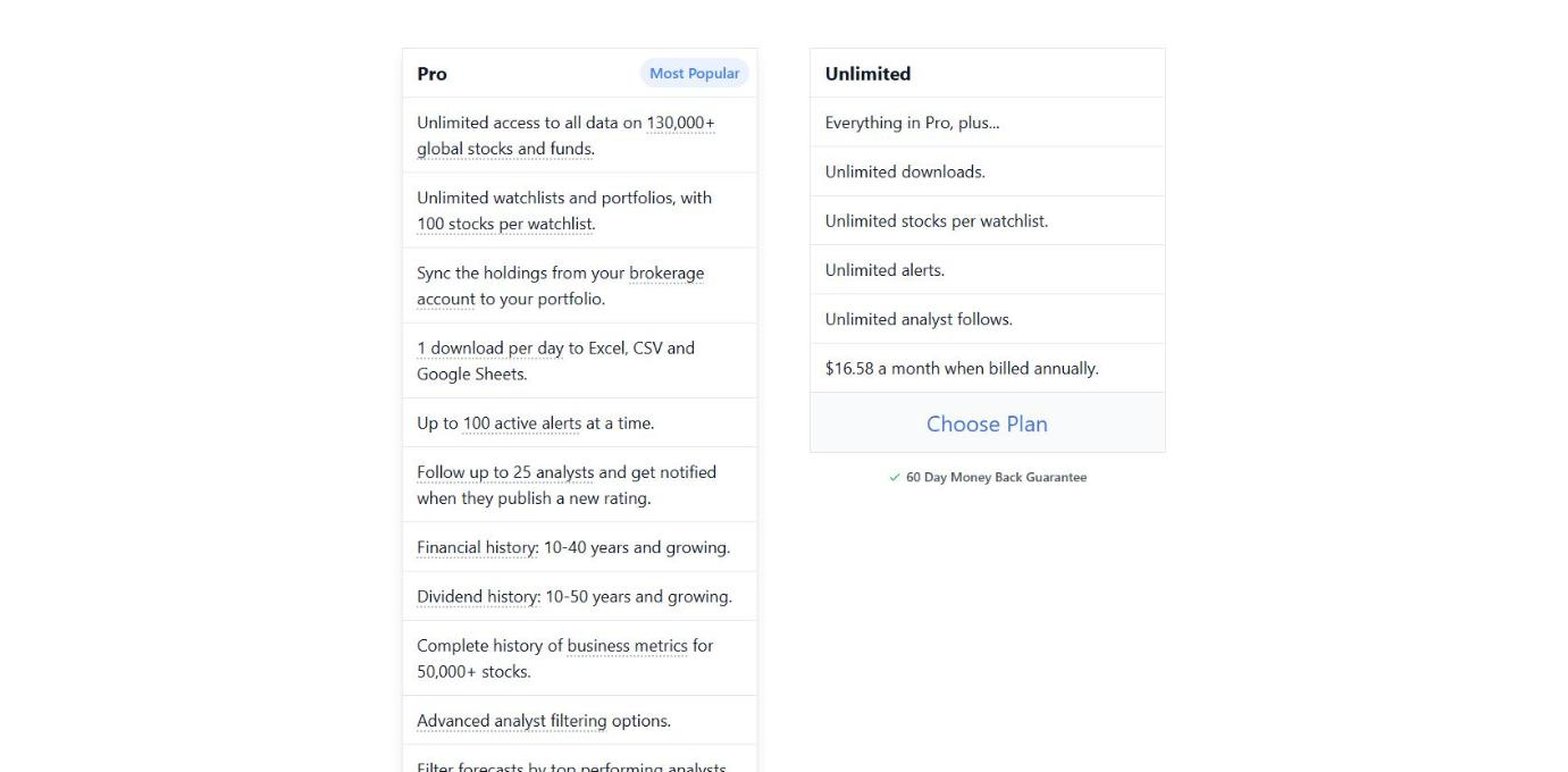
- Best for long history and downloads on a budget.
- 5 fiscal years of statements free.
- Pro from $6.58 a month, or $9.99 billed monthly.
- 10 to 40 years of financial history on Pro.
- One download a day to Excel, CSV or Google Sheets.
- Revenue by segment and geography.
Among the research websites here, Stock Analysis is the cheapest way to get a long record into a spreadsheet, and both paid plans come with a 60-day money-back guarantee.
Where it falls short: Pro allows one download a day, and lifting that cap means the Unlimited plan, from $16.58 a month. There is no API or MCP server, so everything goes through the website, and there is no ownership data or filing list.
Stock Rover
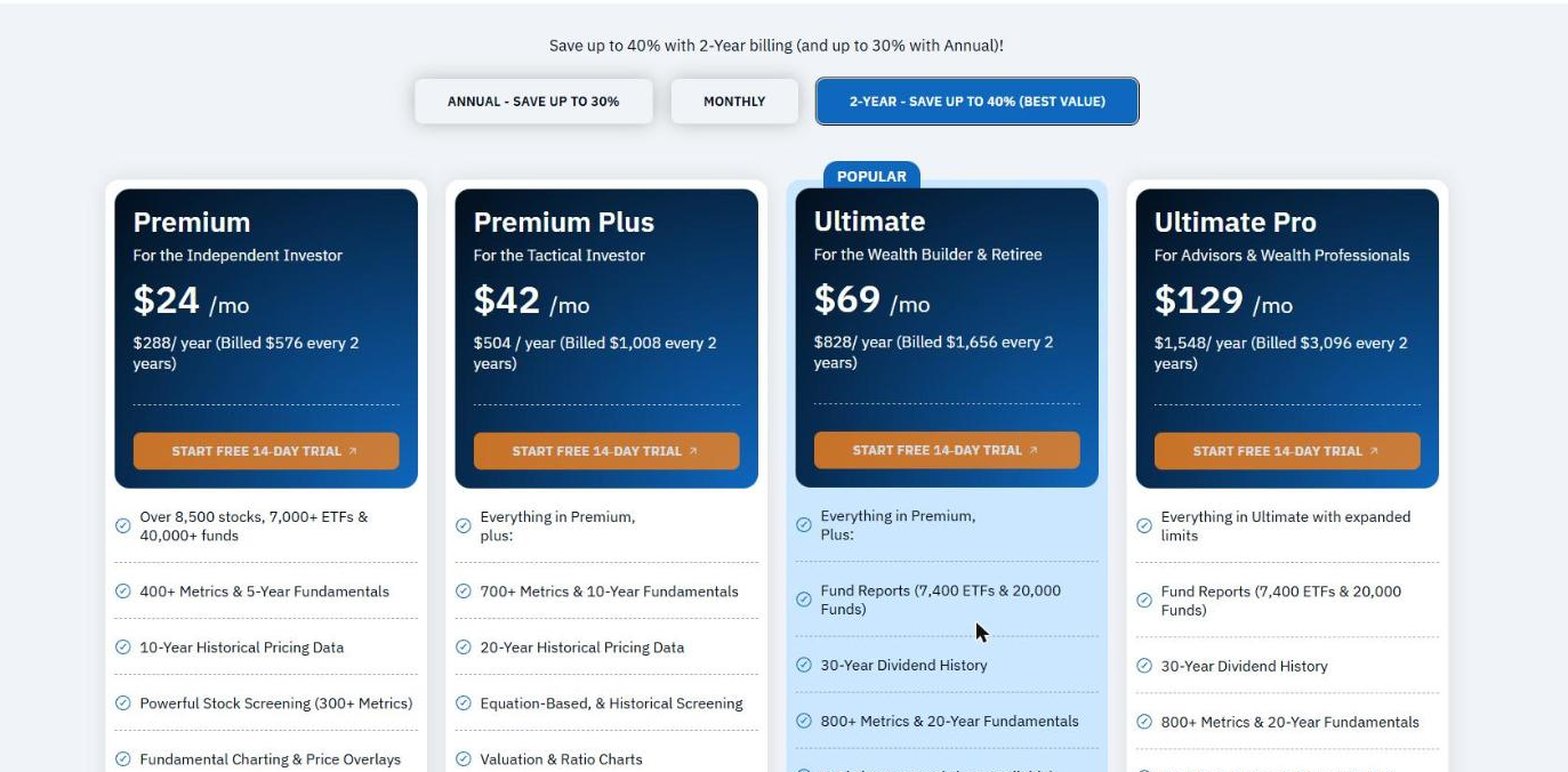
Stock Rover is a research and portfolio platform for investors who like to work in tables. Its plans are priced by depth of fundamentals (5, 10 or 20 years) and by the number of metrics (400+ to 800+). Coverage runs to 8,500+ stocks, 7,000+ ETFs and 40,000+ funds.
- Best for screening and portfolios built on fundamentals.
- Premium from $24 a month on 2-year billing, 5-year fundamentals.
- Premium Plus $42, 10-year fundamentals and 700+ metrics.
- Ultimate $69, 20-year fundamentals and 800+ metrics.
- Data export on every paid plan.
- 14-day trial on each plan.
Stock Rover is at its best when you screen, value and track a portfolio on the same fundamentals, with equation-based screening, fair value estimates and insider data built in.
Where it falls short: the entry plan carries only 5 years of fundamentals, so matching QuickFS's decade means Premium Plus, at $42 a month on 2-year billing or $49 on annual billing. There is no segment or KPI data, and no API.
TIKR
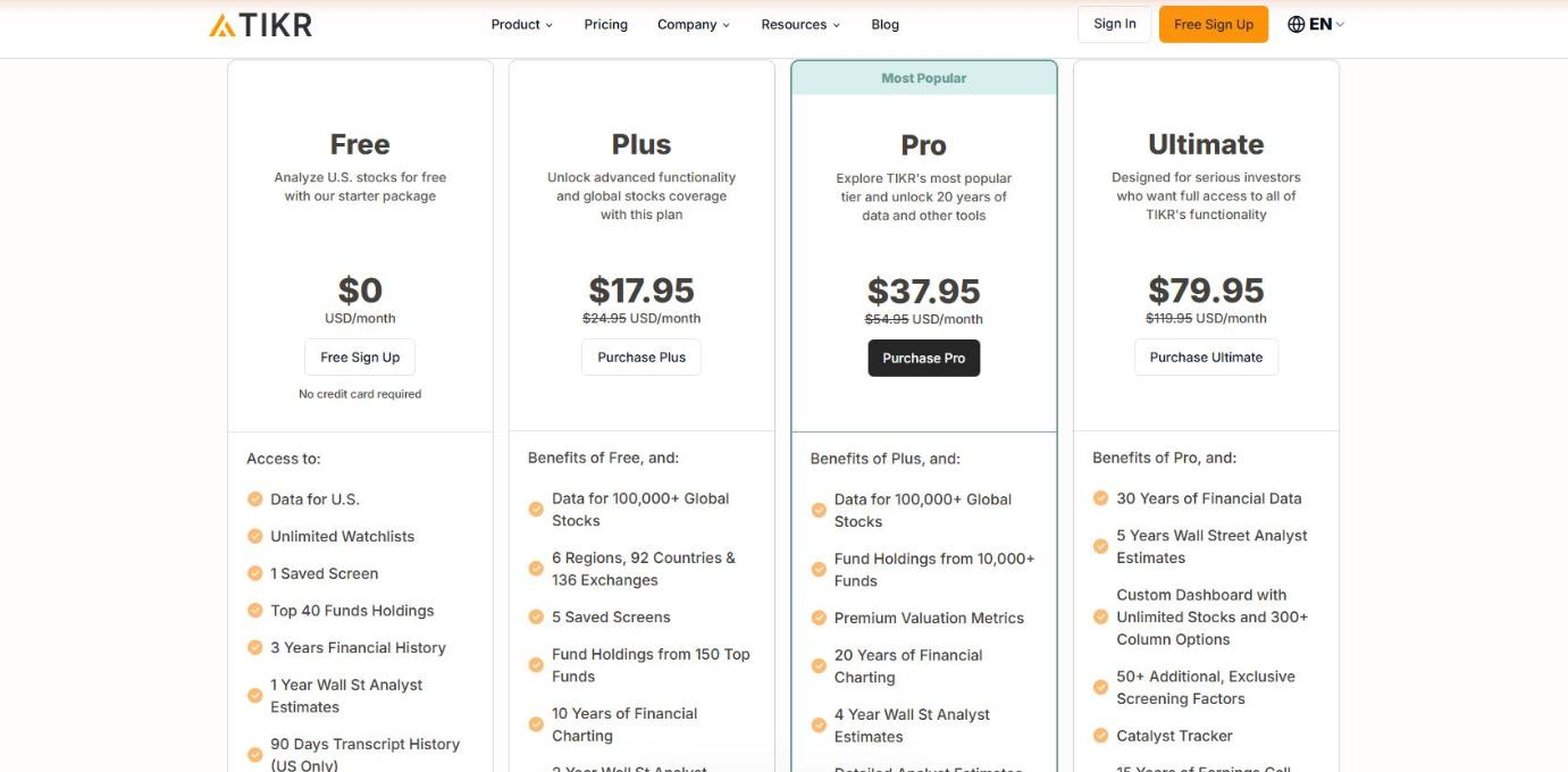
TIKR is a global fundamentals terminal sold at retail prices, built on S&P Capital IQ data for more than 100,000 stocks in 92 countries. Its statements view puts the income statement, balance sheet, cash flow, ratios and segments side by side, and any line can be charted with a click.
- Best for global fundamentals and segment history.
- $0 plan for US stocks only.
- Plus from $17.95 a month, 10 years and 20 quarters.
- Pro $37.95, 40 quarters, segment data and export.
- Ultimate $79.95, 30 years of financial data.
- Company filings and earnings call transcripts.
If you used QuickFS for non-US companies, TIKR is the strongest pick here. Alongside the statements, it shows what other investors hold: the top 40 funds on Plus, rising to more than 10,000 investors, including company insiders and hedge funds, on Ultimate.
Where it falls short: getting data out. TIKR reserves export for Pro subscribers, Plus subscribers can only copy and paste tables, and there is no API. The pricing page also gives two answers for the free plan: 3 years of history on the plan card, and 5 years and 8 quarters in the comparison grid.
Wisesheets
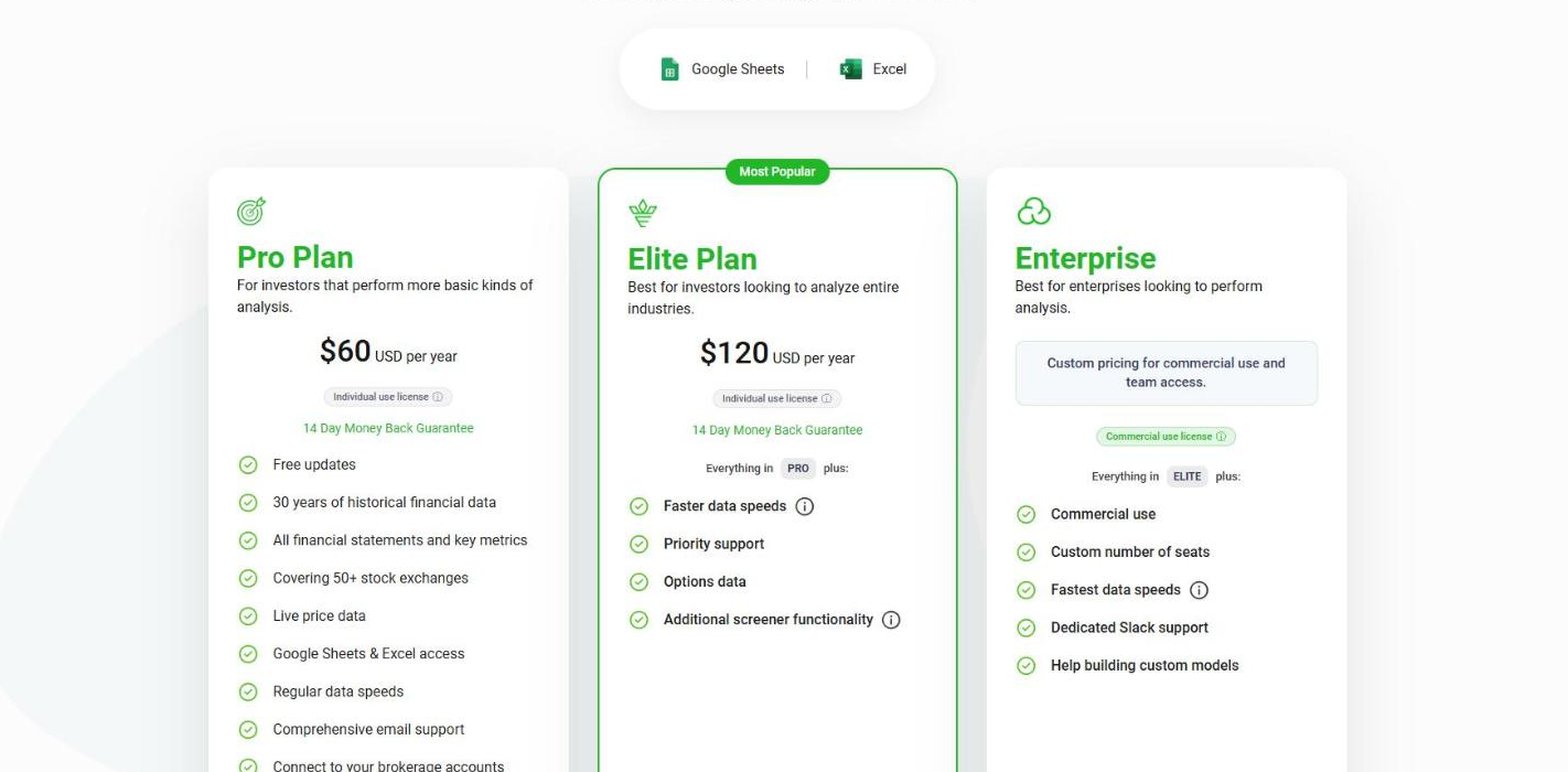
Wisesheets is a spreadsheet add-on rather than a website, and the most direct replacement for QuickFS's Excel add-in. You install it in Excel or Google Sheets, sign in, and pull statements and metrics into cells with functions or one-click tables. Alongside the add-on, a separate API built from SEC filings records the XBRL tag, accession number and filing date behind each value.
- Best for replacing the QuickFS add-in.
- Pro $60 a year, individual use.
- Elite $120 a year, faster data and options data.
- 30 years of historical financial data.
- Excel and Google Sheets on one subscription.
- API and MCP server for code and AI assistants.
- 14-day money-back guarantee.
Wisesheets covers more than 50 exchanges, and at $60 a year it is the cheapest paid plan on this list.
Where it falls short: it is sold by the year only, with a trial instead of a free plan, and it has no company KPIs or ownership data. Segment revenue is documented for the add-in, not for the API.
Yahoo Finance
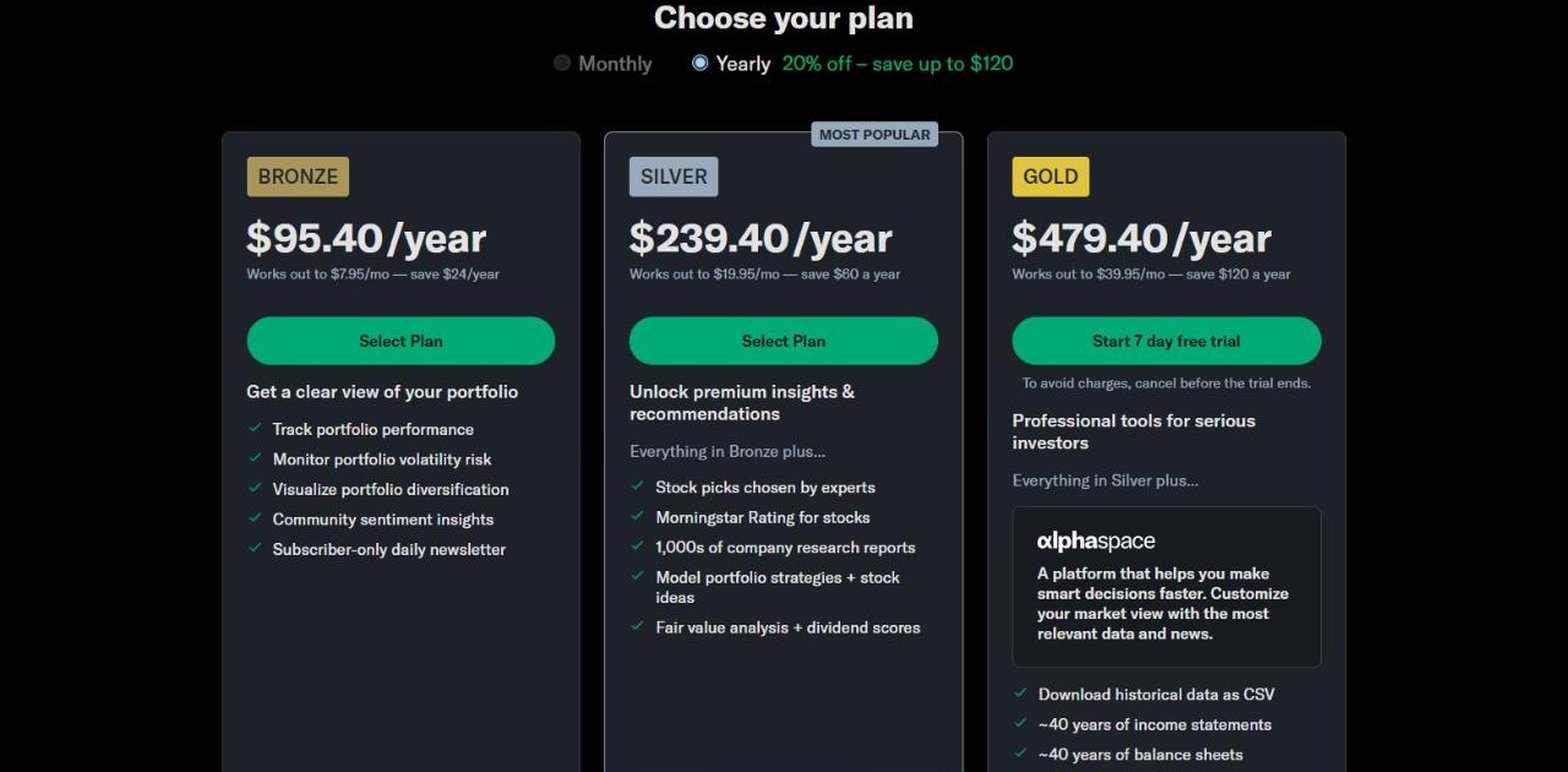
Yahoo Finance is the quote and news site most investors already have open. Its free statement pages show 4 fiscal years plus trailing twelve months, and its paid tiers add portfolio tools on Bronze, research on Silver, and about 40 years of statements with downloads on Gold. That is the longest statement history advertised on this list.
- Best for very long history on a single plan.
- 4 fiscal years of statements free, plus TTM.
- Bronze from $7.95 a month, for portfolio tools.
- Silver $19.95, with fair value analysis and research reports.
- Gold $39.95, ~40 years of all 3 statements.
- Statement downloads on Gold.
Yahoo Finance keeps the statements next to the quotes, news and portfolios many investors already use, and its Holders and Analysis tabs add ownership data and analyst estimates. Gold comes with a 7-day trial, so you can test the 40-year history before paying $39.95 a month on yearly billing.
Where it falls short: Bronze and Silver list no extra statement history or downloads, so the price that matters is Gold's. Yahoo Finance also has no segment data and no public API.
Business Quant
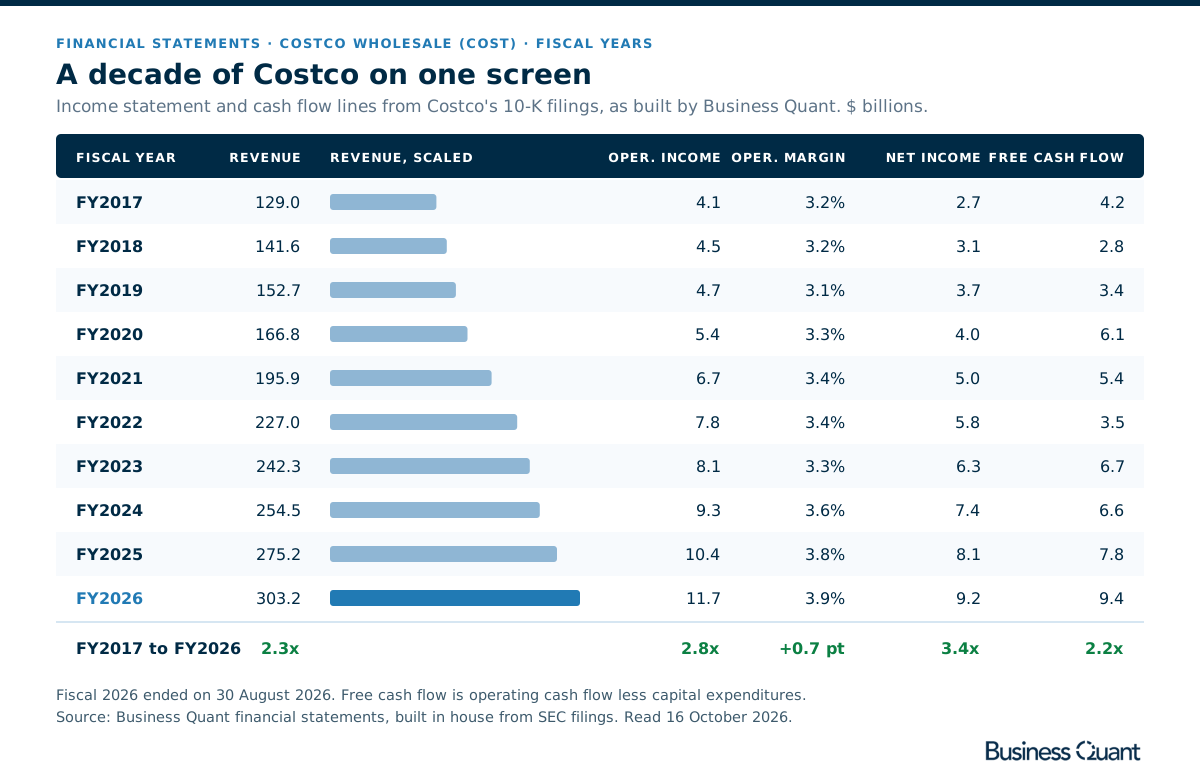
Business Quant is ours. We build our fundamentals in house rather than licensing them from a data vendor, so the export on Pro is ours to offer and no supplier can take it away.
- Best for statements, segments and KPIs with export and API access.
- Free to use, 5 years and 20 quarters, no card.
- Pro from $29 a month, full history, export and API access.
List of features
- Financial statements: annual, quarterly and TTM
- 4 standardised statement templates: general, real estate, utilities and capital markets
- Financial results from 10-K, 10-Q, 8-K, 20-F, 40-F and 6-K filings
- Ratios and growth metrics
- History page for every line item
- CSV and XLSX download
- Segment financials
- KPI and operating data
- Analyst estimates
- BQ-MICS industry classification: 11 sectors, 71 industry groups, 288 industries
- Industry financials
- Peers
- Stock screener
- Time series tables
- Advanced charting
- Institutional ownership and insider trades
- 18 million+ SEC filings since 1993
- Economic data
- API access
- MCP server
- Results within 10 to 15 minutes of release
Every company is standardised on one of 4 templates (general, real estate, utilities or capital markets), so a bank's statements show bank line items rather than a retailer's. We take results from 10-K, 10-Q, 20-F and 40-F filings, and also from the 8-K and 6-K filings that carry earnings releases, so a quarter's numbers arrive with the release instead of weeks later with the periodic report. You can switch between annual, quarterly and TTM views, open the full history of any line item, and copy the API call behind each table in URL, Python or JavaScript. On Pro, the full record downloads to CSV or XLSX.
We also cover what most statement sites skip: segment financials and more than 20,000 KPIs, from Tesla's deliveries by model to AT&T's churn rate. Industry financials group companies by BQ-MICS, our own classification of 288 industries, which tags a company in every industry it operates in rather than forcing it into one. Time series tables compare any metric across a set of companies, and statements, segments and estimates are also available through our API on Pro and the MCP server in Claude and ChatGPT.
QuickFS alternatives feature by feature
| Platform | Spreadsheet export |
Industry‑specific statements |
Segment financials |
Company KPIs |
Analyst estimates |
Insider & Inst. Ownership |
SEC filings |
Economic data |
API access |
MCP server |
Plans from |
|---|---|---|---|---|---|---|---|---|---|---|---|
| Business Quant | ✓ | ✓ | ✓ | ✓ | ✓ | ✓ | ✓ | ✓ | ✓ | ✓ | $29/mo |
| Koyfin | ✗ | ✓ | ✗ | ✗ | ✓ | ✓ | ✓ | ✓ | ✗ | ✗ | $39/mo |
| Stock Analysis | ✓ | ✓ | ✓ | ✓ | ✓ | ✗ | ✗ | ✗ | ✗ | ✗ | $6.58/mo |
| Wisesheets | ✓ | ✗ | ✓ | ✗ | ✓ | ✗ | ✗ | ✗ | ✓ | ✓ | $60/yr |
| Roic.ai | ✓ | ✗ | ✗ | ✗ | ✓ | ✗ | ✗ | ✗ | ✓ | ✓ | $24/mo |
| TIKR | ✗ | ✗ | ✓ | ✗ | ✓ | ✓ | ✓ | ✗ | ✗ | ✗ | $17.95/mo |
| Morningstar | ✗ | ✓ | ✗ | ✗ | ✓ | ✓ | ✗ | ✗ | ✗ | ✗ | $20.75/mo |
| Stock Rover | ✓ | ✗ | ✗ | ✗ | ✓ | ✓ | ✗ | ✗ | ✗ | ✗ | $24/mo |
| Yahoo Finance | ✗ | ✓ | ✗ | ✗ | ✓ | ✓ | ✗ | ✗ | ✗ | ✗ | $7.95/mo |
Sorted by ticks, ties broken alphabetically. A tick means the platform's own pages or help centre document the feature on a self-serve plan; a cross means we found no such documentation. "Spreadsheet export" refers to the cheapest paid plan; TIKR reserves export for Pro, and Plus subscribers can copy and paste tables. "Industry-specific statements" means a bank, for example, is shown with bank line items such as net interest income and loan-loss provisions rather than a generic template; we checked JPMorgan's income statement on each site or in its documentation. "Segment financials" means revenue by segment, product or geography. "Company KPIs" means operating metrics such as subscribers or deliveries. "Insider & Inst. Ownership" covers insider trades or holdings and institutional holders. "SEC filings" means a company's filing list. "Economic data" means macro series such as GDP, inflation and interest rates, not only an economic calendar. "API access" and "MCP server" mean a self-serve API and an AI-assistant connector; Morningstar sells both only to enterprise customers.
Business Quant is the only product here that ticks every column. Koyfin, Stock Analysis and Wisesheets come next, each for a different reason: Koyfin has economic data and industry-specific statements but no export, Stock Analysis has segments and KPIs but no API, and Wisesheets has its add-on, API and MCP server but no KPIs, ownership data or filing lists. A cross shows what a product was built for, not how good it is.
If you mainly pulled QuickFS data by code, our financial statements API comparison goes deeper on that side of the market. For a refresher on what each line item means, start with our financial statements guides.
What about FastFS and Fiscal.ai?
You will see both names in almost every thread about replacing QuickFS. FastFS is where QuickFS's founder now points former customers. It is a viewer rather than a data service: you plug in an API key from a separate data provider and pay that provider for the data. Fiscal.ai sells a terminal, an MCP server and an API, but publishes no price for any of them, only 7-day trials. Without data or prices of their own to compare, neither made the list.
If you want research sites that go beyond statement data, our stock analysis websites guide covers them.
Which QuickFS alternative is right for you?
- You want the QuickFS look back: Roic.ai, with its long, dense statement columns.
- You lived in Excel or Google Sheets: Wisesheets, which puts the data straight into your cells.
- You followed non-US companies: TIKR, with 92 countries from its Plus plan.
- You want a low-cost research website with long history: Stock Analysis Pro, from $6.58 a month.
- You screen and track portfolios on the same data: Stock Rover.
- You want an analyst's view next to the numbers: Morningstar Investor.
- You want about 40 years in one subscription: Yahoo Finance Gold.
- You want statements, segments and KPIs together, with export and an API: Business Quant.
Where I would move my QuickFS workflow
If you mostly read global companies on screen, a terminal-style platform will serve you well. If you did what most QuickFS users did, building a decade of a US company's financials into your own spreadsheet, I would move to Business Quant.
QuickFS closed because its supplier would not allow downloads. We have no supplier for our fundamentals, so that cannot happen to the export on Business Quant. New results also reach the site within 10 to 15 minutes of a company's release.
Before paying, open a company you modelled on QuickFS in a free account and check the last 5 years against your old spreadsheet. If the numbers match, Pro, from $29 a month, unlocks the full history and the export.
How this comparison was made
To make the list, a service had to give individual investors standardised income statements, balance sheets and cash flow statements, with ratios, for US-listed stocks, and at least 10 years of annual history on a free plan or a plan priced on the vendor's own site. That ruled out viewers with no data of their own, sales-led terminals and services without a published price, and left 9.
The account of QuickFS's closure comes from its own homepage: the notices of 3 and 4 February 2026, as archived on 19 February 2026, and the founder's note as it read on 16 October 2026. Every competitor price, plan limit and history figure was read on the vendor's own pages on 16 October 2026 and screenshotted there. Prices are each platform's lowest advertised monthly price that day, except Wisesheets, which advertises only a yearly price. The Costco figures come from our own financial statements, read the same day.
The reviews, the list and the summary table run alphabetically, with Business Quant last, and the feature table is sorted by the number of ticks, with ties broken alphabetically. We make Business Quant, one of the 9 products compared here.
Image credits. Header photograph by Tim Mossholder on Unsplash, used under the Unsplash License. Vendor screenshots were captured on 16 October 2026 from each provider's own pricing, plan or statement pages and are reproduced for comparison. The Costco illustration is our own, built from our financial statements.
Frequently asked questions
Is QuickFS shut down?
Yes. QuickFS announced on 3 February 2026 that it would close and refund Premium users' last payment. Its founder has since confirmed on quickfs.net that it will not relaunch.
Why did QuickFS shut down?
Its founder wrote on 4 February 2026 that QuickFS had been redistributing another provider's data without permission, while telling customers it came directly from company filings. That provider would not allow downloads through an API, an Excel add-in or Excel exports, the features QuickFS was known for.
Is there a free alternative to QuickFS?
Yes, several. Business Quant is free to use with no card and shows the latest 5 fiscal years and 20 quarters of statements, ratios and growth for every US-listed stock. Roic.ai showed 15 years of Apple's statements without an account, and its free API key returns 2 years. Stock Analysis and Morningstar show 5 fiscal years free, Yahoo Finance 4 and Koyfin 2.
Where can I get free financial statement data?
The original source is the SEC's EDGAR system, which is free but not standardised across companies. Standardised statements are free to view, within limits, on Business Quant (5 fiscal years and 20 quarters), Stock Analysis and Morningstar (5 years), Yahoo Finance (4 years) and Koyfin (2 years).
How do I get QuickFS-style data into Excel or Google Sheets?
Choose a service that exports statement data. Business Quant Pro, from $29 a month, exports CSV and XLSX. Stock Analysis Pro, from $6.58 a month, allows one download a day to Excel, CSV or Google Sheets. Wisesheets is an Excel and Sheets add-on from $60 a year, Roic.ai has a Google Sheets add-on that runs on its API key, and Stock Rover includes data export on every paid plan. TIKR exports on Pro, while Koyfin does not allow equity financials to be exported.