9 Best Stock Analysis Websites for 2027
Compare 9 stock analysis websites on financial history, segment data, valuation tools and price, and see exactly what each one gives you for free.

Below are 9 stock analysis websites for researching US-listed companies, with what each one costs, what it shows you for free, and what it is best at. They range from valuation specialists like Alpha Spread to data platforms like TIKR, Koyfin and Business Quant, plus the household names, Morningstar, Seeking Alpha and Yahoo Finance.
What to look for in a stock analysis website
Five things separate a website you can actually analyse a company on from one that only shows its quote.
- Financial history. How many years of statements you see free, and on a paid plan.
- Segment and KPI data. Revenue by business line and region, plus operating numbers.
- Valuation tools. A fair value, a DCF or a valuation model you can adjust.
- Screening and charting. Ways to find companies and plot their numbers over time.
- Price. What the cheapest useful plan costs and what it unlocks.
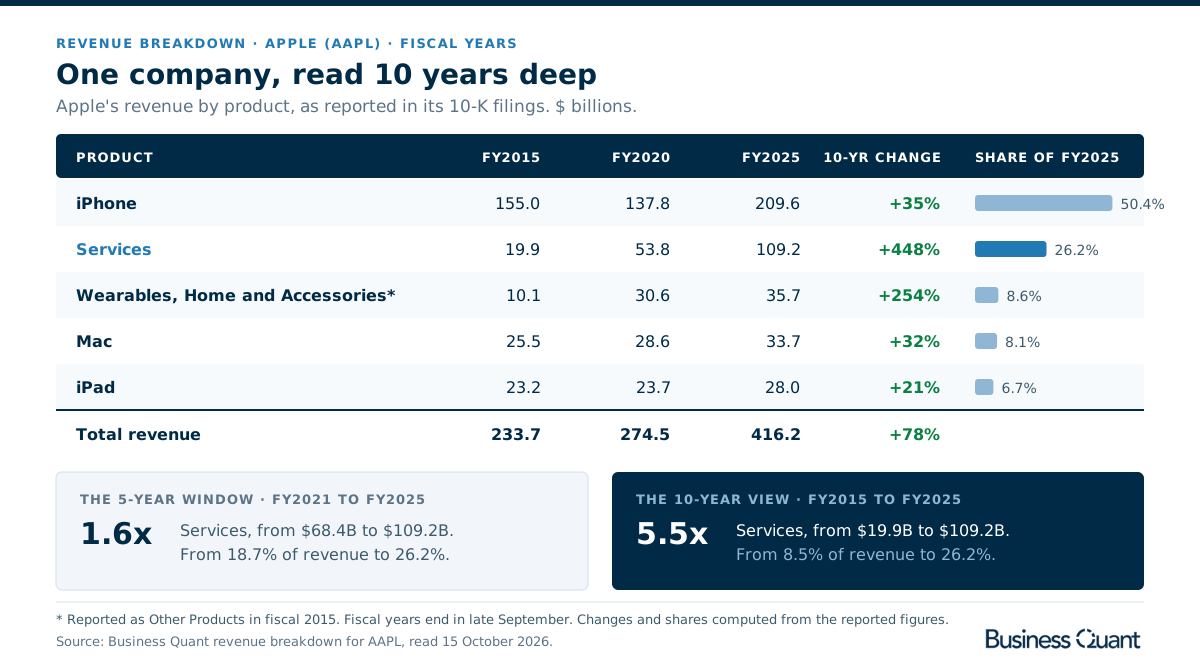
History matters more than most people expect. Most sites show 5 years of statements before asking you to pay, which is shorter than a typical business cycle. Apple shows why. Over fiscal 2021 to 2025, its Services revenue grew 1.6 times, from 18.7% of sales to 26.2%. Go back to fiscal 2015 and the same line grew 5.5 times, from 8.5% of sales, while the iPhone fell from 66.3% of revenue to 50.4%. The 10-year view also includes fiscal 2016 and 2019, 2 more years in which Apple's revenue fell. A 5-year window shows a steady company; a 10-year window shows one that changed what it is.
Segment data is the other thing a quote page rarely gives you. Total revenue tells you how big a company is; revenue by segment, product and region tells you which part of it is growing. If you plan to go back a decade or more, also check whether a site shows figures as originally reported or as restated, because companies reorganise their segments over time. How restatements and amended filings change history explains what to watch for.
The 9 stock analysis websites at a glance
- Alpha Spread
- Business Quant
- Koyfin
- Morningstar
- Seeking Alpha
- Stock Analysis
- Stock Rover
- TIKR
- Yahoo Finance
| Platform | Best for | Statements at $0 |
Deepest history |
Plans from |
|---|---|---|---|---|
| Alpha Spread | Valuation and fair value | 10 years | Not published | $12/mo |
| Business Quant | Segment revenue and company KPIs | 5 years | 20+ years | $29/mo |
| Koyfin | Dashboards and peer comparison | 2 years | 10 years | $39/mo |
| Morningstar | Analyst fair values and moat ratings | 5 years | 10 years | $20.75/mo |
| Seeking Alpha | Contributor analysis and Quant Ratings | 5 years | 10 years | $299/yr |
| Stock Analysis | Long history at a low price | 5 years | 10 to 40 years | $6.58/mo |
| Stock Rover | Deep screening and fundamentals | Not published | 20 years | $24/mo |
| TIKR | Global fundamentals at retail prices | 5 years | 30 years | $17.95/mo |
| Yahoo Finance | Quotes, news and 40 years on Gold | 4 years | ~40 years | $7.95/mo |
Scroll the table sideways for every column. Rows run alphabetically. "Statements at $0" is the number of fiscal years of annual statements shown without paying, read on Apple's statement page or in the vendor's plan grid. "Deepest history" is the most any self-serve plan offers. "Plans from" is the lowest advertised monthly price of the cheapest paid plan, or its yearly price where only that is advertised.
Stock analysis websites reviewed
Alpha Spread
A valuation platform first. Every Alpha Spread stock page leads with a Valuation tab that estimates what the company is worth, and the financial statements sit behind it as the inputs.
- Best for intrinsic value and DCF-style valuation.
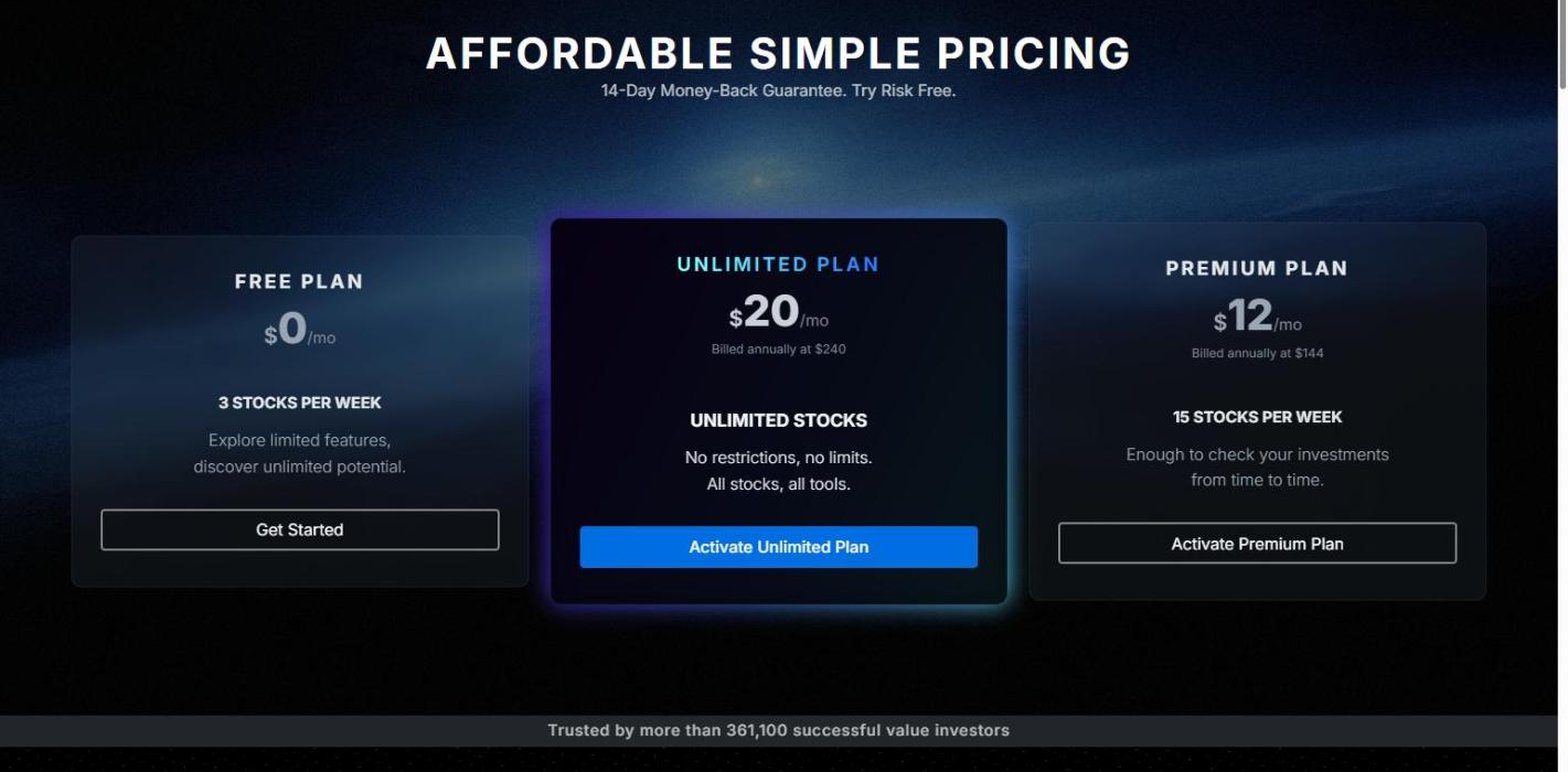
- $0 plan, 3 stock reports a week.
- Premium from $12 a month, 15 stocks a week.
- Unlimited from $20 a month, no stock limit.
- 10 fiscal years of Apple's income statement shown signed out.
- Stock screener, valuation backtest and dividend safety.
Alpha Spread showed more free history than any other site here: Apple's income statement ran from fiscal 2016 to 2025 with every value filled in. The limit is breadth, at 3 stock reports a week on the $0 plan, so it suits an investor who studies a handful of companies closely.
If you want a ready estimate of value and the numbers behind it, it is the most focused tool in this list. It does not publish how far back its paid history goes, and it has no segment revenue view.
Business Quant
A research platform built on financial data that Business Quant extracts in house from SEC filings. Each US-listed stock gets a full set of tabs, and a set of research tools sits on top for screening, charting and comparing companies.
- Best for segment revenue, company KPIs and filing-based data.
- Free to use, no card, 5 fiscal years and 20 quarters of statements.
- Pro from $29 a month, with 20+ years of statements.
- Pro also adds segment financials, KPI data, analyst estimates and data export.
- Company KPIs for about 1,700 companies, up to 40 quarters.
- Results within 10 to 15 minutes of a company's release.
- Industry-specific statements read from 10-K, 10-Q, 20-F, 40-F, 6-K and 8-K filings.
Every stock page carries the same tabs: overview, financial statements, KPIs and operating metrics, analyst estimates, dividends, revenue breakdown by segment, product and geography, peers, institutional ownership from 13F filings, insider trading from Form 4s, SEC filings and charts. Statements are read from 10-K, 10-Q, 20-F, 40-F, 6-K and 8-K filings and laid out in an industry-specific format, so a bank's statement does not look like a software company's.
The research tools cover the rest of an analysis. The stock screener filters on 818 fundamental metrics, advanced charting plots any metric or KPI over time, time series tables build custom grids of metrics across years, industry financials compare every company in an industry, and the portfolio tracker follows your holdings. There is also a market heatmap, economic data, corporate actions for splits, buybacks and dividends, an ETF and mutual fund screener and fund comparison, plus an API and an MCP server for Claude, ChatGPT and Cursor.
Because the financials come straight from the filings, the numbers on the page are the numbers the company reported, and a new quarter appears within 10 to 15 minutes of release rather than days later.
Koyfin
A market dashboard and charting platform that lets you compare a company against its peers and the market without leaving one screen. It is built for breadth of view, and history on a single company is priced by plan.
- Best for dashboards, charting and peer comparison.
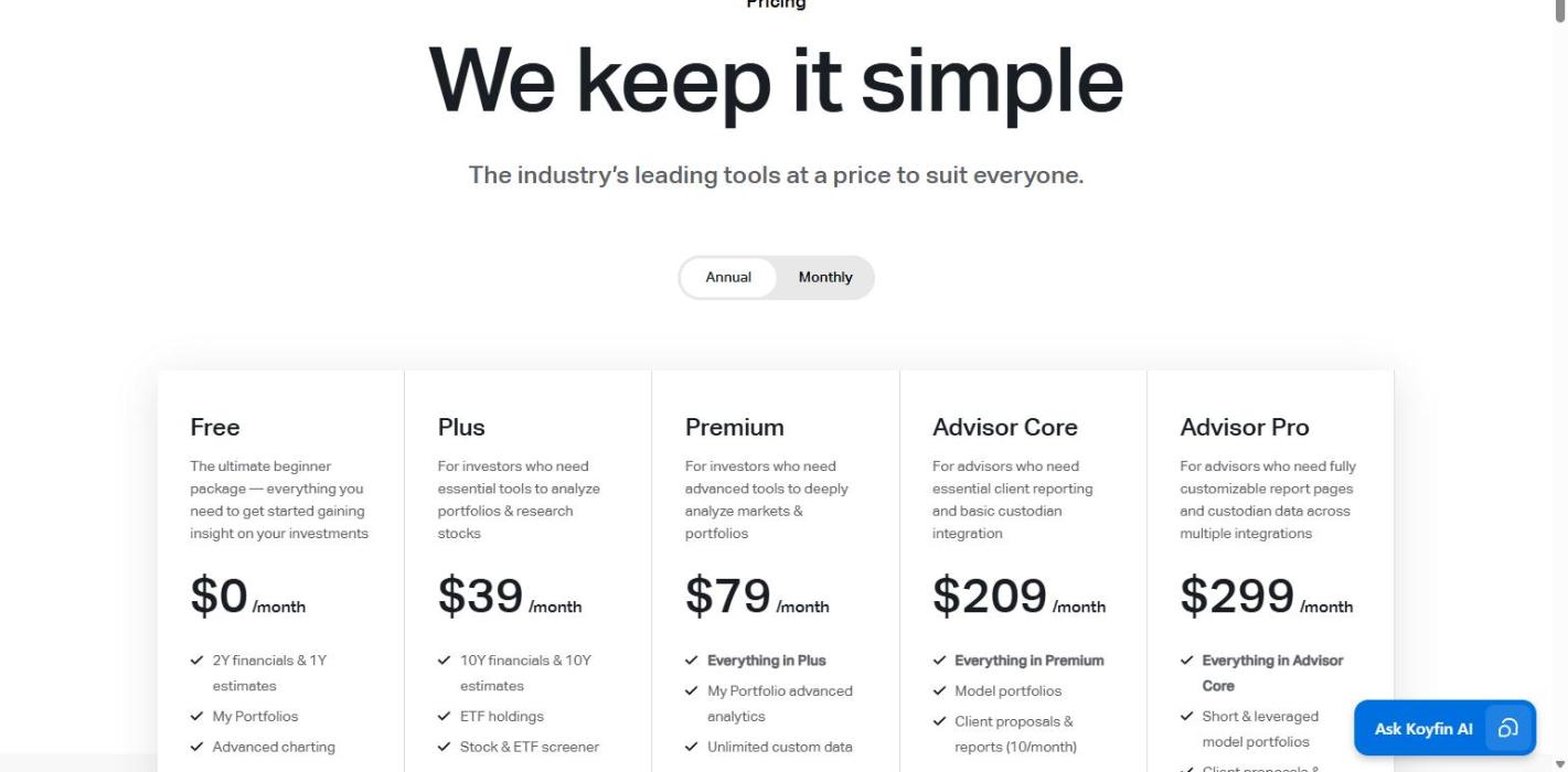
- $0 plan, 2 years and 12 quarters of financials.
- Plus $39 a month, 10 years and 40 quarters.
- Premium $79, with custom formulas and financial templates.
- Filings and transcripts from Plus.
- Estimates for the S&P 500 at $0, global on Plus.
Koyfin has the shortest free history in this list, and its first paid plan costs more than most routes to 10 years here. What Plus buys is quarterly depth: 40 quarters is double what TIKR's first paid plan carries, and quarterly data is what shows seasonality and turning points.
Its comparison grid lists no segment view and no valuation model. Choose Koyfin if your analysis starts with how a company sits against its peers and the market rather than with its own line items.
Morningstar
An investment research firm with more than 4 decades of work for individual investors. Its analysts publish a fair value estimate and an economic moat rating for the companies they cover, on the same page as the financial statements.
- Best for analyst fair values and moat ratings.
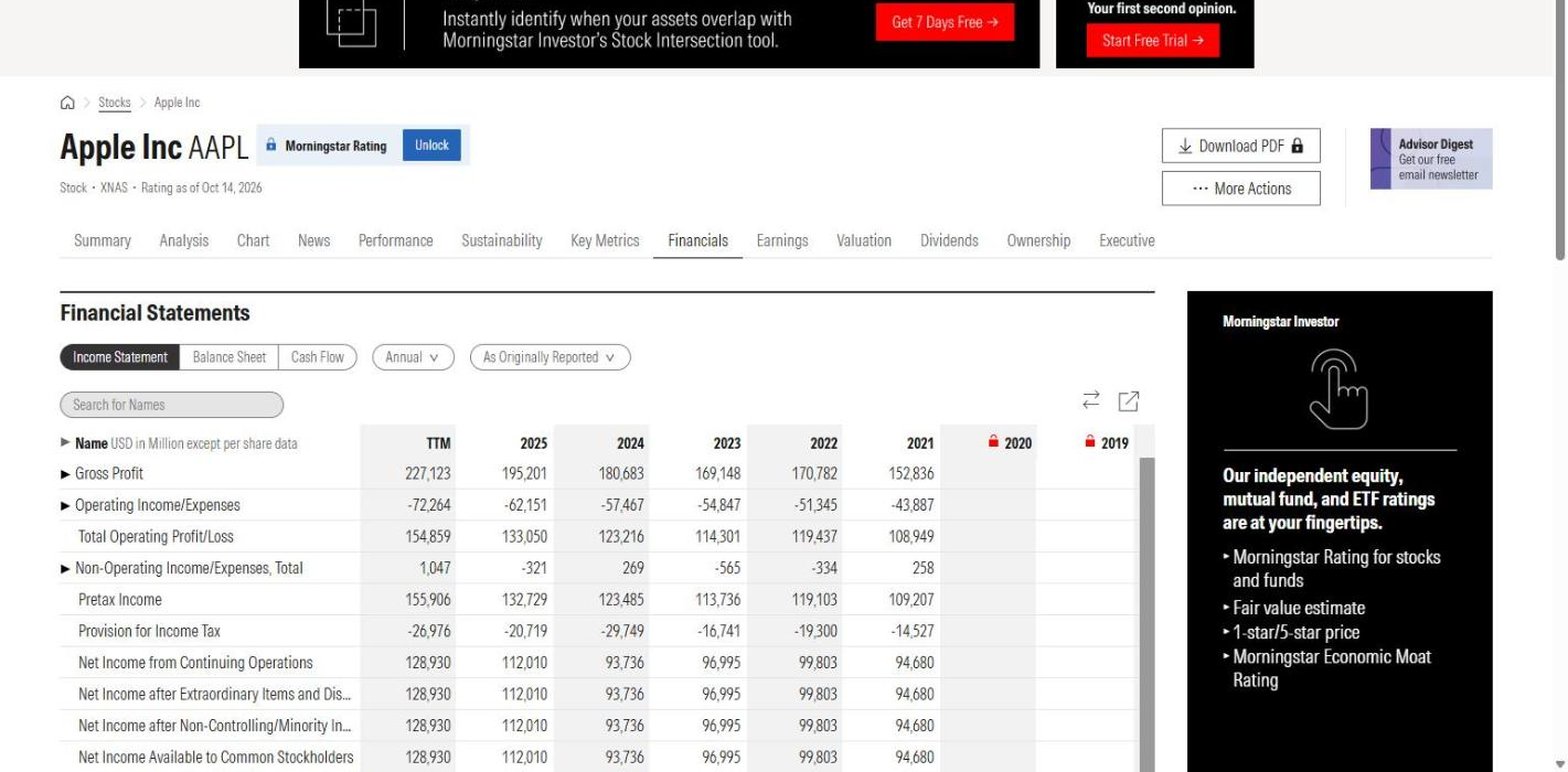
- 5 fiscal years of statements visible without paying.
- Investor from $20.75 a month, with a 7-day trial.
- 10 fiscal years once unlocked.
- Fair value estimate and economic moat rating on Investor.
- As Originally Reported view on the statements.
The As Originally Reported toggle is worth knowing about. Older years are often restated when a company reorganises its segments or changes an accounting policy, and being able to see what was reported at the time protects you from trends that only exist in restated data.
History stops at 10 years, and the centre of the product is the analyst's view: the star rating, the moat and the fair value. If you want a professional opinion next to the numbers, Morningstar publishes both under one subscription.
Seeking Alpha
An investing community with thousands of contributor articles, a Quant Rating on every covered stock, and a statements view that makes the free and paid line easy to see.
- Best for written analysis and Quant Ratings.
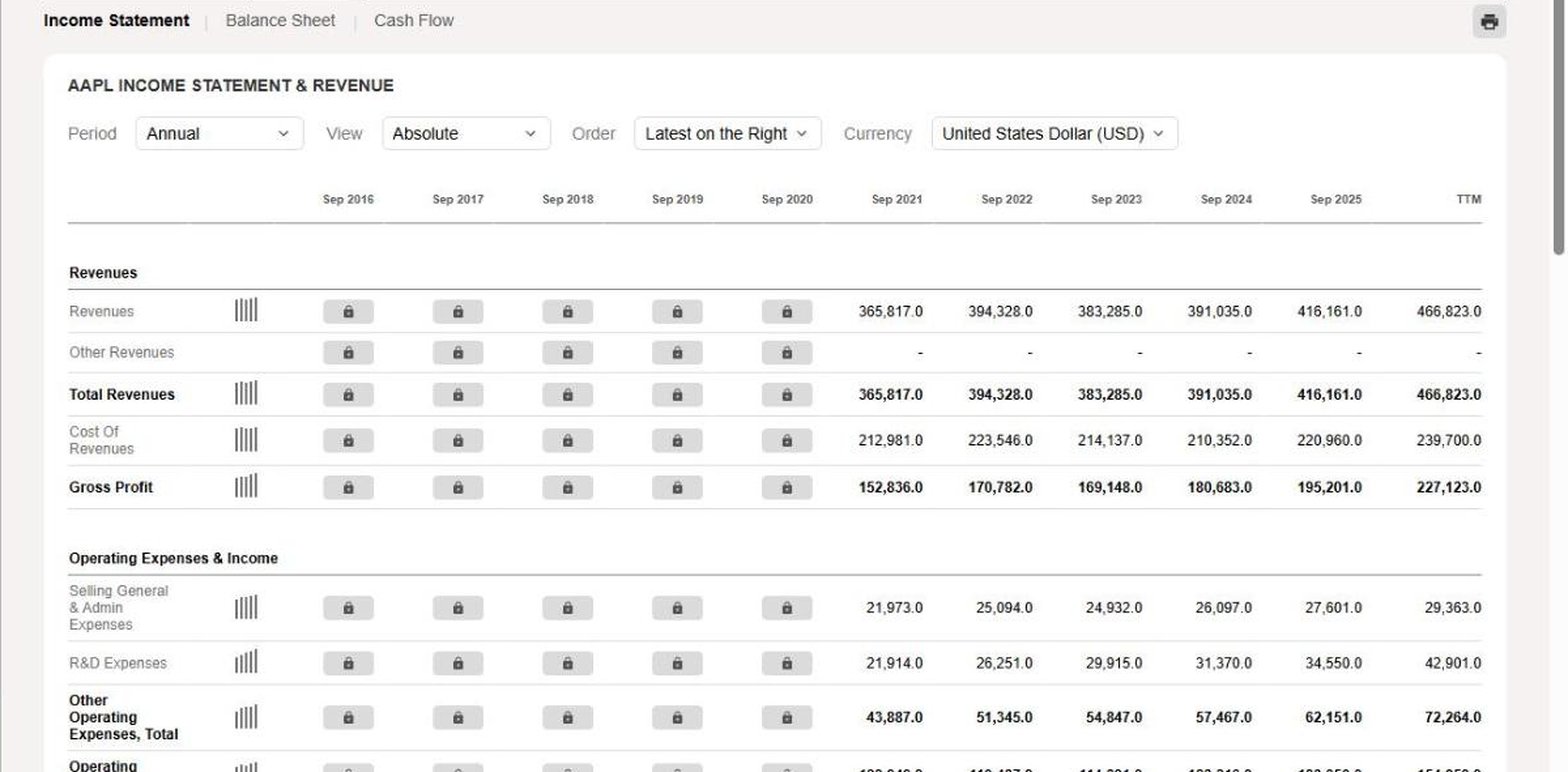
- Basic account, 5 fiscal years of statements visible.
- Premium renews at $299 a year, after $4.95 for the first month.
- PRO renews at $2,400 a year, after $99 for the first month.
- 10 fiscal years of statements on Premium.
- Valuation, growth and profitability grades per stock.
Seeking Alpha's strength is the analysis written around the numbers. Most covered companies have long contributor articles arguing both sides, and the comment threads often carry the bear case. Premium is priced by the year; the $4.95 first month is an introductory offer.
For the numbers themselves it tops out at 10 years and lists no segment view. If ratings and opinion are what you are after, our stock research websites guide compares Seeking Alpha against the other rating and research services.
Stock Analysis
The cheapest paid route to a long financial record in this list. Stock Analysis shows 5 years of every company free and puts deep history and its full business metrics behind a small fee.
- Best for long statement history on a budget.
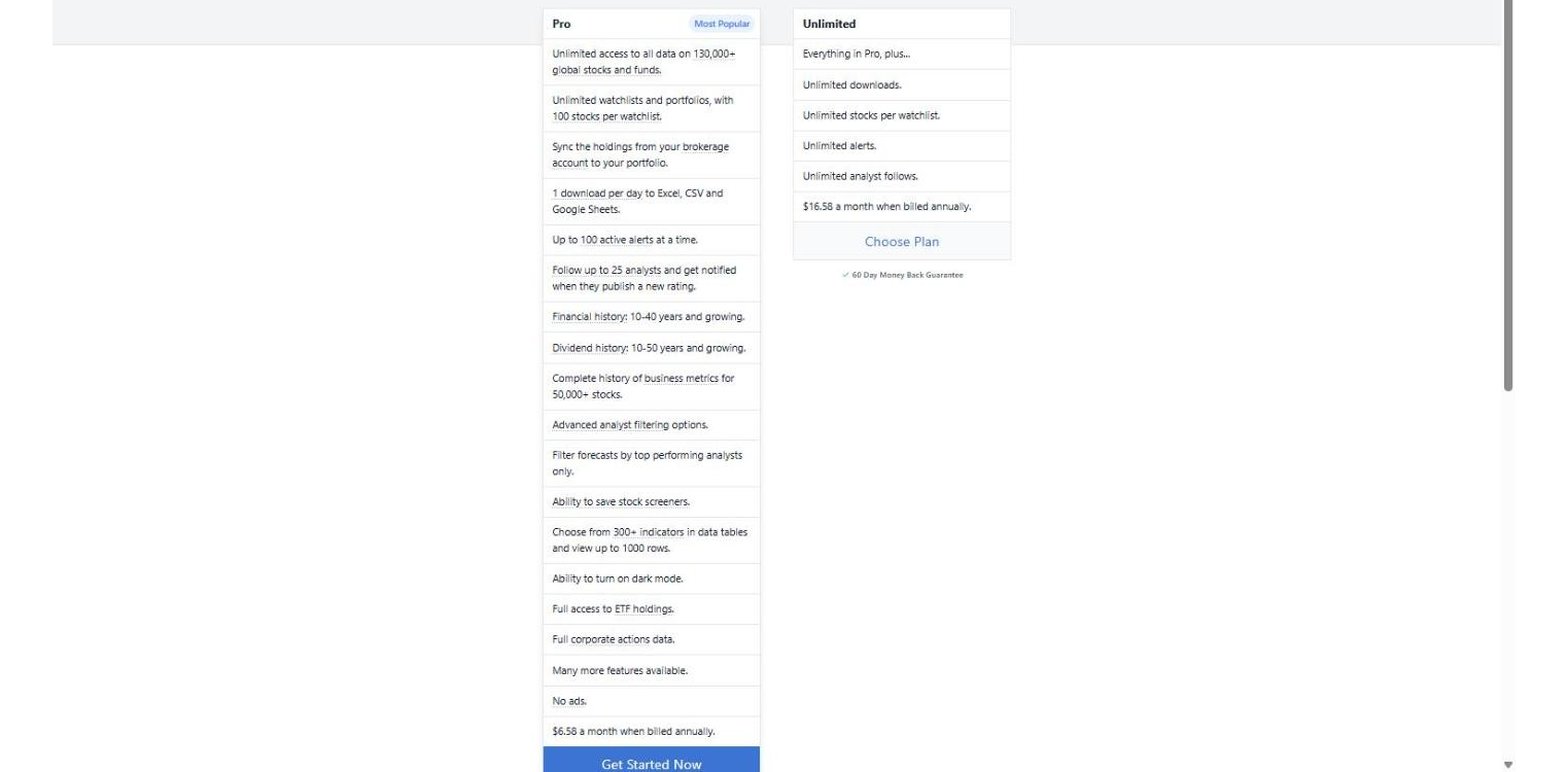
- 5 fiscal years of statements free, plus TTM.
- Pro from $6.58 a month, 10 to 40 years of history.
- Unlimited from $16.58 a month, with no download cap.
- Revenue by segment and geography, plus operating metrics.
- One download a day on Pro.
The Metrics tab is the standout. Next to the statements it carries revenue by segment, revenue by geography and company operating metrics; on Apple it showed active devices back to 2018 before older years switched to an upgrade prompt. Pro unlocks the full history for 50,000+ stocks.
Stock Analysis does not publish a valuation model of its own. It gives you the record and the ratios and leaves the conclusion to you.
Stock Rover
A research and portfolio platform for investors who like to work in tables. Its plan ladder prices history explicitly: each step up buys a stated number of years of fundamentals.
- Best for deep screening and fundamentals by plan.
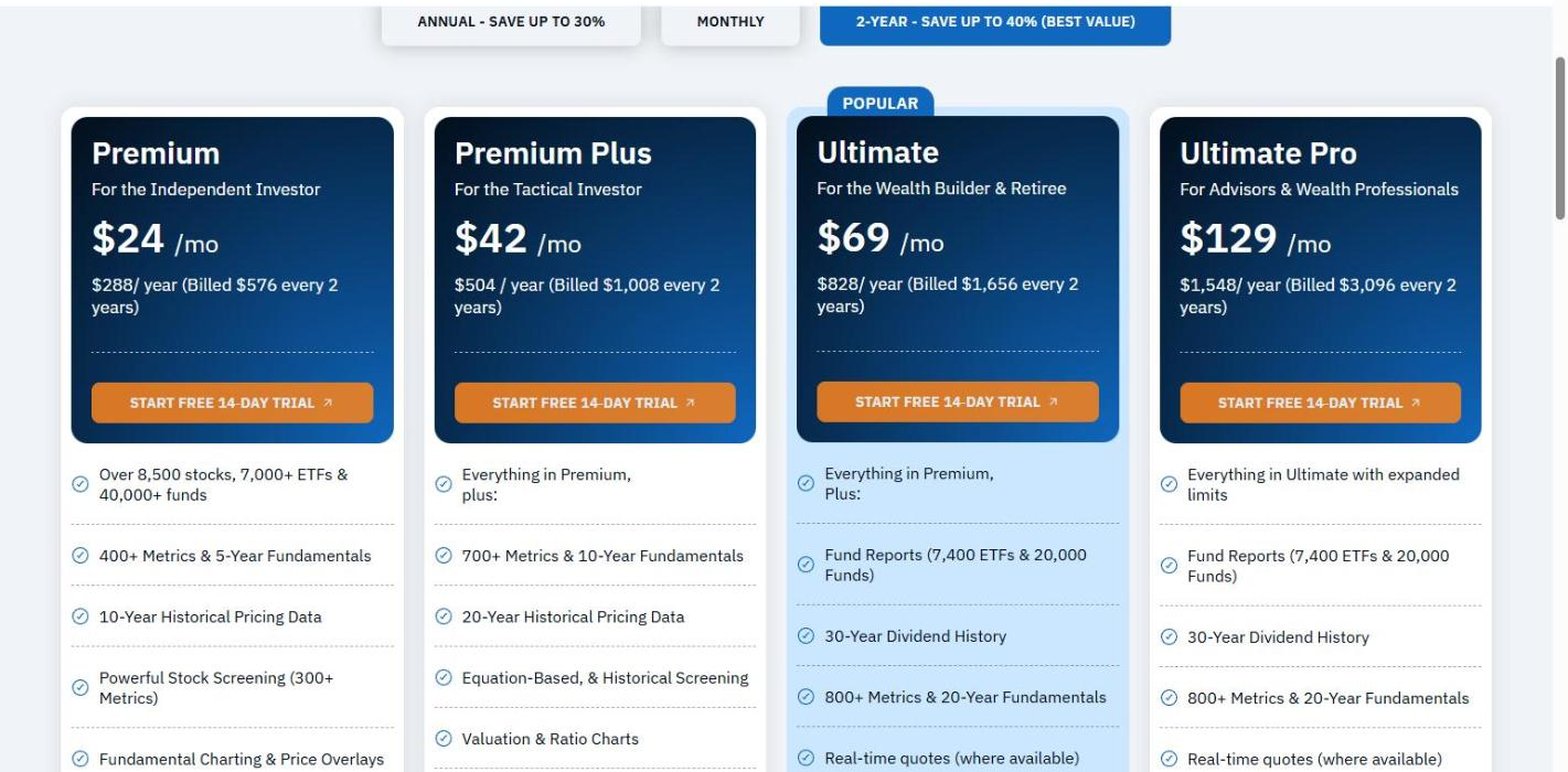
- Premium from $24 a month, 5-year fundamentals.
- Premium Plus $42, 10-year fundamentals and 700+ metrics.
- Ultimate $69, 20-year fundamentals.
- Fair value for 20 tickers a month on Premium.
- 14-day trial on every plan.
No other site here prices depth this plainly: 10 years of fundamentals costs $42 a month and 20 years costs $69. Fair value, stock scores and warnings come with every plan, capped at 20 tickers a month plus the Dow 30 on Premium and unlimited from Premium Plus.
Stock Rover also runs a free account for basic research on individual stocks, but it does not say how much statement history that account carries. Coverage is stated as 8,500+ stocks, 7,000+ ETFs and 40,000+ funds.
TIKR
A terminal-style platform that sells deep, global company data at retail prices, with a ladder from 5 years on the $0 plan to 30 years on its top plan.
- Best for global fundamentals and segment history.
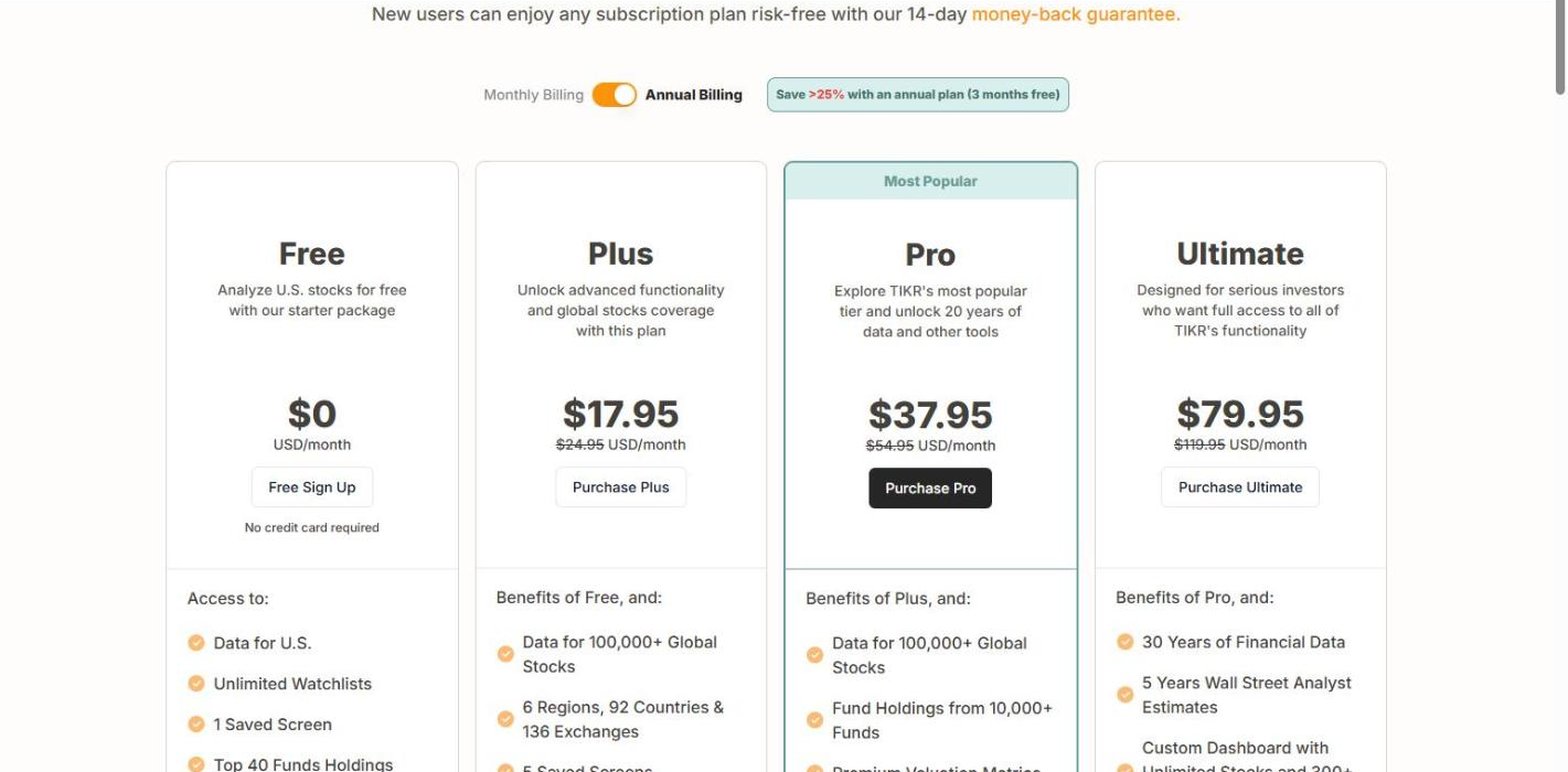
- $0 plan, US only, 5 years and 8 quarters in the plan grid.
- Plus from $17.95 a month, global, 10 years and 20 quarters.
- Pro $37.95, 40 quarters and 20 years of charting.
- Ultimate $79.95, 30 years and 40 quarters.
- Segments, estimates and valuation models, unlimited models on Ultimate.
TIKR's strength is how much it puts side by side. Its Financials tab puts the income statement, balance sheet, cash flow, ratios and segments side by side, so following a segment across years takes one click.
The $0 plan covers US companies only; global data starts on Plus. The pricing page is also inconsistent: the plan card says 3 years of financial history while the comparison grid says 5 years and 8 quarters. The table here follows the grid.
Yahoo Finance
The quote and news site most investors already use, and on its top plan the deepest statement history any site here advertises.
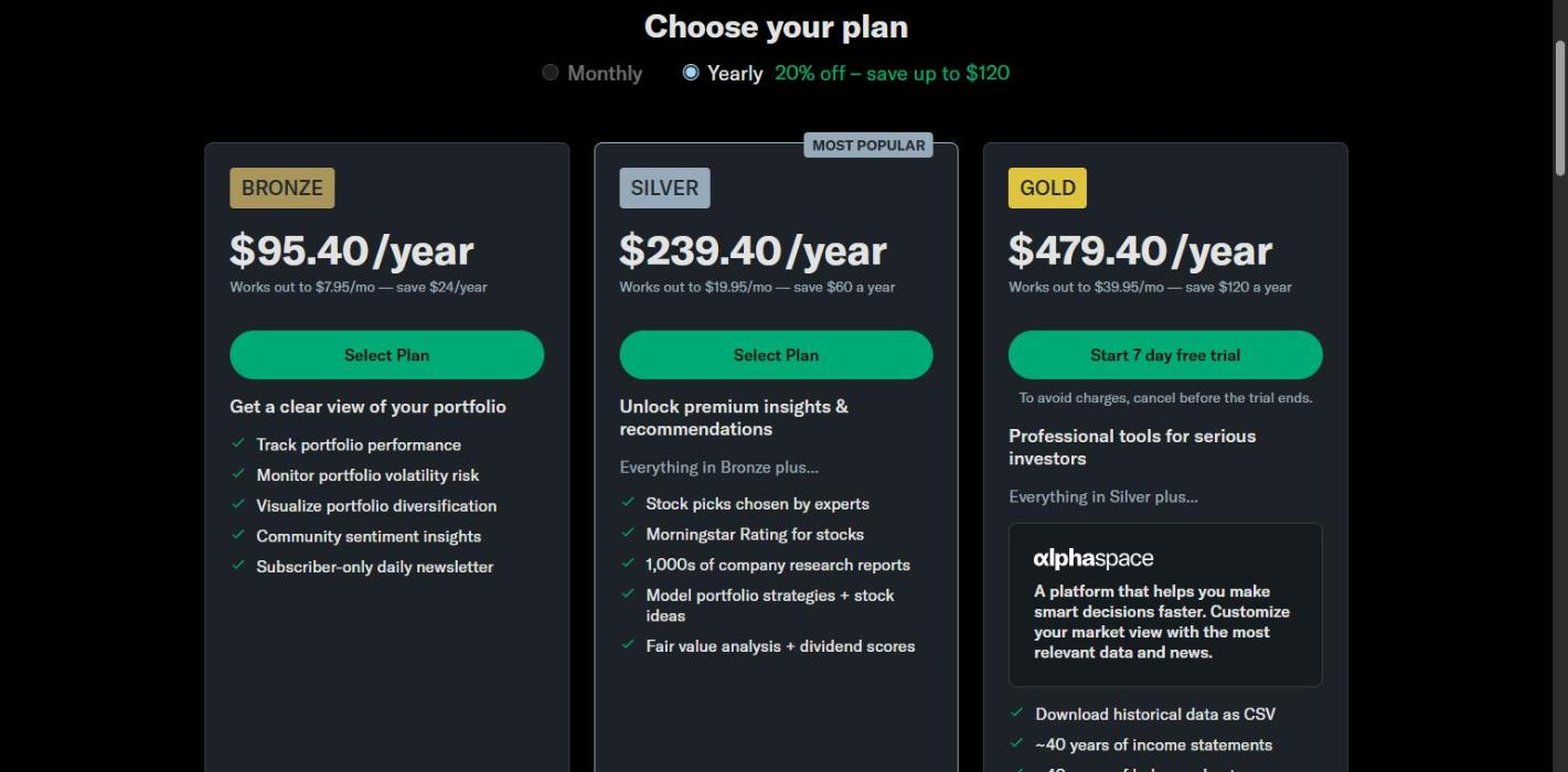
- Best for quotes, news and very long history on Gold.
- 4 fiscal years of statements free, plus TTM.
- Bronze from $7.95 a month, for portfolio tools.
- Silver $19.95, with fair value analysis and research reports.
- Gold $39.95, with ~40 years of all 3 statements and CSV download.
- 7-day trial on Gold.
The entry plan is cheap at $7.95 a month, but its card lists portfolio tools only. The long statement history appears on Gold at $39.95 a month, so that is the plan to price if decades of data is what you need.
Silver adds a fair value analysis and Morningstar's ratings, which makes Yahoo Finance one of the few sites here where a valuation view and very long history sit under one login, on different plans.
Stock analysis features compared
| Platform | 5 years at $0 |
20+ years on a plan |
Segment revenue |
Plans from |
|---|---|---|---|---|
| Business Quant | ✓ | ✓ | ✓ | $29/mo |
| Stock Analysis | ✓ | ✓ | ✓ | $6.58/mo |
| TIKR | ✓ | ✓ | ✓ | $17.95/mo |
| Alpha Spread | ✓ | ✗ | ✗ | $12/mo |
| Morningstar | ✓ | ✗ | ✗ | $20.75/mo |
| Seeking Alpha | ✓ | ✗ | ✗ | $299/yr |
| Stock Rover | ✗ | ✓ | ✗ | $24/mo |
| Yahoo Finance | ✗ | ✓ | ✗ | $7.95/mo |
| Koyfin | ✗ | ✗ | ✗ | $39/mo |
Sorted by number of ticks, ties broken alphabetically. A tick means the feature is documented on the platform's own pages or shown on its stock pages; a cross means it is not documented there. "5 years at $0" means at least 5 fiscal years of annual statements are visible without paying. "20+ years on a plan" means a self-serve plan advertises 20 or more years for at least some companies. "Segment revenue" means a documented view of revenue by business segment, product or geography.
Crosses here describe a product's focus rather than its quality. Koyfin is built to compare a company with the market, Seeking Alpha's value is the analysis written around the numbers, and Alpha Spread and Morningstar centre on a valuation rather than on the raw record.
What you get on Business Quant
Business Quant is free to use with no card. The free account opens every web feature with 5 years of financial history; Pro adds the long history and the deeper datasets.
| Feature | What it does | Plan |
|---|---|---|
| Financial statements | Income statement, balance sheet and cash flow, annual and quarterly, in industry-specific layouts | 5 years free, 20+ years on Pro |
| Revenue breakdown | Revenue by segment, product and geography | Pro, up to 15 years |
| Company KPIs | Subscribers, deliveries, store counts and other operating metrics for about 1,700 companies | Pro, up to 40 quarters |
| Analyst estimates | Forward revenue, EPS and margin consensus | Pro |
| Ownership and insiders | 13F institutional holders and Form 4 insider trades on every stock | Free to use |
| Stock screener | Filters on 818 fundamental metrics | Free to use |
| Advanced charting | Plots any metric or KPI over time across companies | Free to use |
| Time series tables | Custom tables of metrics across years | Free to use |
| Industry financials | Every company in an industry, compared | Free to use |
| Portfolio tracker | Follows your holdings and their performance | Free to use |
| ETF and fund screener | 32,727 share classes on 102 metrics | Free to use |
| Data export | CSV download from tables and the screener | Pro |
Other stock analysis sites we considered
These well-known names were checked against the same requirement, at least 10 years of a company's statements on a plan with a published price, and did not make the list.
- Finviz. 3 years of statements free and 8 on Elite.
- Simply Wall St. Plans are metered by company reports, not years of statements.
- Finbox. Statement pages need an account and the depth is not published.
- Fiscal.ai. No price published on any of its 3 products.
- ROIC.AI. Its pricing page now compares API plans.
- QuickFS. Its founder has said it will not relaunch.
- WallStreetZen. A ratings product with no published statement depth.
- FAST Graphs. Its pricing page does not state statement depth.
- StockCharts. Built for technical charting rather than company financials.
Several of these are excellent at what they do. If you are mainly looking for a screener, our stock screener comparison covers that field.
Which website I would choose
For analysing a company from its own reported numbers, I would start with Business Quant.
The reason is depth in the places a quote page is thinnest. You get the statements, the revenue split by segment, product and region, and the operating KPIs management uses to describe its own business, all on each company's page and all built from the filings. Pro, from $29 a month, takes statements back 20+ years, segments up to 15 years and KPIs up to 40 quarters, and new results land within 10 to 15 minutes of release. The free account is enough to judge whether the data works for you before you pay anything.
A simple test before you subscribe anywhere: take the largest company you own, find its biggest business line, and see how far back each site lets you follow that line's revenue for free and on its cheapest plan. The difference tells you what each subscription is really selling.
How this comparison was made
To make the list, a site had to let an individual open a US-listed company and read its income statement, balance sheet and cash flow statement, with at least 10 years of annual history available on a self-serve plan at a published price or at no cost. 9 sites met that bar.
Every price, plan limit and history figure was read on the vendor's own pricing, plan or statement pages on 15 October 2026 and screenshotted there. Prices are each platform's lowest advertised monthly price on that date. History visible without paying was read on Apple's statement page on each site, or from the vendor's plan grid where the page needs an account.
The reviews and summary table are alphabetical; the feature table is sorted by number of ticks, with ties broken alphabetically. Business Quant, which publishes this article, makes one of the 9 products compared here and is judged on the same columns. I write for Business Quant. For the same market from other angles, our stock research tools comparison looks at where each platform's data comes from, and our financial statements API comparison covers statement data for developers.
Image credits. Header photograph by Sasun Bughdaryan on Unsplash, used under the Unsplash License. Vendor screenshots were captured on 15 October 2026 from each provider's own pricing, plans or statement pages and are reproduced for comparison. The Apple illustration is a Business Quant original built from its own revenue breakdown data.
Frequently asked questions
What is the best free stock analysis website?
It depends on what you analyse. Business Quant is free to use with no card and shows the latest 5 fiscal years and 20 quarters of statements on every US-listed stock, along with its screener, charting and portfolio tools. Stock Analysis, Morningstar and Seeking Alpha also show 5 years of statements without payment. Alpha Spread showed 10 years of Apple's income statement on its $0 plan, capped at 3 stock reports a week. Koyfin's $0 plan carries 2 years of financials.
Which stock analysis website is best for fundamental analysis?
The one that goes deep enough on the numbers you rely on. For long statement history at a low price, Stock Analysis Pro is from $6.58 a month. For revenue by segment and company-specific KPIs, Business Quant and TIKR both carry a segment view, and Business Quant adds operating metrics such as subscribers, deliveries and store counts for about 1,700 companies. For an analyst's fair value next to the numbers, Morningstar Investor is from $20.75 a month.
Which websites have a stock valuation model?
Alpha Spread is built around valuation and puts a Valuation tab ahead of the statements on every stock page. Morningstar Investor carries a fair value estimate and an economic moat rating. Stock Rover includes fair value and margin of safety, capped at 20 tickers a month on Premium and unlimited from Premium Plus. TIKR sells valuation models with unlimited use on Ultimate, and Yahoo Finance lists fair value analysis on its Silver plan.
How many years of financial statements do you need to analyse a stock?
Ideally 10 or more, enough to cover a full business cycle. Over Apple's fiscal 2021 to 2025 results, Services grew 1.6 times, from 18.7% of revenue to 26.2%. Over fiscal 2015 to 2025 it grew 5.5 times, from 8.5% of revenue, and the longer view also shows the revenue declines of fiscal 2016 and 2019 that a 5-year window leaves out.
What is the cheapest way to see 10 years of a company's financials?
Alpha Spread showed 10 fiscal years at no cost on its statements page. Among paid plans, Stock Analysis Pro is the cheapest, from $6.58 a month, advertising 10 to 40 years of financial history. TIKR Plus reaches 10 years from $17.95 a month, Morningstar Investor from $20.75, Seeking Alpha Premium at $299 a year, Koyfin Plus from $39 a month and Stock Rover Premium Plus from $42 a month. Business Quant Pro, from $29 a month, carries 20+ years of statements.