9 Industry Classification Systems Compared
9 systems will tell you what industry a company belongs to. Which one describes the company you actually own?


Think of the biggest company you follow, then file it under one industry and only one. Whatever you picked, you have just deleted most of that company, and 7 of the 9 systems here make you do the same thing. This compares all 9 on what they classify, how deep they go, what they cost, and what each does with a company that runs 5 businesses. Business Quant maintains one of them and it is measured in the same tables as the other 8.
The 60% rule
You do not have to take my word for what single assignment costs, because the sharpest example of it was published by a scheme owner, about the most watched retailer on earth, in its own methodology document.
GICS uses Amazon to show how its central rule works, and the fiscal 2022 split is the one it prints. Online stores were 43% of sales, third-party seller services 23%, physical stores 4%. Those 3 lines total 70%, which clears the 60% threshold the rule requires, so the entire company resolves to sub-industry 25503030, Broadline Retail, inside Consumer Discretionary. Amazon Web Services was 16% of sales. Advertising was 7%. Subscriptions were 7%. None of it appears anywhere in the classification.
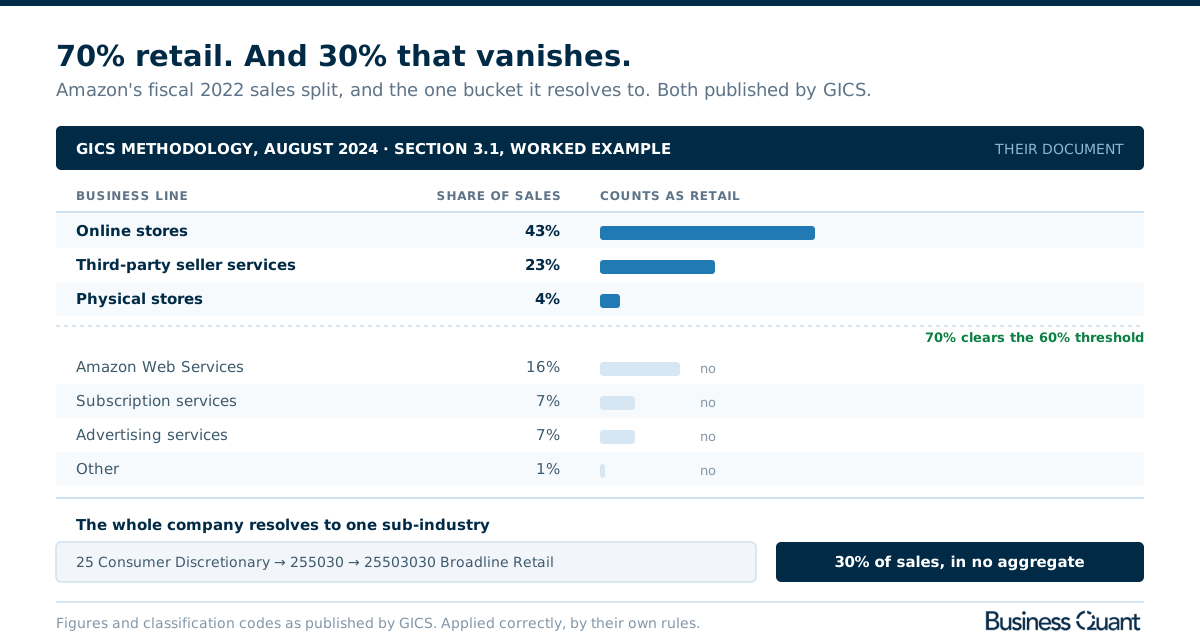
Nothing went wrong there. GICS applied its own rule correctly and then published the working so anyone could check it, which is more than most schemes do. The rule itself is one sentence: a company is assigned to the sub-industry covering whichever activities generate more than 60% of its revenue, and where nothing clears 60% the assignment follows wherever the majority of both revenue and earnings converge, with market perception as a third consideration. The methodology calls the system "strictly hierarchical", which is the formal way of saying a company belongs to exactly one grouping at each of the 4 levels.
Single assignment is a requirement, not a shortcut, and it is worth understanding why before treating it as a flaw. These schemes exist so an index provider can compare a portfolio in Tokyo against a portfolio in Chicago, and a benchmark whose sector weights sum to more than 100% is not a benchmark. The moment a company is allowed into 2 sectors, every aggregate built on top has to decide how to split it and every user has to agree with the split. One bucket per company is what makes the arithmetic close.
The cost falls on the largest companies in the market, which are precisely the ones running several real businesses at once. That is the trade. Make it deliberately rather than by default.
GICS is unusually candid about its own edges, which is worth saying plainly. 78 of its 163 sub-industries carry an exclusion statement naming what does not belong there and where that activity goes instead. Oil spill remediation, for instance, is excluded from Oil & Gas Equipment & Services and redirected to Environmental & Facilities Services. Statements like that are what make 2 analysts reach the same answer about the same company.
Establishments or companies
There is a second split that decides more than the level counts do, and it explains why 2 of these systems behave in ways that look like faults until you know what they were built for.
SIC and NAICS do not classify companies at all. They classify establishments, meaning a single site or facility, and they group them by production process: what gets made, with which inputs and which equipment. That is the correct unit for measuring an economy and the wrong unit for looking at a stock. A diversified group is not one classified entity under NAICS. It is a scatter of establishment codes with no company sitting above them.
The 2022 NAICS revision shows what that orientation costs an investor. It cut the code count from 1,057 to 1,012, largely by merging online retailers into their physical-store counterparts. On a production-process view that is defensible, since both sell similar goods in similar ways. On an investing view, the difference between an e-commerce business and a store estate is close to the entire question, and NAICS no longer preserves it.
None of which makes SIC useless. It is EDGAR's default classification filter, which means it is the cheapest way to narrow roughly 35,000 filers down to something workable, and if you are pulling those filings programmatically the SEC filings API comparison covers the endpoints that expose it. Just do not ask it what a company does.
The field in one table
| Standard | Owner | Levels | Industries covered |
Structure last revised |
|---|---|---|---|---|
| BQ-MICS | Business Quant | 3 | 288 industries | 2026 |
| FactSet RBICS | FactSet | 6 | ~1,400 sector groups | Continuous |
| Bloomberg BICS | Bloomberg | Up to 7 | Not published | 2024 |
| GICS | S&P Dow Jones Indices and MSCI | 4 | 163 sub-industries | 2023 |
| NAICS | US, Canada and Mexico | 5 | 1,012 industries | 2022 |
| TRBC | LSEG | 5 | 898 activities | 2020 |
| ICB | FTSE Russell, part of LSEG | 4 | 173 subsectors | 2019 |
| Morningstar | Morningstar | 4 | 145 industries | 2019 |
| SIC | US SEC working subset | 1 | 444 codes | 1987 |
Scroll the table sideways for every column. Rows run newest structure first, with the continuously maintained scheme placed after the most recent dated revision. Industries covered is the deepest published level of each taxonomy and is not a measure of quality. A deeper scheme that still permits only one assignment per company is being more precise about one business, not about the company.
The 9 in detail
SIC (Standard Industrial Classification)
The oldest scheme in active use, and the story of how it survived is the story of institutional inertia doing something useful by accident. A committee convened by the Central Statistical Board in the 1930s published a manufacturing list in 1938 and a non-manufacturing list in 1939. Those became the Standard Industrial Classification. It was revised on and off for 50 years, and the 1987 edition is the last one there will ever be. By 1992 the Office of Management and Budget had already convened the committee that would build its replacement.
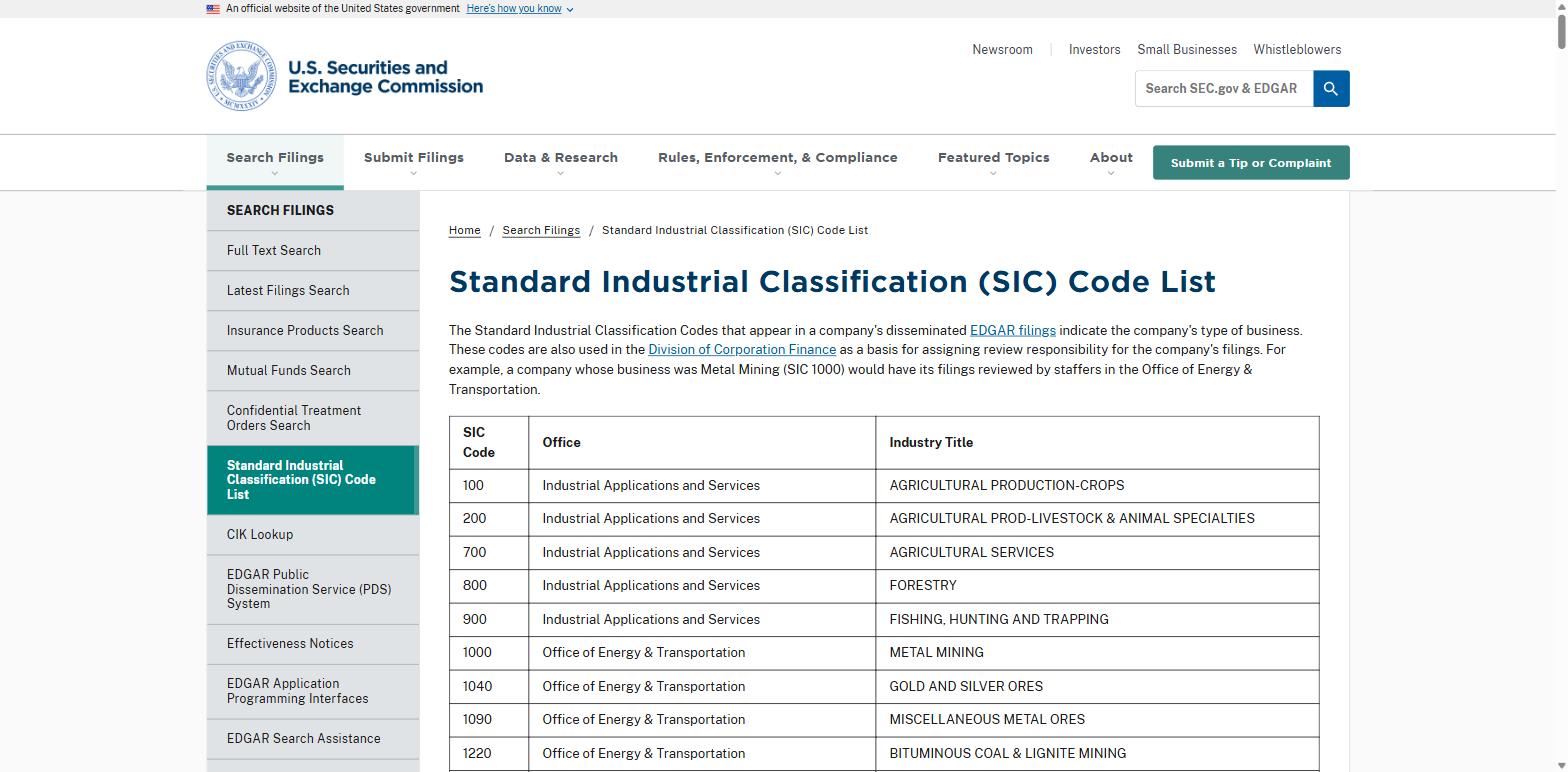
- 444 codes in the SEC's working subset, counted from the SEC's own published list rather than taken from a roundup.
- One 4-digit code per filer, assigned at SEC registration and rarely revisited as the business changes underneath it.
- Public domain. No licence, no fee, no attribution requirement.
- Still EDGAR's default classification filter, which is the entire reason it remains relevant 39 years after its last revision.
The consequence of the 1987 freeze is easy to state and hard to overstate. SIC has a code for photofinishing laboratories and nothing that meaningfully describes cloud computing, streaming subscriptions or platform advertising. Treat it as an administrative filter over a large pile of filers, which it is genuinely good at, and never as a description of what a company does.
NAICS (North American Industry Classification System)
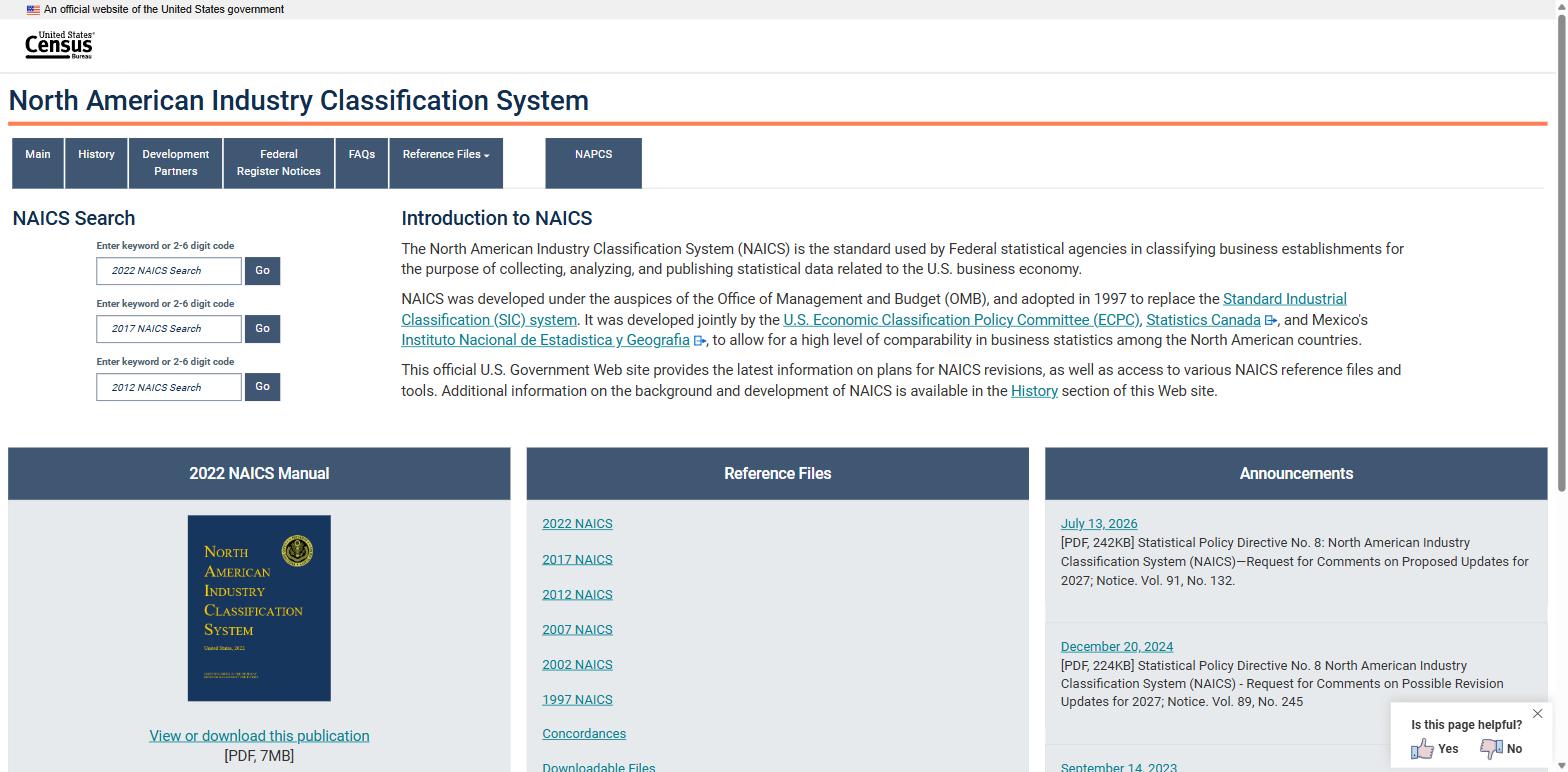
SIC's designated successor, built jointly by the statistical agencies of the United States, Canada and Mexico under the Office of Management and Budget after the 1992 review, and adopted in 1997 so economic statistics could be compared across all 3 countries.
- 5 levels: 20 sectors, 96 subsectors, 308 industry groups, 689 industries and 1,012 six-digit national industries.
- Revised on a 5-year cycle, 6 times so far: 1997, 2002, 2007, 2012, 2017 and 2022.
- The 2022 revision cut codes from 1,057 to 1,012, mostly by merging online retailers into their physical-store equivalents.
- Public domain, with the complete manual published by the US Census Bureau.
This is the deepest free taxonomy in this comparison by a wide margin, and it is maintained properly on a published schedule. The catch is the unit. Because NAICS classifies establishments rather than companies, a diversified corporate group appears as a spread of establishment codes and never as a classified entity, which is exactly the shape an investor cannot use.
GICS (Global Industry Classification Standard)
Developed jointly by Standard & Poor's and MSCI in 1999 and still jointly owned today, GICS was built to solve a specific problem: index providers needed sector definitions that meant the same thing in every market they covered, so global portfolios could be compared without an argument about definitions first.
- 4 levels: 11 sectors, 25 industry groups, 74 industries and 163 sub-industries.
- The 60% revenue rule, with earnings and market perception as second and third considerations where revenue alone does not settle it.
- Exclusion statements on 78 of the 163 sub-industries, each naming what is excluded and where that activity is classified instead.
- The structure moves. Current version effective 17 March 2023.
- Licensed through GICS Direct. No price published.
The structure is not fixed. Real Estate was promoted out of Financials in 2016, and Communication Services replaced Telecommunication Services in 2018, absorbing the internet and media platforms with it. The methodology document itself is public, detailed and readable, which is unusual in this market and genuinely worth an hour if you work with sector data at all. It is also where the Amazon example at the top of this page comes from.
ICB (Industry Classification Benchmark)
Launched in 2005 as a joint venture between Dow Jones and FTSE, built to solve the same benchmarking problem as GICS and in direct competition with it. FTSE later bought out the Dow Jones stake, and ICB now sits inside FTSE Russell, part of the London Stock Exchange Group.
- 4 levels: 11 industries, 20 supersectors, 45 sectors and 173 subsectors.
- ICB 2019 version 2, in effect since 1 July 2019.
- Merged with Russell Global Sectors in 2019, adding 57 subsectors.
- Adopted by exchanges directly, Abu Dhabi in 2022.
- Licensed, with no price published by the owner.
ICB and GICS solve an identical problem with near-identical structures: 4 levels each, one assignment per company each, no published price for either. So the choice between them is almost never about the taxonomy. It is decided by which benchmark family your reporting already reconciles against, and that decision was usually made years before anyone opened a methodology document.
TRBC (The Refinitiv Business Classification)
The most renamed scheme in this comparison, and each rename marks an acquisition. It began in 2004 as the Reuters Business Sector Scheme, became the Thomson Reuters Business Classification in 2008 when Thomson bought Reuters, and became The Refinitiv Business Classification in 2020. Refinitiv was then acquired by the London Stock Exchange Group, which means LSEG now owns 2 competing classification standards at the same time.
- 5 levels rather than 4: 10 economic sectors, 33 business sectors, 62 industry groups, 154 industries and 898 activities.
- The Activities level arrived in the 2012 generation and is the main reason organisations migrate here from a 4-level scheme.
- 4 generations under 3 different names since 2004.
- Licensed inside LSEG data products. No price published.
898 activities is the deepest bottom tier of any index-linked scheme here, roughly 5 times GICS at the equivalent level. If your work needs to separate businesses that GICS and ICB place together, this is the scheme built for that, and it is the reason people move.
Bloomberg BICS (Bloomberg Industry Classification System)
Built by Bloomberg for the Terminal and for Bloomberg's own index families. That origin shows in the design: where GICS and ICB were built by index houses for cross-benchmark comparability, BICS was built by a data vendor for analysts working on its screens, and it groups issuers by shared activities and business drivers rather than by production process.
- Up to 7 levels, the deepest hierarchy here by level count, with every classified company assigned to at least level 4.
- 11 level-1 sectors, matching the sector groupings the market already thinks in.
- More than 60,000 listed equities covered.
- Equities and fixed income issuers on the same hierarchy, which is a genuinely distinctive feature in this set.
- Revised continuously, last on 19 April 2024.
That revision cadence is the thing to notice. The April 2024 pass added segments for electric vehicle charging equipment and crypto investment companies. A scheme that adds a segment for EV charging when EV charging becomes a real public business is tracking the market rather than waiting for a 5-year review, and it is the clearest contrast on this page with a taxonomy frozen in 1987. Distribution runs through Bloomberg data licensing, and use outside the Terminal environment requires a separate arrangement.
Morningstar Global Equity Classification
Built and maintained by Morningstar, which has rated funds since 1984, and the classification exists to serve that business. Describing a fund's sector exposure accurately requires a company-level industry definition that holds across every holding in the fund, so Morningstar built one. The current structure replaced an earlier scheme on 15 October 2010 and was revised again in 2019.
- A tier no other scheme here has: 3 super sectors, Cyclical, Defensive and Sensitive, sitting above the sectors.
- Then the familiar shape: 11 sectors, 55 industry groups and 145 industries.
- Assigned on the largest source of revenue and income, with business descriptions, company assets and named competitors weighed where revenue alone does not resolve it.
- An explicit Conglomerates rule for companies with no dominant stream.
- The structure document is public. The company mappings are licensed, with no price published.
The super sector tier is the most interesting idea in this comparison. Grouping the market by economic sensitivity rather than by activity is a genuinely different lens, and no other scheme here attempts it. The Conglomerates rule is the honest counterpart: it is what single assignment looks like when a scheme admits out loud that some companies defeat it, and 9 of the 145 industries carry exclusion language of the kind GICS applies more widely.
FactSet RBICS (Revere Business and Industry Classification System)
This one started outside FactSet, at Revere Data in San Francisco, which spent years building a hierarchy from the bottom up by mapping companies to the specific products and services they sell rather than starting from top-down market groupings. FactSet acquired the Revere assets in September 2013 for $15.4 million and has developed the system since, keeping the patented Revere hierarchy at the lower levels and layering conventional market groupings on top.
- A 14-by-6 structure, roughly 1,400 sector groups.
- RBICS Focus assigns roughly 48,000 companies to the single lowest-level sector generating 50% or more of revenue.
- RBICS with Revenue is the multi-sector product, covering roughly 46,000 companies by distributing reported segment revenue percentages across the taxonomy.
- RBICS with Tradenames maps roughly 48,000 companies at tradename level, where one tradename can appear across several sectors.
- RBICS Extended Universe reaches more than 3 million public and private companies at 4 levels of depth.
- Maintained continuously as new filings arrive, with Focus refreshed monthly and classification history back to 2003.
RBICS with Revenue is one of only 2 products in this comparison that puts a company in more than one industry, and its method is the more rigorous-sounding of the 2: it takes the revenue percentages a company itself attaches to its reported segments and distributes them across the taxonomy. That is a measured allocation rather than a judged one, which is a real advantage.
It is also bounded by something outside FactSet's control, and the boundary is worth knowing before you rely on it. Segment reporting reflects how management internally organises the business, and carries no requirement to resemble an industry breakdown. Apple's own 10-K says so directly: "The Company manages its business primarily on a geographic basis. The Company's reportable segments consist of the Americas, Europe, Greater China, Japan and Rest of Asia Pacific." All 5 are geographies. For the largest filer in the index there is no industry-shaped segment data to distribute, even though the same 10-K discusses payment services, advertising and original video content in its narrative disclosures.
BQ-MICS (Business Quant Multi-Industry Classification System)
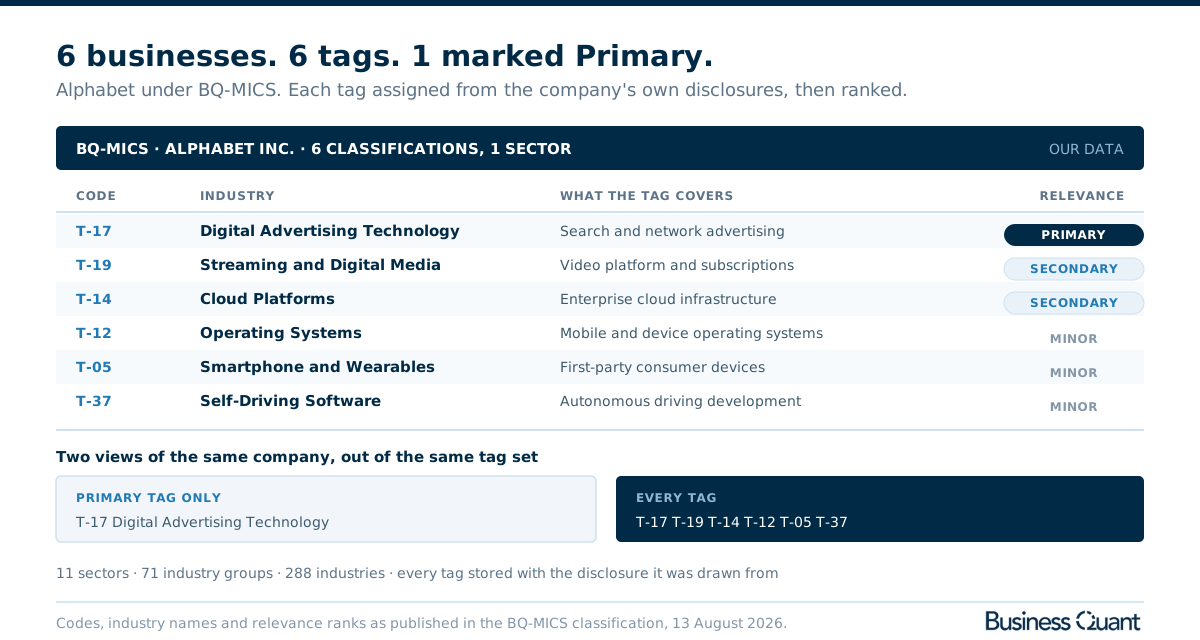
Built in-house by the Business Quant equity research team to answer the question the Amazon example raises, which is what to do about a company that runs 5 businesses when the taxonomy has room for one. BQ-MICS tags every industry a company can be evidenced to operate in, and marks exactly one of those tags Primary.
- 3 levels: 11 sectors, 71 industry groups and 288 industries, with fixed-format codes so an industry can be renamed without breaking anything downstream.
- Every tag ranked Primary, Secondary or Minor, so exposure can be weighted by how central a business is to the company rather than treated as binary.
- Classified from the company's own disclosures, not reported segments.
- A boundary statement on every one of the 288 industries.
- The reasoning is stored with the data, citing the disclosure behind each tag.
- Keyed to SEC CIK, so delisted and renamed companies keep their classification.
- $2,000 a year internal, $5,000 a year for display or redistribution.
The scope worth stating up front: coverage is US-listed equities only, which is narrower than every other scheme on this page, and at 3 levels the structure is not the deepest here either. That second one is a direct trade rather than an omission. Depth under a single-assignment rule buys precision about one business; breadth of tagging buys visibility across all of them, at a shallower level of granularity within each. The classification also travels with the rest of the data, so a holdings roll-up or a screen carries it automatically, in the same way the numbers do in the financial statements API comparison.
Where the schemes diverge
4 questions separate this field once you get past the level counts, and each one changes what you can do with the data rather than how it looks.
| Standard | Company as the unit |
Global coverage |
More than 1 industry |
Revised since 2020 |
Price from |
|---|---|---|---|---|---|
| FactSet RBICS | ✓ | ✓ | ✓ | ✓ | On request |
| TRBC | ✓ | ✓ | ✗ | ✓ | On request |
| BQ-MICS | ✓ | ✗ | ✓ | ✓ | $2,000/yr |
| GICS | ✓ | ✓ | ✗ | ✓ | On request |
| Bloomberg BICS | ✓ | ✓ | ✗ | ✓ | On request |
| ICB | ✓ | ✓ | ✗ | ✗ | On request |
| Morningstar | ✓ | ✓ | ✗ | ✗ | On request |
| NAICS | ✗ | ✗ | ✗ | ✓ | $0 |
| SIC | ✗ | ✗ | ✗ | ✗ | $0 |
Ordered by ticks, then by the finest published tier where 2 schemes tie. A tick means the capability is documented in the scheme owner's own published material. A cross means it is absent from that material or outside the scheme's stated scope, not that it is impossible to work around. Global coverage crosses for the 2 government schemes because they cover North America, and for BQ-MICS because it covers US-listed equities. Prices are the published annual figure where one exists.
2 of those columns need a word before you read the crosses as verdicts. A price on request is normal in this market rather than evasive: 6 of the 9 sell through a data agreement, and the number you would pay depends on seats, delivery and whether the classification reaches your own users. And a scheme not revised since 2020 is not neglected. It means the structure has held, which is exactly what a benchmark is supposed to do. Read that column as a question about how quickly new business models get a home, not as a maintenance score.
What BQ-MICS gives you
The point of BQ-MICS is that a company is not made to pick a lane. Every business it runs is recorded, so a diversified company is described rather than filed under a label that fits none of it, and the single-industry view is still there whenever the work needs one.
| What you want | How you get it |
|---|---|
| Every industry a company operates in | A tag for each, not just the largest |
| A conglomerate described, not just labelled | 6 businesses means 6 tags, each evidenced separately |
| Peer sets that include the smaller businesses | Screen across all tags, not just Primary |
| Exposure weighted by how central a business is | The Primary, Secondary and Minor ranks |
| A single-industry view when you need one | Filter to the Primary tag, which every company has |
| Industry aggregates that do not double count | Aggregate on Primary tags only |
| The evidence behind a classification | The recorded reasoning and the disclosure it cites |
| What does not belong in an industry | The boundary statement on each of the 288 |
| A classification that survives a ticker change | Mappings keyed to SEC CIK |
| Historical industry aggregates | Delisted and acquired companies are retained |
| Use inside a product you ship | The display and redistribution licence |
The standard I would pick
If your work is index construction or reporting against a benchmark, the choice was made for you by whatever your reporting reconciles against, and no comparison page changes that. Single assignment is the point of those schemes, not a defect in them.
For everything else, which covers most equity research, I would use BQ-MICS.
The argument is the one the opening example makes on my behalf. A company that runs 5 businesses has 5 businesses whether or not the taxonomy has room for them, and the questions worth asking about a large company tend to live in the part that gets dropped. BQ-MICS tags each of those businesses, ranks every tag by how central it is, and keeps exactly one Primary tag on every company, so a clean single-industry cut of the market is always available. You get the narrow view and the whole-company view out of one dataset instead of choosing between them at purchase time.
3 specifics sit behind that, and each is checkable against what this page has already stated. Tags come from what a company says about its own operations in its filings and investor materials, so a company reporting along geographic lines still gets classified on what it actually does. Every tag is stored with the reasoning and the disclosure it came from, which turns a classification you disagree with into an argument you can have with evidence. And all 288 industries carry a boundary statement naming what belongs elsewhere and where, which is the machinery that makes 2 analysts land in the same place.
The limits, in the same breath: US-listed equities only, 3 levels rather than 6, $2,000 a year for internal use and $5,000 where it reaches your own users.
Here is the 10-minute test I would run before paying anyone, including us. Take your 3 largest holdings and write down every business each one genuinely operates. Then count how many of those appear in a provider's classification of that company. The BQ-MICS methodology and all 288 industry definitions are published in full and cost nothing to read, so you can run that test against it this afternoon and see the answer before you talk to anybody.
How this comparison was made
One test set the roster: a published classification scheme in active use for sorting companies or business establishments into economic categories, with a published structure. All 9 that met it are here and none was held back.
Structural figures were read from each scheme owner's own published methodology on 13 August 2026 rather than lifted from other roundups, and the BQ-MICS counts were read from the live classification page on the same day because they are derived from the sector table and move as the taxonomy is reviewed. Where an owner publishes no price, the table says so instead of carrying an estimate.
3 orderings are used, each by a stated rule so you can check it. The summary table runs newest structure first, which puts a taxonomy revised this year at the top and one frozen in 1987 at the bottom. The reviews and the bullet list run by unit and then by assignment rule, which puts the establishment-level schemes first and Business Quant last. The capability table runs by tick count with ties broken by the deepest published tier, which puts FactSet RBICS first and Business Quant third. Business Quant makes one of these 9 systems and it is measured on the same 4 questions as the other 8, including the coverage question it does not win.
Image credits. Diagrams are Business Quant originals. Figures in them are as published by GICS and by the BQ-MICS classification, read on 13 August 2026.
Frequently asked questions
Is BQ-MICS free to use?
The methodology and all 288 industry definitions are published and cost nothing to read, so the taxonomy can be evaluated in full before any money changes hands. The company mappings are the licensed part, at $2,000 a year for internal research and $5,000 a year where the classification is shown to your own users or redistributed. Both figures are published, which puts BQ-MICS in a minority here: 6 of the 9 systems quote on request. If you need something at no cost at all, SIC and NAICS are public domain, with the trade that both classify establishments rather than companies and SIC has not been revised since 1987.
How is BQ-MICS different from GICS and ICB?
On the question that matters most, which is how many industries a company is allowed to occupy. GICS and ICB are strictly hierarchical: one company, one sub-industry or subsector, and every other business it runs is not recorded anywhere. BQ-MICS tags each business a company can be evidenced to operate in, ranks every tag Primary, Secondary or Minor, and keeps exactly one Primary tag so a clean single-industry view is still available whenever you need one. The other differences follow from purpose. GICS and ICB exist to make global benchmarks comparable and are priced on request; BQ-MICS is built for research on US-listed equities and publishes its price at $2,000 a year for internal use.
Can one company be classified in more than one industry?
In 7 of these 9 systems, no. Single assignment is a design requirement rather than an oversight, because a benchmark whose sector weights sum to more than 100% is not a benchmark. The 2 exceptions work differently from each other. FactSet RBICS with Revenue distributes a company's reported segment revenue percentages across the taxonomy, which is measured rather than judged, but bounded by what the company chooses to report as a segment. Apple reports 5 segments and all 5 are geographies. BQ-MICS reads the disclosures instead, so a business gets a tag whether or not it happens to be a reportable segment.
What happens to a conglomerate under BQ-MICS?
It gets tagged in each industry it operates in, rather than being filed under a label that describes none of them. This is where single-assignment schemes struggle most visibly: Morningstar publishes an explicit rule sending any company with more than 3 revenue and income sources and no dominant stream into an industry called Conglomerates, which is honest but tells you nothing about the businesses inside. Under BQ-MICS a company running 6 businesses carries 6 tags, each justified from its own disclosures, with one marked Primary. Alphabet is a worked example on the classification page, tagged across advertising technology, streaming, cloud platforms, operating systems, devices and self-driving software.
Which companies does BQ-MICS cover?
US-listed equities, classified from each company's own filings and investor materials, and keyed to SEC CIK rather than to ticker so a classification survives a rename or a ticker change. Companies that have since delisted or been acquired keep their classification, which is what lets you rebuild an industry aggregate using the market as it actually stood at the time rather than only the names still trading today. That US scope is narrower than the other 8 schemes here, all of which classify globally or across North America.