11 Top Stock Research Websites for 2027
Ratings, analyst research, stock picks and filing data: 11 stock research websites compared on what they offer, what they cost and what you get for free.

Below are 11 of the best-known stock research websites for US stocks: Investor's Business Daily, MarketBeat, Morningstar, the Motley Fool, Seeking Alpha, Simply Wall St, TipRanks, Value Line, WallStreetZen, Zacks and Business Quant. For each one you will find what it is best for, what it costs, what you can use for free, and how much of the evidence behind its research it lets you see.
How to choose a stock research website
Start with the kind of research you want, because these sites fall into 4 groups.
- Quant ratings. Zacks, WallStreetZen, TipRanks, MarketBeat and Seeking Alpha grade stocks with a model.
- Analyst research. Morningstar and Value Line publish named analysts' views.
- Stock picks. The Motley Fool and Investor's Business Daily recommend specific stocks.
- Research data. Business Quant gives you the filings-based record to judge for yourself.
Then check 3 things. First, price and the free tier: several of these sites are trials rather than lasting free plans. Second, how much evidence sits beside the call: Wall Street estimates, institutional holders and insider trades let you test a rating instead of trusting it. Third, how current the data is, because a grade built on last quarter's numbers can lag the results that just came out.
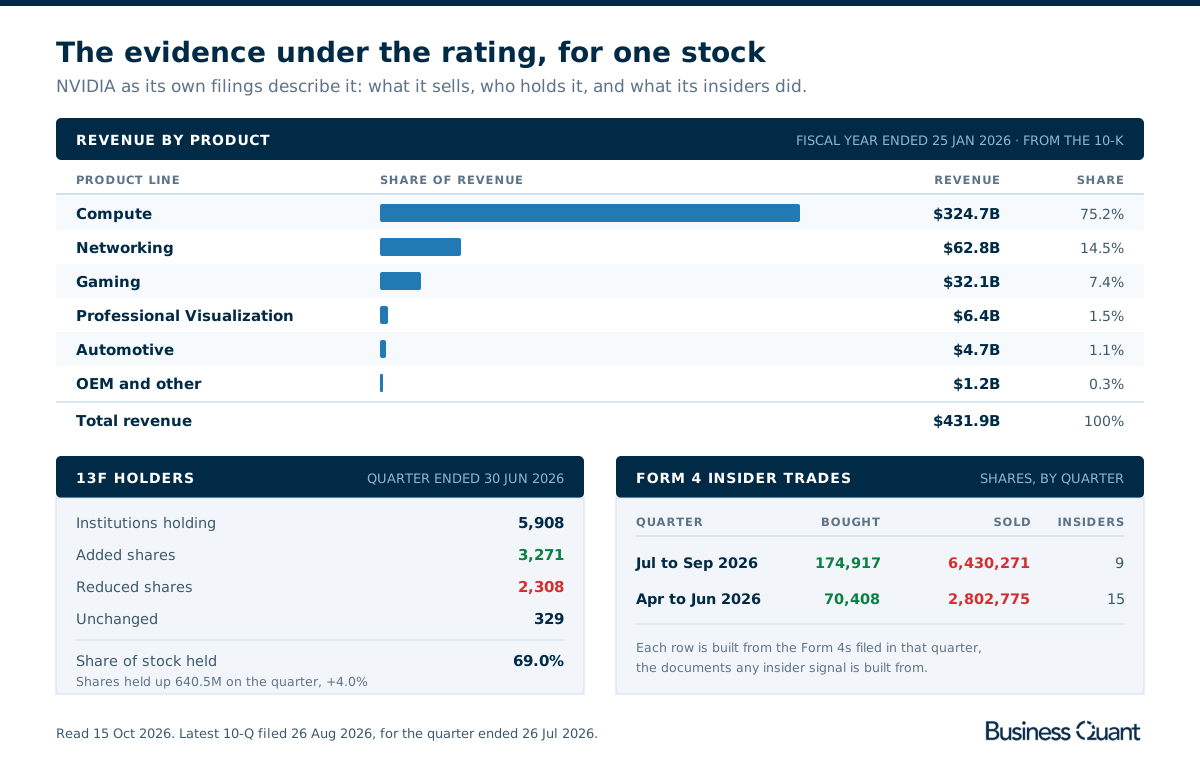
NVIDIA shows why the evidence matters. Its 10-K for the fiscal year ended 25 January 2026 reports $431.9 billion of revenue, 75.2% of it from Compute. The 13F filings for the quarter ended 30 June 2026 show 5,908 institutions holding the stock, with 3,271 adding shares and 2,308 cutting them, and the Form 4s filed between July and September show 9 insiders buying 174,917 shares and selling 6,430,271. Every rating on NVIDIA compresses facts like these into one grade. The sites that show them next to the grade let you see why it moved.
The 11 stock research websites at a glance
- Investor's Business Daily
- MarketBeat
- Morningstar
- Motley Fool
- Seeking Alpha
- Simply Wall St
- TipRanks
- Value Line
- WallStreetZen
- Zacks
- Business Quant
| Platform | Best for | Free access |
Plans from |
|---|---|---|---|
| Investor's Business Daily | Growth stocks and market timing | Introductory offer | $44.95/mo |
| MarketBeat | Analyst rating changes and news | 30-day trial | $20.75/mo |
| Morningstar | Fair values and moat ratings | 7-day trial | $20.75/mo |
| Motley Fool | Long-term stock picks | None listed | $199/yr |
| Seeking Alpha | Contributor research and Quant Ratings | Basic account | $299/yr |
| Simply Wall St | Visual company reports | 5 reports a month | $10.95/mo |
| TipRanks | Analyst forecasts ranked by record | Open forecast pages | $13.50/mo |
| Value Line | One-page stock reports | Free trial | $199/yr |
| WallStreetZen | Simple quant grades | $0 plan, $1 trial | $19.50/mo |
| Zacks | Earnings-driven quant rank | 30-day trial | $249/yr |
| Business Quant | Fundamentals, KPIs and ownership data | Free to use | $29/mo |
Scroll the table sideways for every column. Rows run alphabetically, with Business Quant placed last. "Plans from" is each site's lowest advertised monthly price, or its yearly price where it advertises only a yearly one.
Stock research websites reviewed
Investor's Business Daily
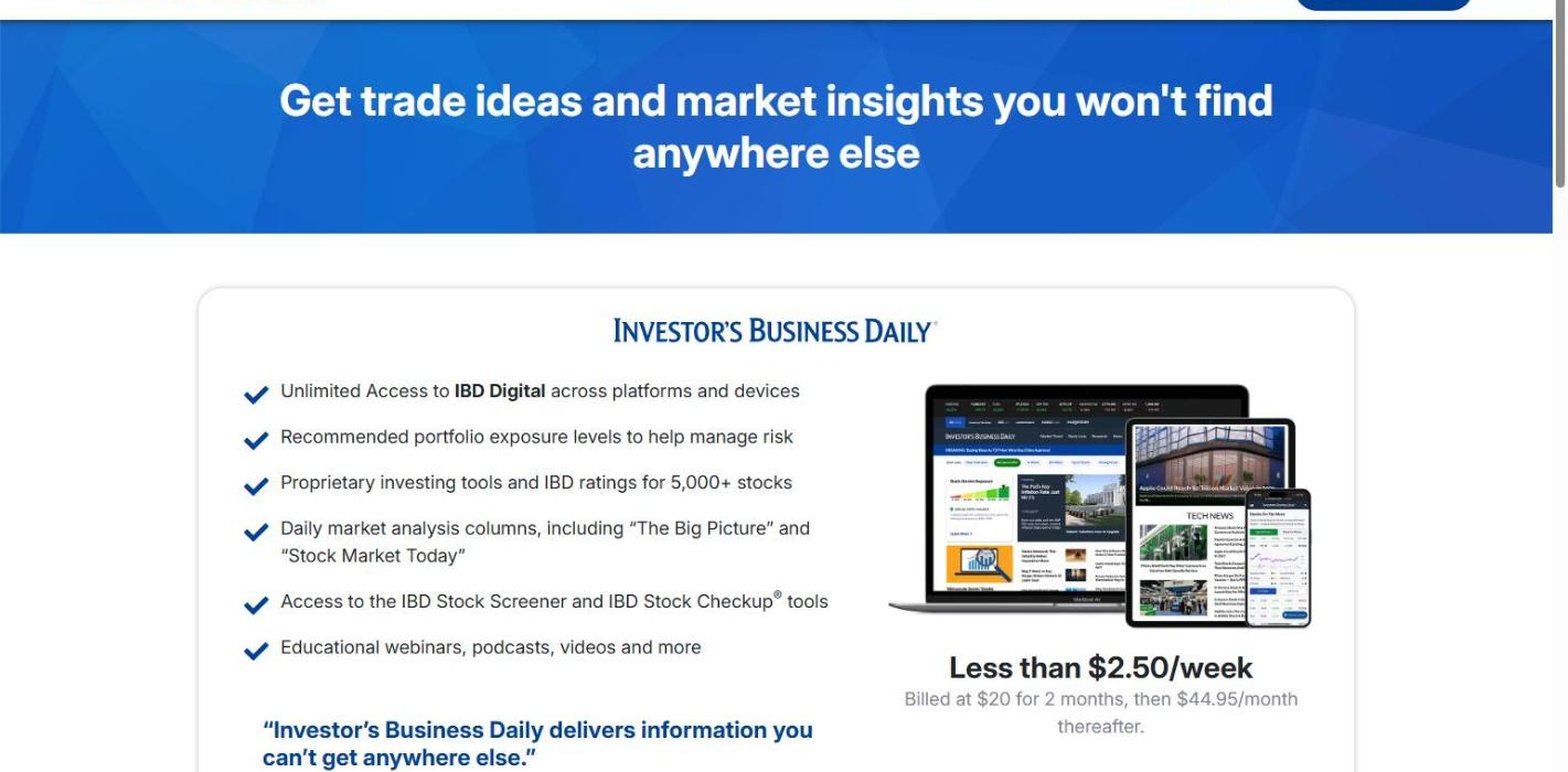
The growth investor's newspaper, built around the stock-picking method of its founder. IBD Digital is the research product; MarketSurge, Leaderboard and SwingTrader are trading tools layered on top.
- Best for growth investors who also time the market.
- IBD Digital from $44.95 a month, after $20 for the first 2 months.
- IBD ratings on 5,000+ stocks.
- Stock Checkup, with 25+ technical and fundamental data points.
- Daily columns such as The Big Picture and Stock Market Today.
- MarketSurge $149.95 a month, for charting and pattern recognition.
The ratings are the product. Every stock gets a set of proprietary scores, and Stock Checkup puts them on one screen with the price action, so the system tells you not only what to own but whether it is behaving like a market leader. The daily columns are the other half: IBD is as much about timing the market as about picking the stock.
Its offer pages do not describe Wall Street targets, institutional holders or insider trades, which fits a method that reads the market's own behaviour as the evidence. At $44.95 a month after the introductory period, it is the most expensive entry tier here.
MarketBeat
An aggregator of Wall Street's daily output. MarketBeat organises upgrades, downgrades, price target changes, insider trades and institutional filings by stock, adds its own composite score, and has built a large free audience doing it.
- Best for following analyst rating changes and market news.
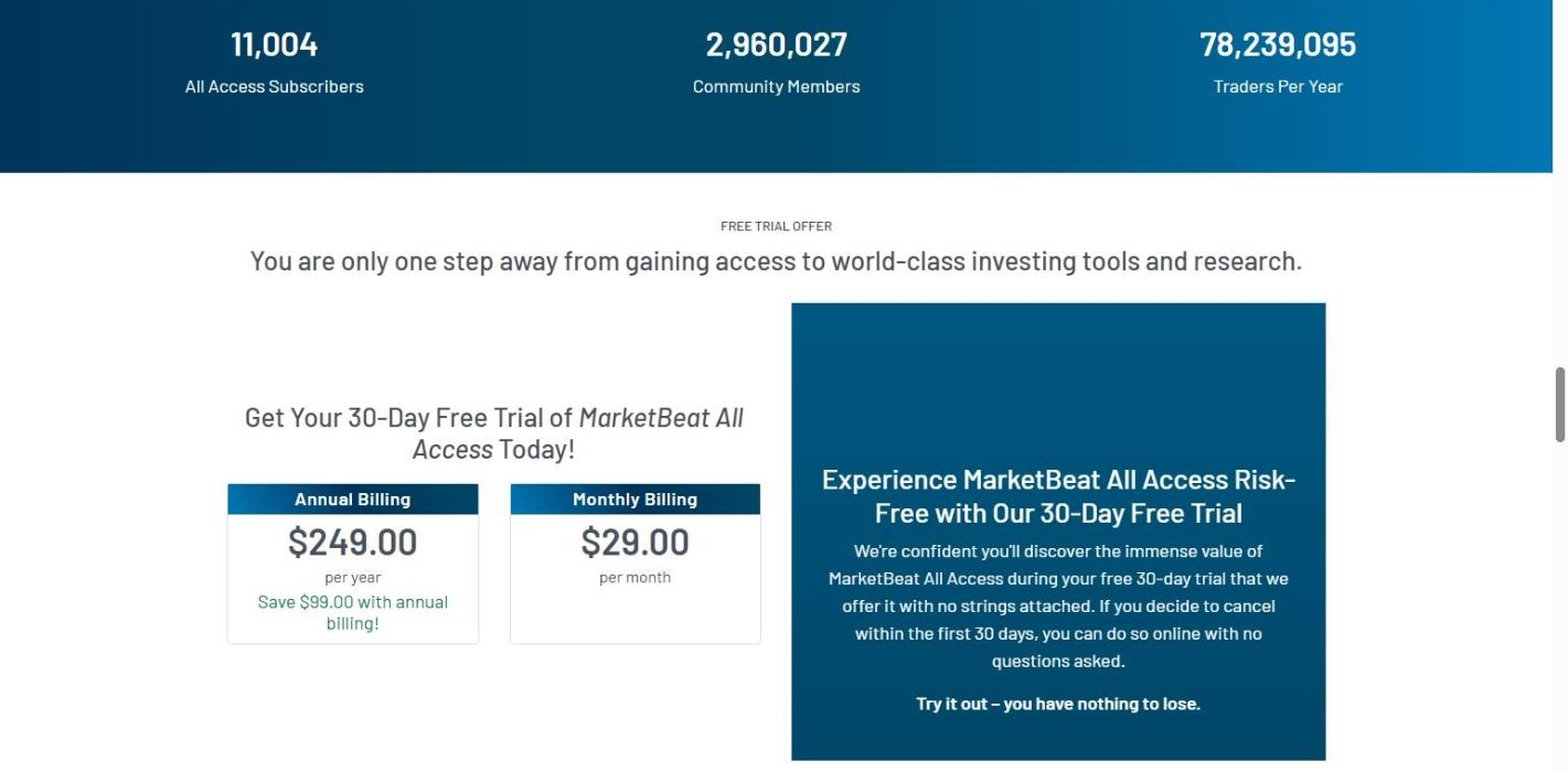
- All Access from $20.75 a month, after a 30-day free trial.
- MarketRank, its own composite score per stock.
- Analyst ratings and price targets on every covered stock.
- Insider trades and institutional ownership tabs per stock.
- SEC filings and short interest tabs as well.
MarketBeat is a feed of everybody else's views, organised per stock, with a composite score on top to sort it. If you want to see what Wall Street and the big holders are doing to a stock this week, its free pages are among the most complete views available.
MarketRank summarises the inputs around it rather than offering an independent thesis, which makes MarketBeat strongest for monitoring and lighter when the question is whether the crowd is right.
Morningstar
More than 4 decades of investment research for individuals, and the most analyst-led research here. Morningstar's equity analysts publish a fair value estimate and a judgement of each covered company's competitive advantage.
- Best for long-term investors who want an analyst's valuation.
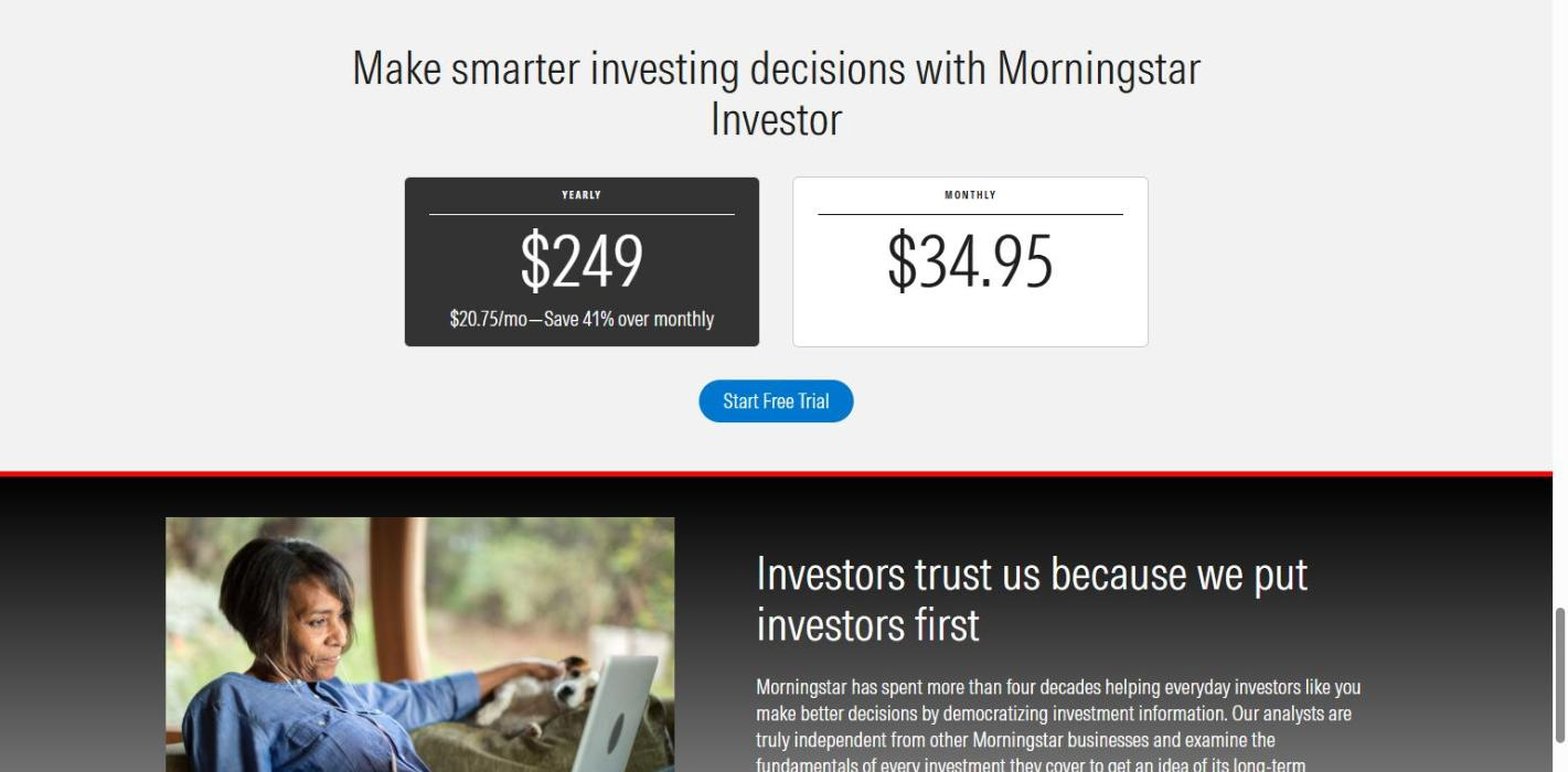
- Morningstar Investor from $20.75 a month, with a 7-day free trial.
- Fair value and competitive advantage ratings on covered stocks.
- Analyst reports and commentary on thousands of securities.
- Screener on 200+ data points.
- Ownership and insider transaction history per stock.
A Morningstar rating is a valuation written down by a named analyst, with the moat argument that justifies it, so when the stars change you can usually see whether the price moved or the analyst's view did.
Ownership by funds and institutions and the insider transaction history load without a subscription; the rating itself sits behind it. Morningstar does not lead with the Wall Street consensus, by design: its pitch is an independent view.
Motley Fool
One of the best-known stock newsletters in America, built on a buy-and-hold philosophy: buy 50 stocks and hold them for at least 5 years. Stock Advisor is the entry product, and more than half a million people pay for one of its services.
- Best for long-term investors who want a few picks a month.
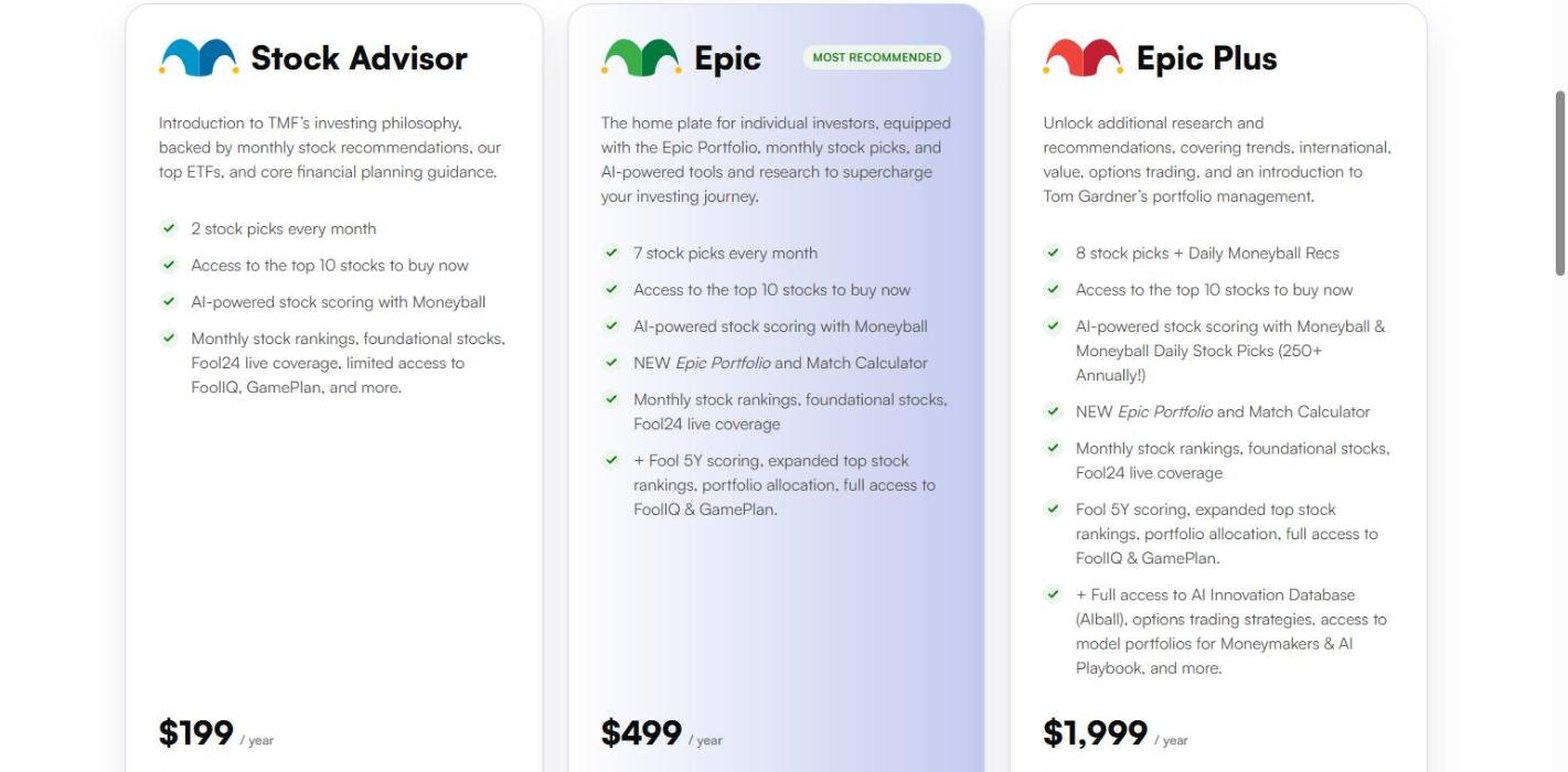
- Stock Advisor $199 a year, an introductory price for new members.
- 2 stock picks every month, plus a top 10 to buy now.
- Moneyball, an AI-powered stock scoring layer.
- Epic $499 a year, with 7 picks a month and Fool 5Y scoring.
- Epic Plus $1,999 a year, with daily Moneyball picks and model portfolios.
The Fool tells you what to buy and explains why in plain language. For somebody who wants a small number of high-conviction ideas and the patience to hold them, nothing else here is built so squarely for that reader.
The services page focuses on picks, rankings and scores rather than consensus estimates or ownership data, so checking a pick against the filings is left to you.
Seeking Alpha
An investing community first: in-depth analysis from independent contributors, comments under every article, and a quant ratings layer on top. It is where the argument about a stock happens in public.
- Best for reading both sides of an investment case.
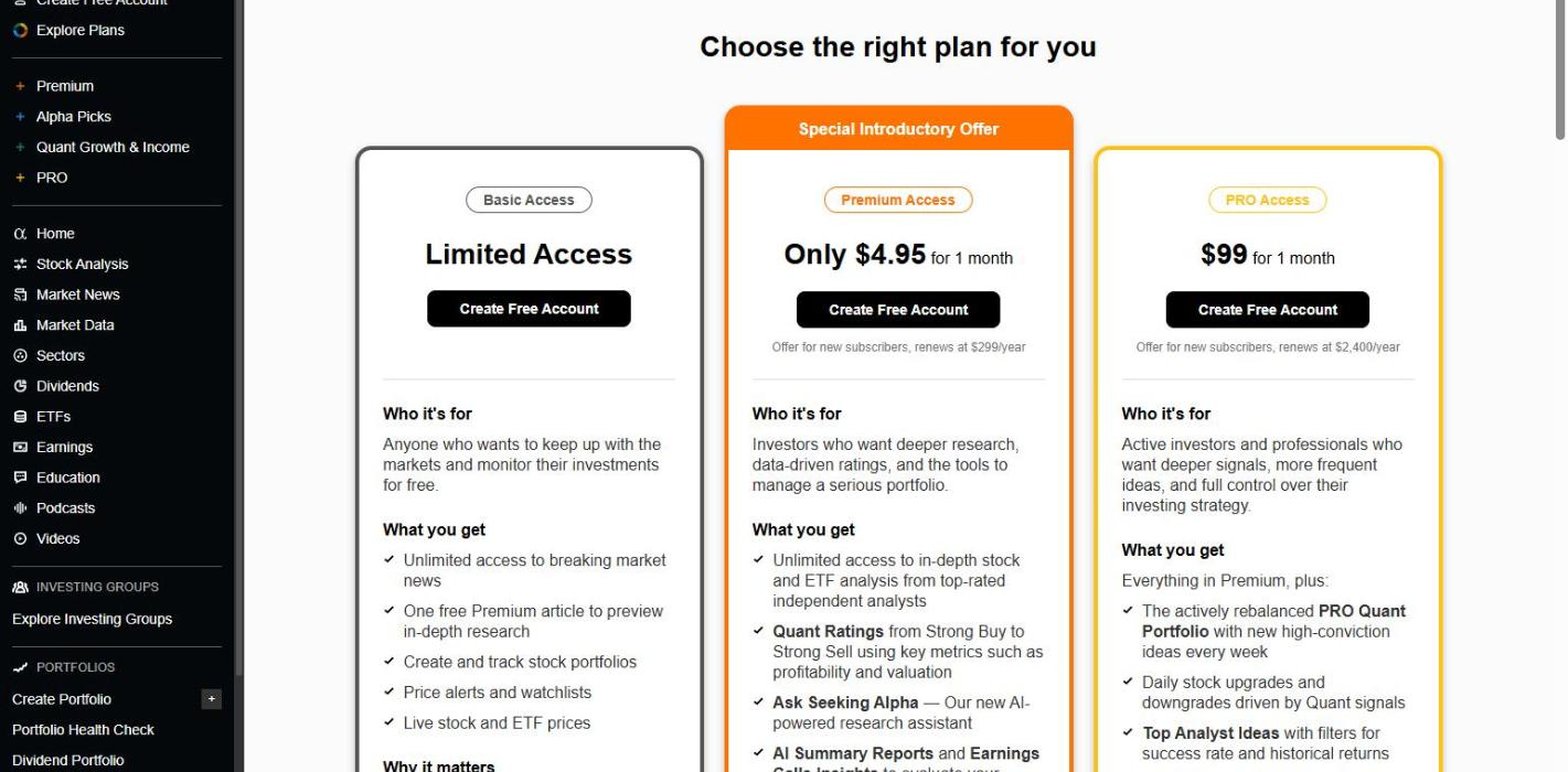
- Basic account, with news, portfolios and one Premium article.
- Premium renews at $299 a year, after a $4.95 first month.
- Quant Ratings from Strong Buy to Strong Sell.
- 3 ratings side by side: contributors, Wall Street and Quant.
- PRO renews at $2,400 a year, with daily quant upgrades.
The ratings summary is the feature to use. Contributor opinion, the Wall Street consensus and the quant grade sit next to each other, so you see at a glance when the 3 disagree, and the articles underneath argue it out.
Insider filings appear in the SEC filings list as documents, one Form 4 at a time, rather than as a table of who bought or sold. Read the price carefully too: the $4.95 introductory month is prominent and the $299 renewal sits under it.
Simply Wall St
The visual one. Simply Wall St turns the company report into an infographic, and its fair value and narrative features let members publish their own valuation cases next to the platform's.
- Best for visual, easy-to-read company reports.
- $0 plan, 5 company reports a month.
- Premium from $10.95 a month, 30 reports a month.
- Unlimited $21.50 a month, with Excel and PDF export.
- 120,000+ stocks across 90+ markets.
- Analyst price targets, ownership and insider trading per stock.
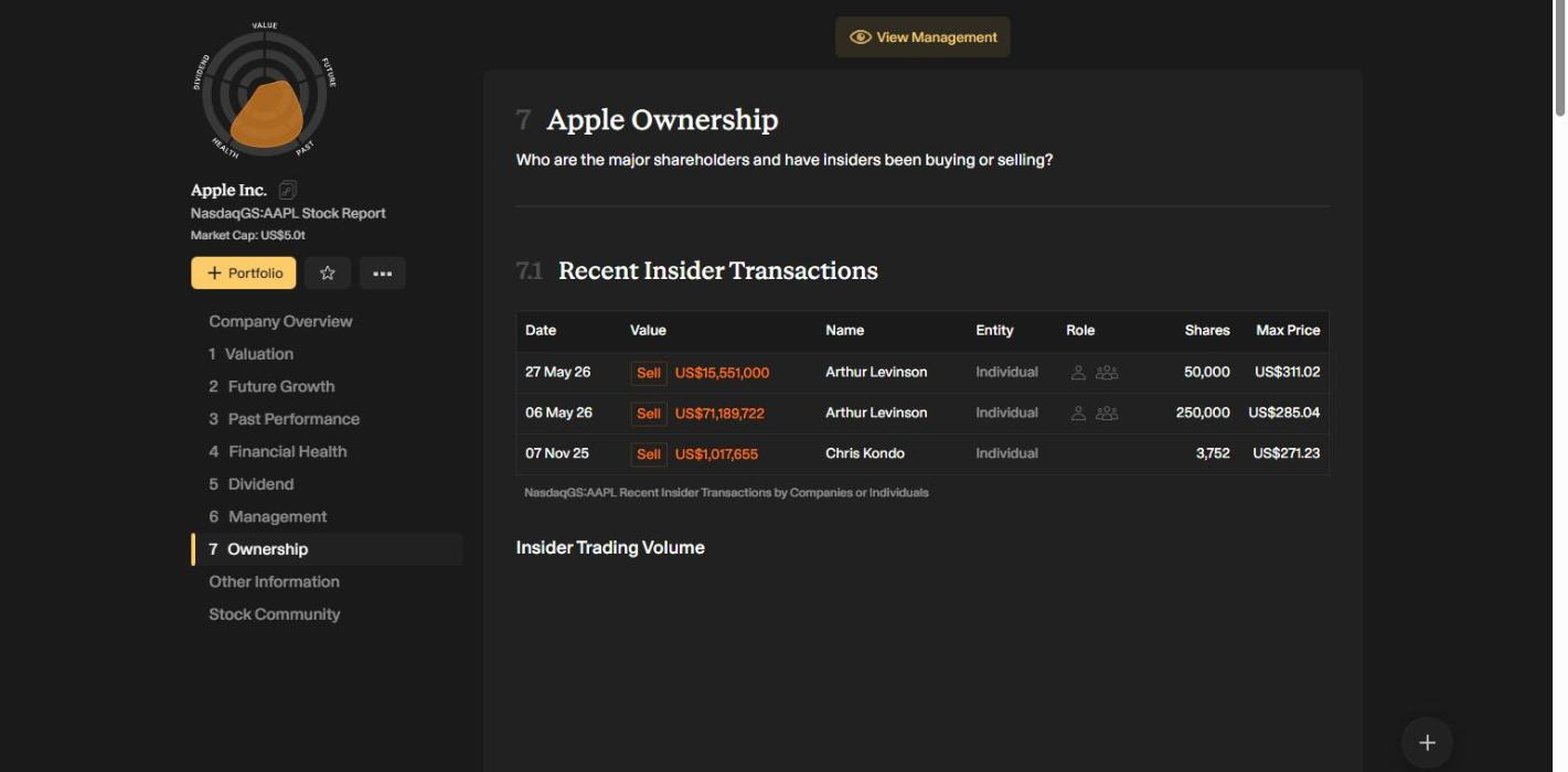
Apple's ownership page breaks the shareholder base down by type, with institutions at 65.7% of shares, charts insider trading volume and lists the top shareholders, next to a forecast page saying 87 analysts cover the company. The call and its inputs sit on adjacent tabs.
Export is on the top plan only, and the financial data underneath comes from S&P Global, as the plans page states, so the snowflake and fair values are Simply Wall St's reading of a licensed dataset.
TipRanks
Built on one idea: rank the analysts, not just the stocks. TipRanks tracks the published calls of Wall Street analysts, bloggers, insiders and hedge funds, measures how each has performed, and lets you weight the advice by the record of whoever gave it.
- Best for analyst forecasts filtered by track record.
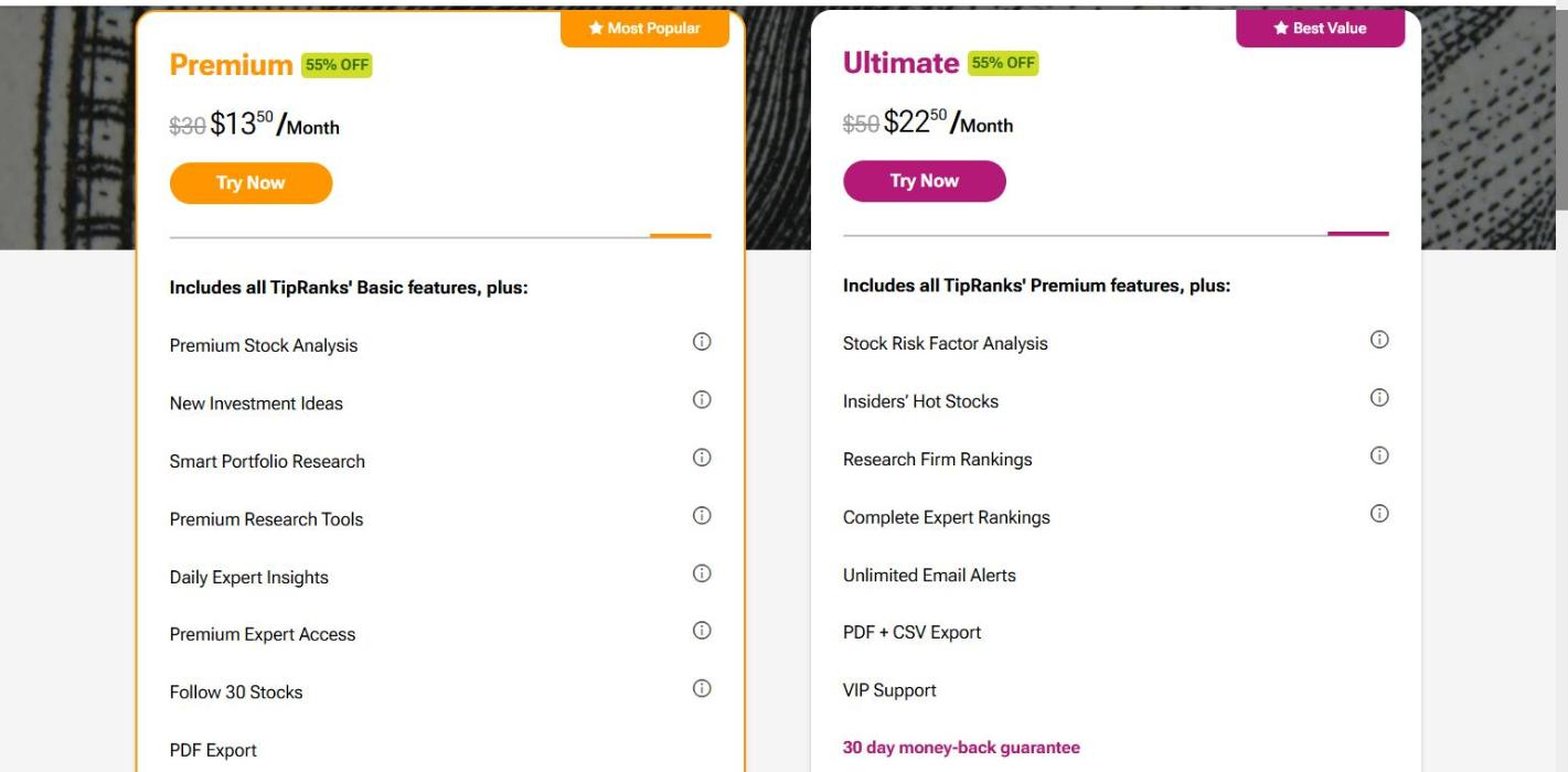
- Premium from $13.50 a month, shown against a struck-through $30.
- Ultimate $22.50 a month, with research firm rankings and CSV export.
- Smart Score, its own composite score per stock.
- Insider trading and hedge fund activity per stock.
- Forecast pages open without an account.
Apple's forecast page, read on 15 October 2026, counted 31 Wall Street analysts with 12-month targets in the last 3 months and an average of $338.31, then let you narrow that to the analysts with the best records on the stock. A consensus you can filter by accountability is more useful than a raw average.
The Smart Score sits on top as a summary, and TipRanks labels its performance figures as backtested, which is the right way to read any rating's track record.
Value Line
The oldest name here, with more than 90 years of research and a one-page stock report generations of investors learned to read. The Timeliness and Safety ranks at the top of each report are its call; the analyst's commentary explains them.
- Best for investors who like a single-page stock report.
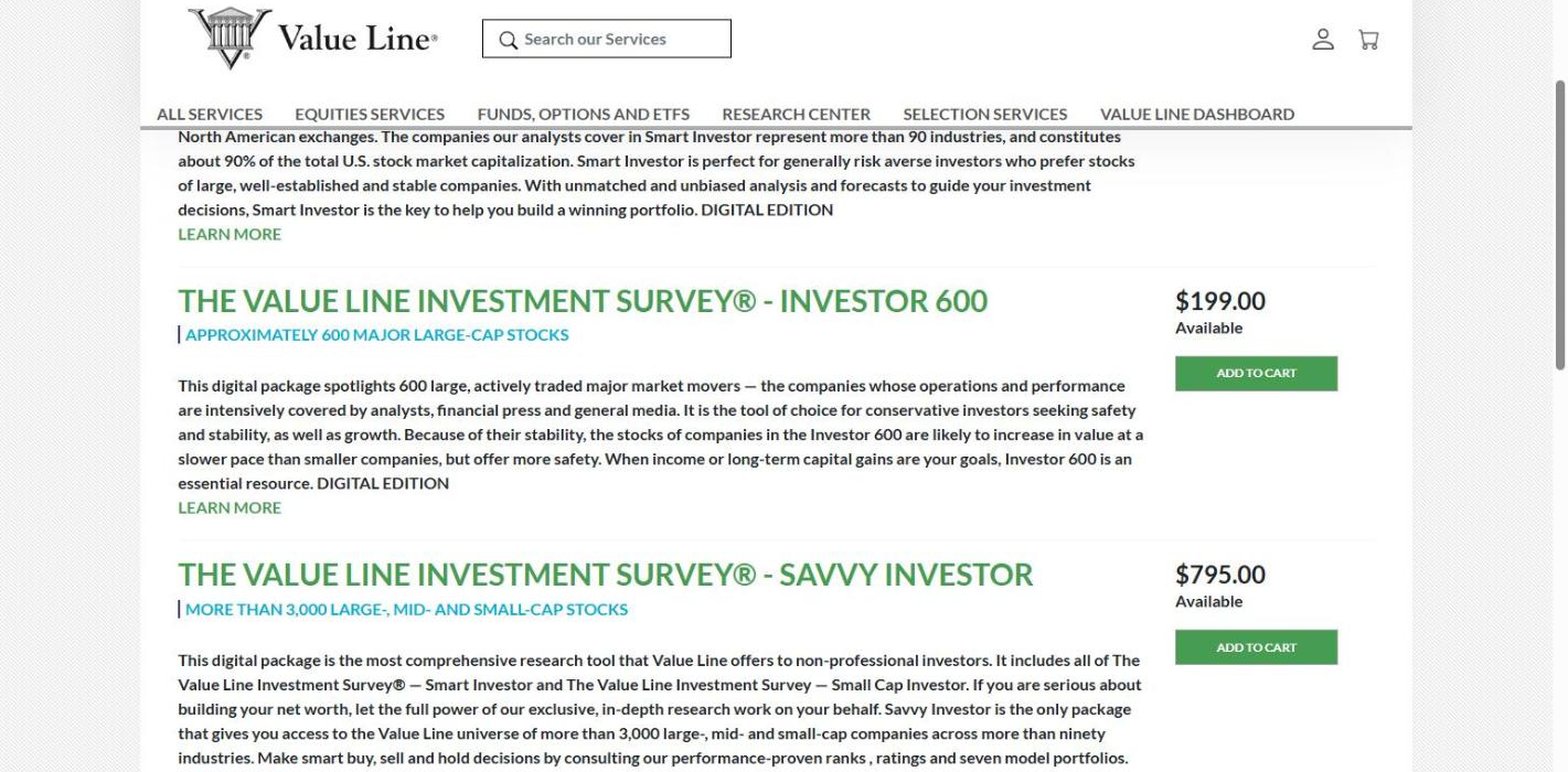
- Investor 600 $199 a year, for about 600 large caps.
- Savvy Investor $795, for 3,000+ stocks.
- Timeliness and Safety ranks on every covered stock.
- 3 to 5 year price and earnings projections in each report.
- Insider and institutional decisions printed on the report.
A single page carries the ranks, the analyst's commentary, current and historical financials, the projections, a monthly tally of insider buying and selling, and the quarterly count of institutions buying and selling.
Pricing is by universe rather than by feature, which is fair for an investor who follows only large companies and steep for anyone who wants all 3,000. It is a reference you consult rather than a feed you watch.
WallStreetZen
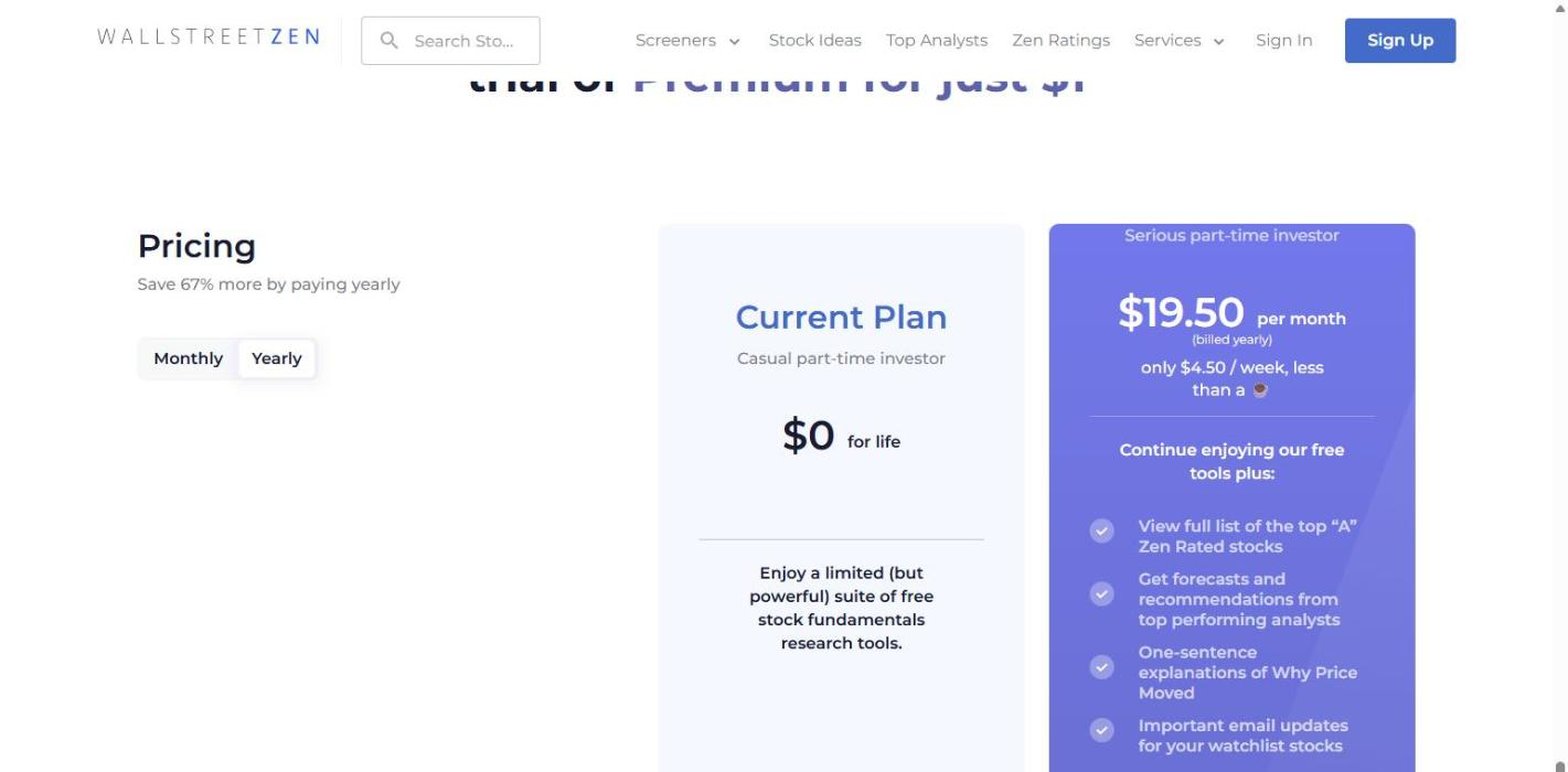
The plain-English quant tool. WallStreetZen runs a 115-factor model over US stocks, publishes the result as a letter grade, and adds a one-sentence explanation of why a stock's price moved.
- Best for beginners who want one clear grade.
- $0 plan, described as free for life.
- Premium from $19.50 a month, with a $1 14-day trial.
- Zen Ratings on 115 factors, A to F.
- Top analyst forecasts, filtered by track record.
- Institutional and insider ownership per stock.
WallStreetZen says its A-rated stocks have averaged 28.50% a year since 2006; read that as the vendor's figure. The grade sits beside a net insider buying and selling figure for the last 12 months and the institutional holder list on each stock's ownership page.
The price-move notes are a sentence long by design and there is no long-form analysis behind the grade, which keeps the product quick to read.
Zacks
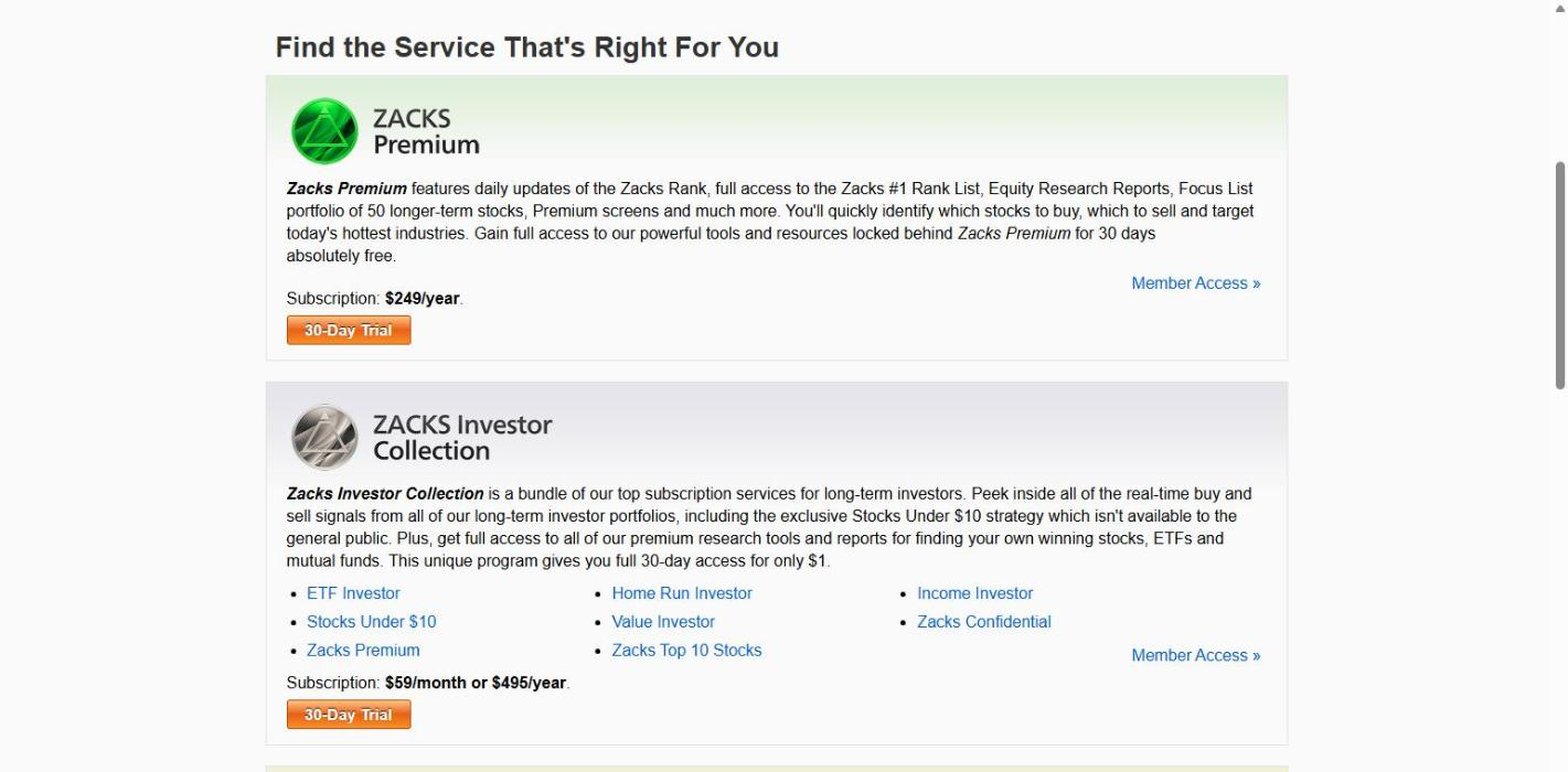
One of the longest-running quant ranks sold to individual investors. Zacks publishes a track record for the Zacks Rank back to 1988, and its premium screens, equity research reports and Focus List are organised around it.
- Best for earnings-revision investors.
- Zacks Premium $249 a year, with a 30-day trial.
- Zacks Rank, updated daily, with a #1 Rank List.
- Equity research reports and a 50-stock Focus List.
- Brokerage recommendations and price targets per stock.
- Zacks Ultimate $299 a month, with every portfolio service.
Zacks says Zacks Rank stocks have averaged a gain of 23.82% a year since 1988, by its own calculation through 5 October 2026. The quote page around the rank carries brokerage recommendations, the price target, style scores and research reports, so the rank comes with context.
There is an insider transactions page for each stock but no institutional holder page, so 13F data has to come from elsewhere.
Business Quant
A research platform built on company data that Business Quant extracts in house from SEC filings. Instead of telling you what to buy, it gives you everything a rating is built from, for every US-listed stock, along with the tools to screen, chart and compare it.
- Best for fundamentals, company KPIs and ownership data.
- Free to use, no card, with 5 years of financial history.
- Pro from $29 a month, with 20+ years of statements.
- Pro also adds segment financials, KPI data, analyst estimates and data export.
- Company KPIs for about 1,700 companies, up to 40 quarters.
- 13F holders, insider trades and SEC filings on every stock.
- Results within 10 to 15 minutes of a company's release.
Every stock page has tabs for the financial statements, KPIs and operating metrics, analyst estimates, dividends, the revenue breakdown by segment, product and geography, peers, institutional ownership from 13F filings, insider trading from Form 4s, SEC filings and charts. Statements come from 10-K, 10-Q, 20-F, 40-F, 6-K and 8-K filings in an industry-specific layout, so a bank and a chipmaker each appear in a format that fits them.
The company KPI data is the part a rating rarely shows: subscribers, store counts, deliveries and the other numbers management uses to describe its own business. Around the stock pages sit the stock screener on 818 metrics, advanced charting, time series tables, industry financials, a portfolio tracker, a market heatmap, economic data, corporate actions, an ETF and mutual fund screener and fund comparison, plus an API and an MCP server for Claude, ChatGPT and Cursor.
Because the data is extracted from the filings and refreshed within 10 to 15 minutes of a release, the evidence is current before most ratings have been recalculated, and you can check any rating you read elsewhere against it.
Research features compared
| Platform | Wall Street estimates |
13F holders |
Insider trades |
Company KPIs |
Plans from |
|---|---|---|---|---|---|
| Business Quant | ✓ | ✓ | ✓ | ✓ | $29/mo |
| MarketBeat | ✓ | ✓ | ✓ | ✗ | $20.75/mo |
| Simply Wall St | ✓ | ✓ | ✓ | ✗ | $10.95/mo |
| TipRanks | ✓ | ✓ | ✓ | ✗ | $13.50/mo |
| WallStreetZen | ✓ | ✓ | ✓ | ✗ | $19.50/mo |
| Morningstar | ✗ | ✓ | ✓ | ✗ | $20.75/mo |
| Value Line | ✗ | ✓ | ✓ | ✗ | $199/yr |
| Zacks | ✓ | ✗ | ✓ | ✗ | $249/yr |
| Seeking Alpha | ✓ | ✗ | ✗ | ✗ | $299/yr |
| Investor's Business Daily | ✗ | ✗ | ✗ | ✗ | $44.95/mo |
| Motley Fool | ✗ | ✗ | ✗ | ✗ | $199/yr |
Sorted by number of ticks, ties broken alphabetically. A tick means the data is on the site's own pages, free or on its cheapest paid plan, according to its own published material; a cross means it is not documented there. "Wall Street estimates" means sell-side analyst estimates, ratings or targets. "13F holders" and "Insider trades" mean a table of holders or trades, not a list of filing documents. "Company KPIs" means company-specific operating metrics such as subscribers, deliveries or store counts.
The table measures the evidence each site puts beside its research, not the quality of the research itself. Morningstar and Value Line leave out the Wall Street consensus because their own analysts are the alternative to it, and the Motley Fool and Investor's Business Daily keep the focus on their own picks and method, which is what their subscribers pay for.
Business Quant research features
Business Quant is free to use with no card. The free account opens every web feature with 5 years of financial history; Pro adds the long history and the deeper datasets.
| Research task | Where it is on Business Quant |
|---|---|
| See what a company sells | Revenue by segment, product and geography on the revenue breakdown tab |
| Check the trend behind a rating | Statements for 5 years free, 20+ years on Pro |
| Read the quarter that just came out | Results within 10 to 15 minutes of release |
| Track the operating numbers | KPIs for about 1,700 companies, up to 40 quarters, on company KPI data |
| Compare with Wall Street expectations | Analyst estimates for revenue, EPS and margins |
| See which funds are buying or selling | 13F holders on each stock's institutional ownership tab |
| See what insiders did | Form 4 trades on each stock's insiders tab |
| Read the source document | The 10-K, 10-Q, 8-K and the rest on the SEC filings tab |
| Build a shortlist | The stock screener, on 818 metrics |
| Chart a metric over 10 years | Advanced charting, KPIs included |
| Compare a company with its industry | Industry financials and the peers tab |
| Follow your holdings | The portfolio tracker |
Other research sites worth knowing
2 kinds of site come up often in this search and are covered elsewhere on Business Quant.
- Yahoo Finance. Its research plans resell Morningstar's ratings and reports.
- Data-first analysis sites. Stock Analysis, Koyfin and TIKR publish no rating of their own.
Yahoo Finance's free quote pages carry analyst price targets, top institutional holders and insider transactions, and its paid Silver plan at $19.95 a month adds the Morningstar Rating and research reports; Morningstar is reviewed above at the source. The data-first sites are compared in our stock analysis websites guide, and our research tools comparison looks at where each platform's data comes from.
Where I would start my research
For researching US stocks, I would start with Business Quant.
Every rating, pick and price target on this list is built from a few things: what the company sells, how its operating numbers are trending, what Wall Street expects, who is buying the stock and what insiders are doing with their own shares. Business Quant puts all of those on each company's page, built from the filings and updated within 10 to 15 minutes of a release. With that in front of you, any grade you read becomes something you can check.
The free account covers 5 years of statements, the screener, charting, ownership and insider data and a portfolio tracker, with no card. Pro, from $29 a month, adds 20+ years of statements, segment financials, KPIs for about 1,700 companies, analyst estimates and data export.
A 15-minute test: take the last stock you bought on a rating or a tip. Open its revenue breakdown, its institutional ownership tab and its insiders tab, and note whether the segment trend, the funds and the insiders agree with the call. If they do, you have a better reason to hold it. If they do not, you have found the question to ask before you add to it.
How this comparison was made
To make the list, a site had to sell stock research on US-listed stocks to individuals at a price published on its own site, or offer it at no cost, and either publish its own view on individual stocks (a rating, score, rank, recommendation or written research) or build its company data from SEC filings and show institutional holders and insider trades per stock. Sites that resell another firm's ratings were not counted on that content.
Every price, plan limit and feature was read on the vendor's own pricing, plan, product or stock pages on 15 October 2026 and screenshotted there. Prices are each platform's lowest advertised monthly price on that date, or its yearly price where only that is advertised. Track-record figures are the vendors' own and are labelled that way. The NVIDIA figures were read from Business Quant on the same date and trace to 10-K, 13F and Form 4 filings.
The reviews and summary table are alphabetical, with Business Quant placed last; the feature table is sorted by number of ticks, with ties broken alphabetically. Business Quant, which publishes this article, makes one of the 11 products compared here. I write for Business Quant. For the developer side of ownership data, see our institutional ownership API comparison and our insider trading API comparison.
Image credits. Header photograph by Adeolu Eletu on Unsplash, used under the Unsplash License. Vendor screenshots were captured on 15 October 2026 from each provider's own pricing, plans or product pages and are reproduced for comparison. The NVIDIA illustration is a Business Quant original.
Frequently asked questions
What is the best stock research website?
It depends on the kind of research you want. For quant ratings, Zacks, WallStreetZen and Seeking Alpha grade stocks on systematic models. For analyst research, Morningstar and Value Line publish the work of named analysts. For stock picks, the Motley Fool sends a small number of recommendations each month. For the underlying data, Business Quant puts statements, segment revenue, company KPIs, analyst estimates, 13F holders and insider trades for every US-listed stock on one page.
What is the best free stock research website?
Business Quant is free to use with no card and includes 5 years of statements, its screener, charting, ownership and insider data and a portfolio tracker. WallStreetZen has a $0 plan it describes as for life, Simply Wall St has a permanent plan capped at 5 company reports a month, and Seeking Alpha has a Basic account with news and one Premium article. TipRanks forecast pages, with Wall Street price targets, open without an account. Morningstar Investor, Zacks Premium and MarketBeat All Access are trials rather than lasting plans, at 7, 30 and 30 days.
Are paid stock research websites worth it?
They are worth it when you use what you pay for. A ratings service earns its fee if you act on its grades and check them; a data platform earns it if you use the longer history and deeper datasets. Entry prices on the sites compared here run from $10.95 a month to $44.95 a month, so a month of testing costs little. Read any published track record as the vendor's own figure.
Which stock research website is best for beginners?
Beginners usually do best with one clear signal and plain explanations. WallStreetZen's letter grades and one-line explanations are easy to follow, Simply Wall St turns a company report into a visual summary, and the Motley Fool explains each pick in plain language. Business Quant suits a beginner who wants to learn from the numbers themselves, with every metric charted over time.
Where can I see analyst price targets for free?
TipRanks shows them on open forecast pages: on 15 October 2026 its Apple page counted 31 Wall Street analysts with 12-month targets in the last 3 months, averaging $338.31. MarketBeat, Zacks and Simply Wall St also carry price targets on their stock pages, and Seeking Alpha shows a Wall Street rating beside its own Quant Rating.
How much does a stock research subscription cost?
Entry prices run from $10.95 a month to $44.95 a month, with 4 sites sold by the year. Simply Wall St Premium is from $10.95 a month, TipRanks Premium from $13.50, WallStreetZen Premium from $19.50, Morningstar Investor and MarketBeat All Access from $20.75, Business Quant Pro from $29 and IBD Digital from $44.95 after its introductory period. The Motley Fool's Stock Advisor is $199 a year, Value Line's Investor 600 is $199 a year, Zacks Premium is $249 a year and Seeking Alpha Premium renews at $299 a year.