11 Best Stock Rover Alternatives for 2027
Stock Rover's entry plan now costs $34 a month on monthly billing, up from $7.99 in May. Which alternatives still screen, research and track a portfolio for less?


Stock Rover repriced its plans in 2026, and the cheapest way in now costs more than 4 times what it did in May. For investors who used it to screen stocks, read their financials and track a portfolio, that is reason enough to look around.
Below are 11 Stock Rover alternatives that screen US stocks on fundamentals and show a company's full financial statements, and most of them track a portfolio too. We compare them on history, segment and KPI data, ownership, data export, API access and price.
What changed at Stock Rover
Stock Rover's own plans page shows the change most clearly on monthly billing. In May 2026 it listed 3 plans. Essentials cost $7.99 a month and included 5 years of financial history, stock screening, portfolio management and brokerage integration. Premium, at $17.99, took history to 10 years and added data export. Premium Plus, at $27.99, added fair value, stock scores, and equation-based and historical screening.
On 16 October 2026 the ladder starts higher. Premium, with 5-year fundamentals and 300+ screening metrics, costs $34 a month on monthly billing, $29 billed annually or $24 on 2-year billing. A 10-year history now sits on Premium Plus, at $70 a month on monthly billing against $17.99 in May, and unlimited fair values, stock scores and equation-based screening moved from $27.99 to that same plan. Essentials is gone.
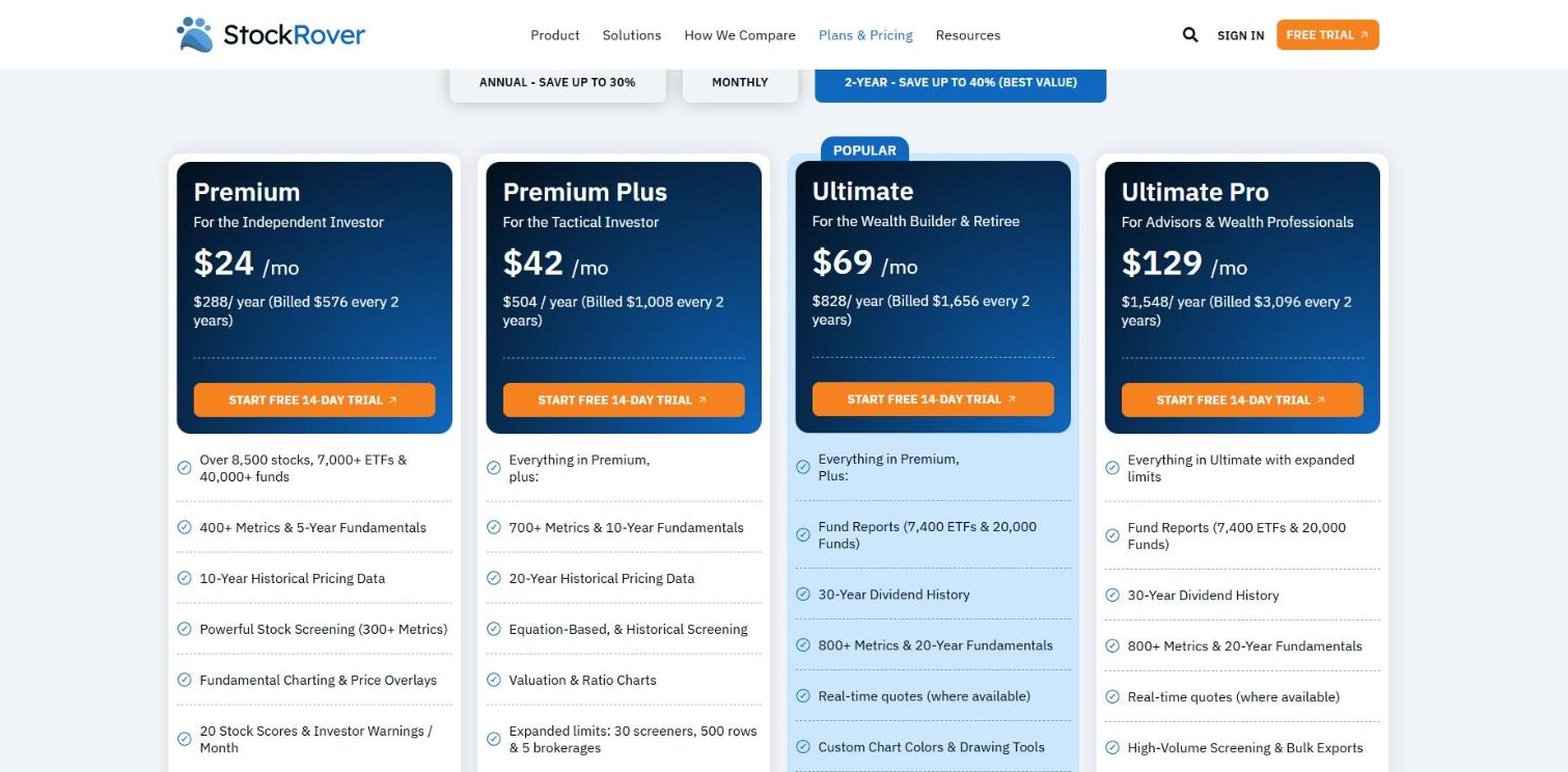
To be fair to Stock Rover, the new plans carry more than the old ones. Premium now lists 400+ metrics, Premium Plus adds research reports on 7,000+ stocks, and Ultimate brings 20-year fundamentals, real-time quotes where available and OTC screening. It priced a bigger product higher and dropped the plan that undercut it.
That leaves a narrower question than "what else is out there": which of Stock Rover's features do you actually use, and who sells them for less?
How to choose a Stock Rover alternative
Most Stock Rover users rely on it for 3 jobs, so judge each alternative on those and on price.
- Screening. Fundamental filters with thresholds you set.
- Research. Statements deep enough to cover a business cycle, plus segment and KPI data.
- Portfolio tracking. Holdings, cost basis and a return you can compare with a benchmark.
- Price. The cost of the cheapest plan that covers the jobs you use.
History is where the plans differ most. Stock Rover's Premium stops at 5 years of fundamentals, which is about what several sites here show without payment. If you paid for Premium Plus to get 10 years, compare 10-year plans, not entry prices.
Segment data is what separates research tools from quote sites. Total revenue tells you how big a company is; revenue by business line and region tells you which part of it is growing.
Portfolio tracking is the job people forget to check until they have moved. If you used Stock Rover's portfolio analytics, look for a money-weighted return such as XIRR and a benchmark, not just the day's gain. Our portfolio tracker comparison covers that job on its own, and our stock screener comparison covers screening.
The 11 Stock Rover alternatives at a glance
- Finviz
- Koyfin
- Morningstar
- Seeking Alpha
- Simply Wall St
- Stock Analysis
- Stockopedia
- TIKR
- TradingView
- Yahoo Finance
- Business Quant
| Platform | Best for | Plans from |
|---|---|---|
| Finviz | Fast screening and visual market scans | $24.96/mo |
| Koyfin | Dashboards and global charting | $39/mo |
| Morningstar | Analyst fair values and fund research | $20.75/mo |
| Seeking Alpha | Written analysis and Quant Ratings | $299/yr |
| Simply Wall St | Visual company reports | $10.95/mo |
| Stock Analysis | Long history on a small budget | $6.58/mo |
| Stockopedia | Factor-ranked screening | $45/mo |
| TIKR | Global fundamentals and segments | $17.95/mo |
| TradingView | Charting with fundamentals attached | $12.95/mo |
| Yahoo Finance | Quotes, news and very long history | $7.95/mo |
| Business Quant | Screening, research and portfolio XIRR on one set of data | $29/mo |
Rows are alphabetical, Business Quant last. "Plans from" is the cheapest paid plan's lowest advertised monthly price on 16 October 2026, or its yearly price where only that is advertised. For comparison, Stock Rover's Premium is $24 a month on 2-year billing.
Stock Rover alternatives reviewed
Finviz
Finviz began as a visual map of the US market, and its screener, portfolios and charts grew around that idea of seeing everything at once. It is the screener investors share links to, and most of it works on a free registered account.
- Best for fast screening and visual market scans.
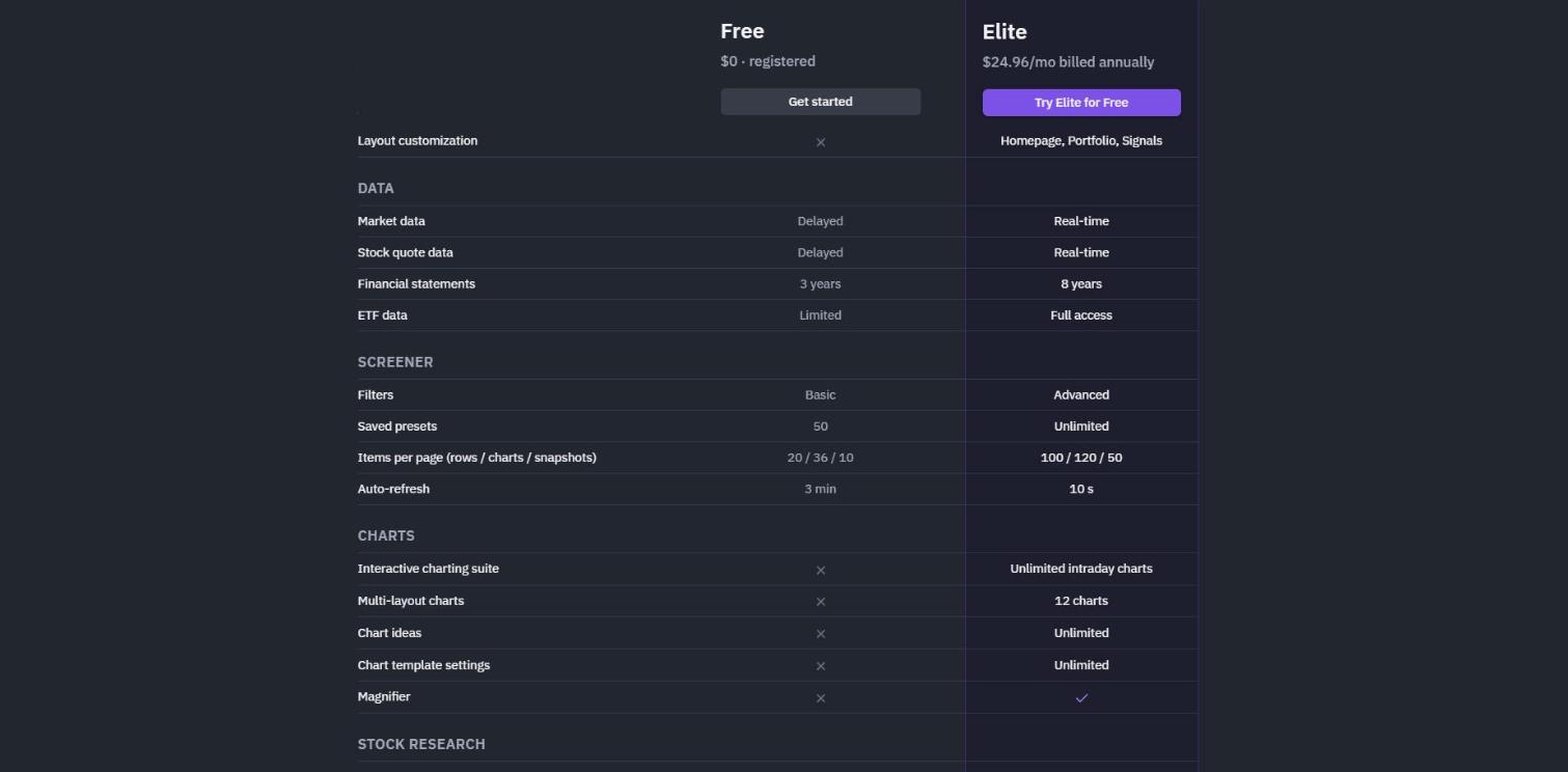
- Free account with basic filters, 50 saved presets and 50 portfolios.
- Elite from $24.96 a month, or $39.50 billed monthly.
- Statements: 3 years free, 8 years on Elite.
- Revenue breakdown by segment, product and region.
- Insider trades and SEC filings on every stock page.
- Elite adds real-time quotes, advanced filters and export.
Finviz replaces Stock Rover's screening and portfolio side well, and Elite costs about the same as Stock Rover's Premium on 2-year billing while adding real-time data. Its revenue breakdown pages also split each company's sales by segment, product and region at no cost.
Where it falls short: statements stop at 8 years even on Elite, so anyone who paid Stock Rover for 10-year fundamentals gives some history up. There are no company KPIs, no API and no MCP server, and Elite's exports are the only way to get data out.
Koyfin
Koyfin is a market terminal for individual investors and advisers, built around dashboards, charts and watchlists. Its screener and portfolio view share the same interface, with global coverage.
- Best for dashboards, charting and global market views.
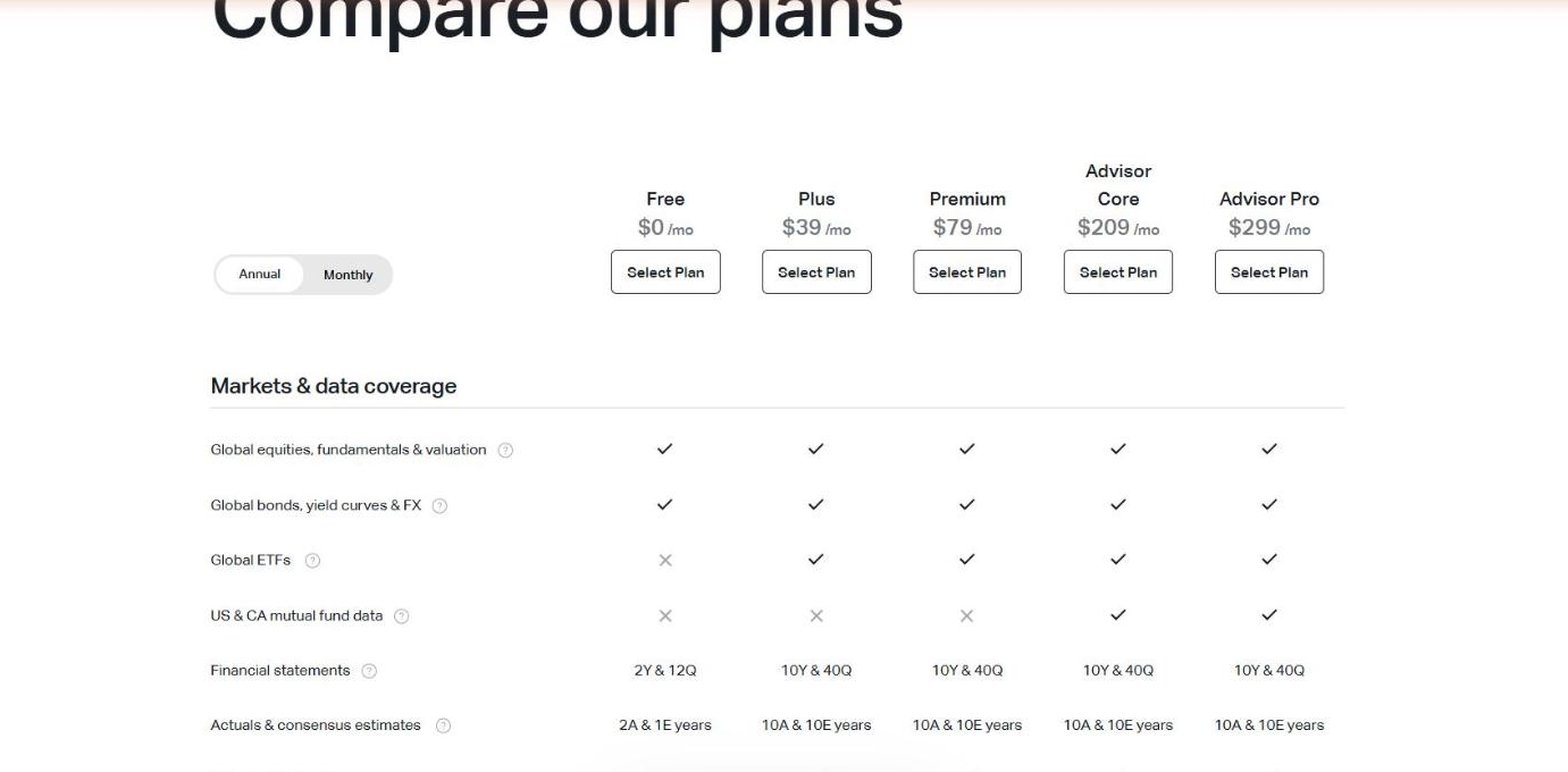
- Free plan with a stock screener, 2 saved screens and 5 graphs.
- 2 years and 12 quarters of statements free.
- Plus from $39 a month, with 10 years and 40 quarters.
- One portfolio account free, unlimited on Plus.
- Insider ownership, transactions and company filings.
Koyfin is a better replacement for Stock Rover's charts and market overview than for its tables. It is built to set a company against the market around it, the free plan is a working account rather than a trial, and Plus adds ETF screening and unlimited screens.
Where it falls short: the free plan has the shortest history here, the plan grid lists no segment data, and Koyfin's data vendor does not allow equity financials to be exported. There are no company KPIs and no API. If 10 years is what you need, price Plus, at $39 a month, against Stock Rover's Premium Plus.
Morningstar
Morningstar is the research firm behind the star ratings and economic moat ratings most investors already know. Morningstar Investor puts its analysts' fair values, a screener and portfolio tools under one subscription.
- Best for analyst fair values, moat ratings and fund research.
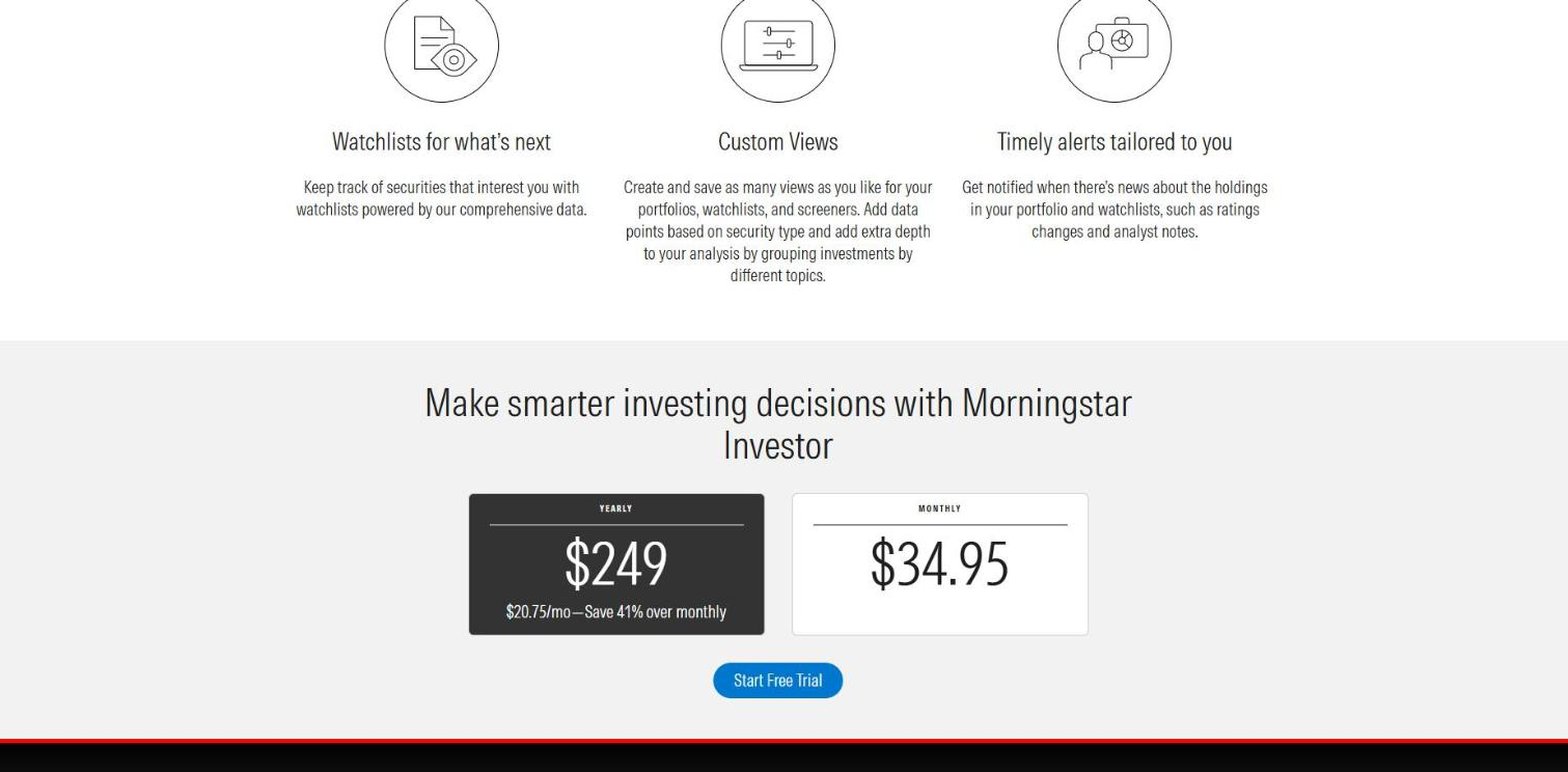
- Investor from $20.75 a month, or $34.95 billed monthly.
- 7-day trial.
- Screener with more than 200 data points.
- Portfolio tools for performance, allocation, fees and overlap.
- 10 fiscal years of statements, with an As Originally Reported view.
Morningstar covers all 3 of Stock Rover's jobs inside one plan, and adds what Stock Rover rations: an independent analyst's fair value and moat rating on the companies it covers. Its portfolio tools show performance, allocation, fees and overlapping holdings, and each stock page has an ownership tab. On annual billing it costs less than Stock Rover's Premium on any billing.
Where it falls short: the screener and portfolio tools need the subscription, statement history stops at 10 years, and the retail site has no segment data. Investor documents no way to download statements, and its API and MCP server are sold only to enterprise customers.
Seeking Alpha
Seeking Alpha is an investing community with thousands of contributor articles and a Quant Rating on every covered stock. Its free Basic account keeps portfolios, watchlists and price alerts open.
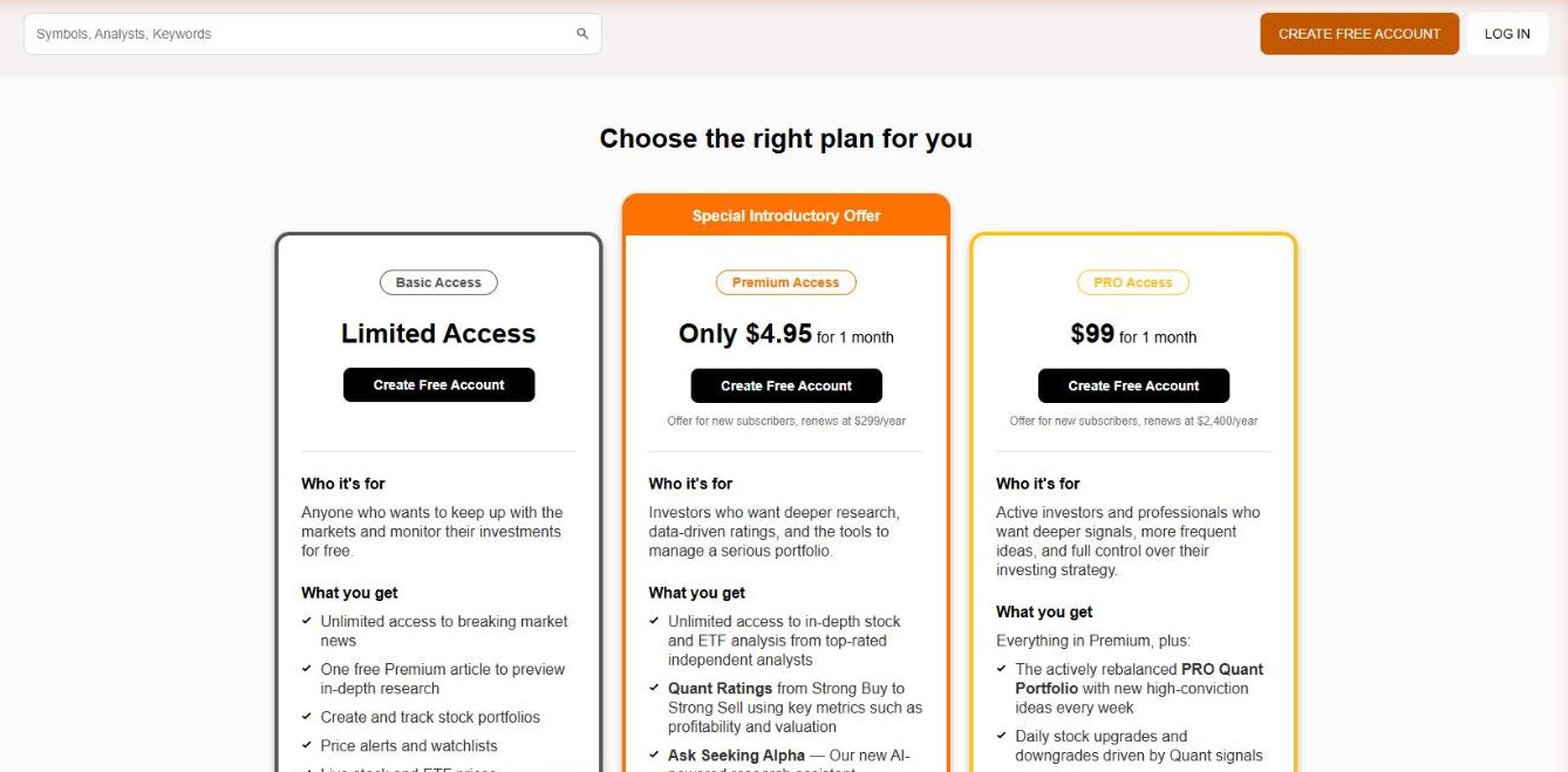
- Best for written analysis and Quant Ratings.
- Premium renews at $299 a year, after $4.95 for the first month.
- Stock and ETF screeners on Premium.
- 10 fiscal years of statements on Premium.
- Earnings call transcripts on Premium.
- SEC filings and ownership data on each stock.
- PRO renews at $2,400 a year, after $99 for the first month.
Seeking Alpha replaces a different part of Stock Rover: the reading. Most covered companies have long articles arguing both sides, and the Quant Rating rolls grades for valuation, growth, profitability, momentum and EPS revisions into one score you can screen on. At $299 a year, Premium costs less than Stock Rover's Premium on annual billing, which is $348.
Where it falls short: screening needs Premium, which is sold by the year. We found no segment or KPI data on its stock pages, exports cover only its stock comparison tool, and there is no API or MCP server.
Simply Wall St
Simply Wall St turns each company into an illustrated report, with its Snowflake score, fair value and community narratives, and builds its screener and portfolios around those reports. Its financial data comes from S&P Global.
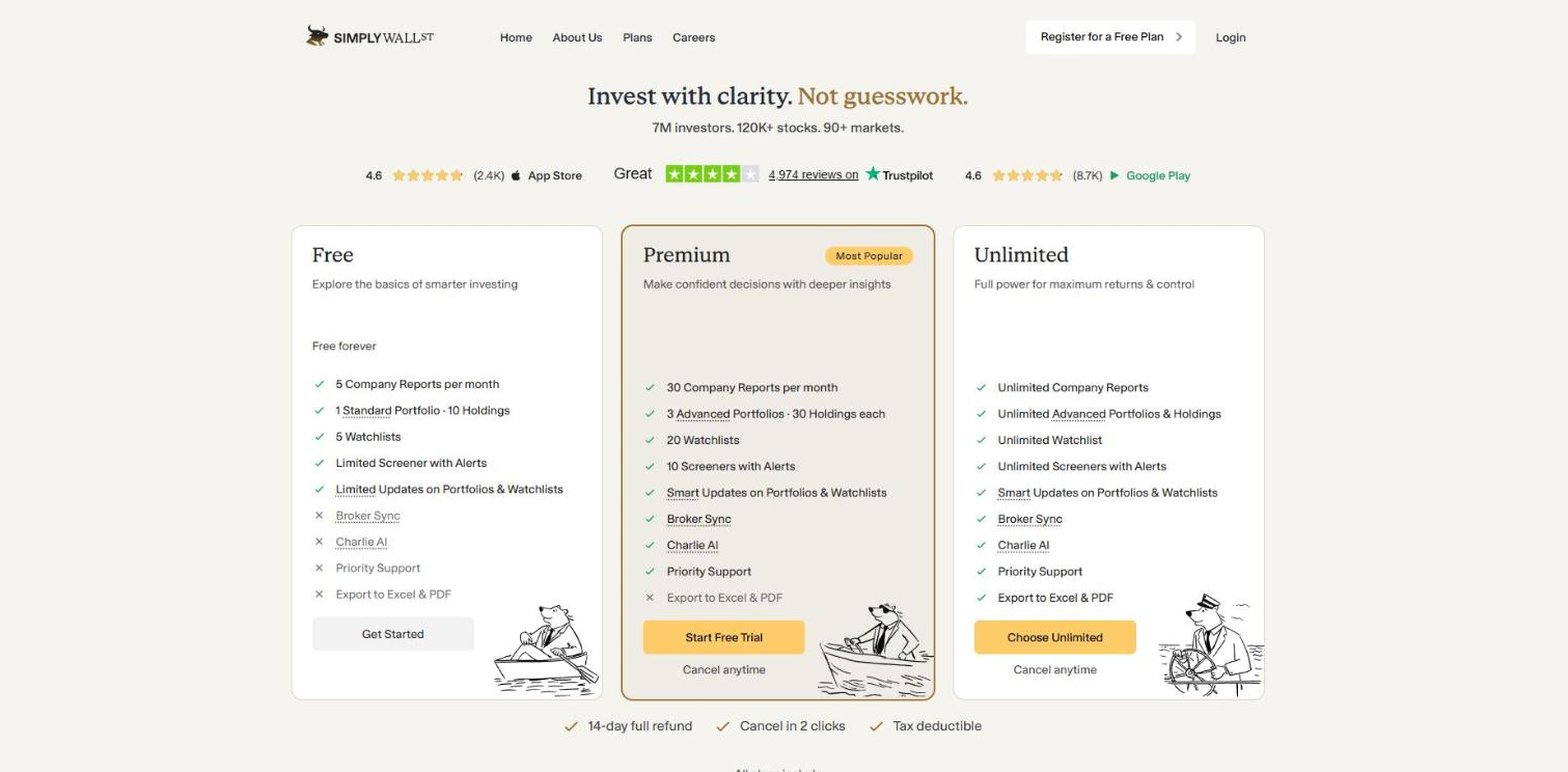
- Best for visual company reports and fair value narratives.
- Free plan with 5 company reports a month and one portfolio of 10 holdings.
- Limited free screener, showing the top 4 results.
- Premium from $10.95 a month, with 30 reports and 10 screeners.
- Unlimited from $21.50 a month, with export to Excel and PDF.
- Ownership and insider trades on each company.
- 120K+ stocks in 90+ markets.
For a Stock Rover user who mostly opened company pages to judge quality and value, Simply Wall St's reports do that job visually. Premium tracks 3 portfolios of 30 holdings with broker sync, for less than half the price of Stock Rover's cheapest plan.
Where it falls short: the plans meter company reports rather than years, and Simply Wall St does not publish how much history it shows. Its revenue breakdown covers only the latest twelve months, export starts on Unlimited, and there is no KPI data, filing list or API.
Stock Analysis
Stock Analysis is a clean research site covering more than 130,000 stocks and funds worldwide. Each company page carries the statements, ratios and a metrics tab with revenue by segment and company-specific numbers.
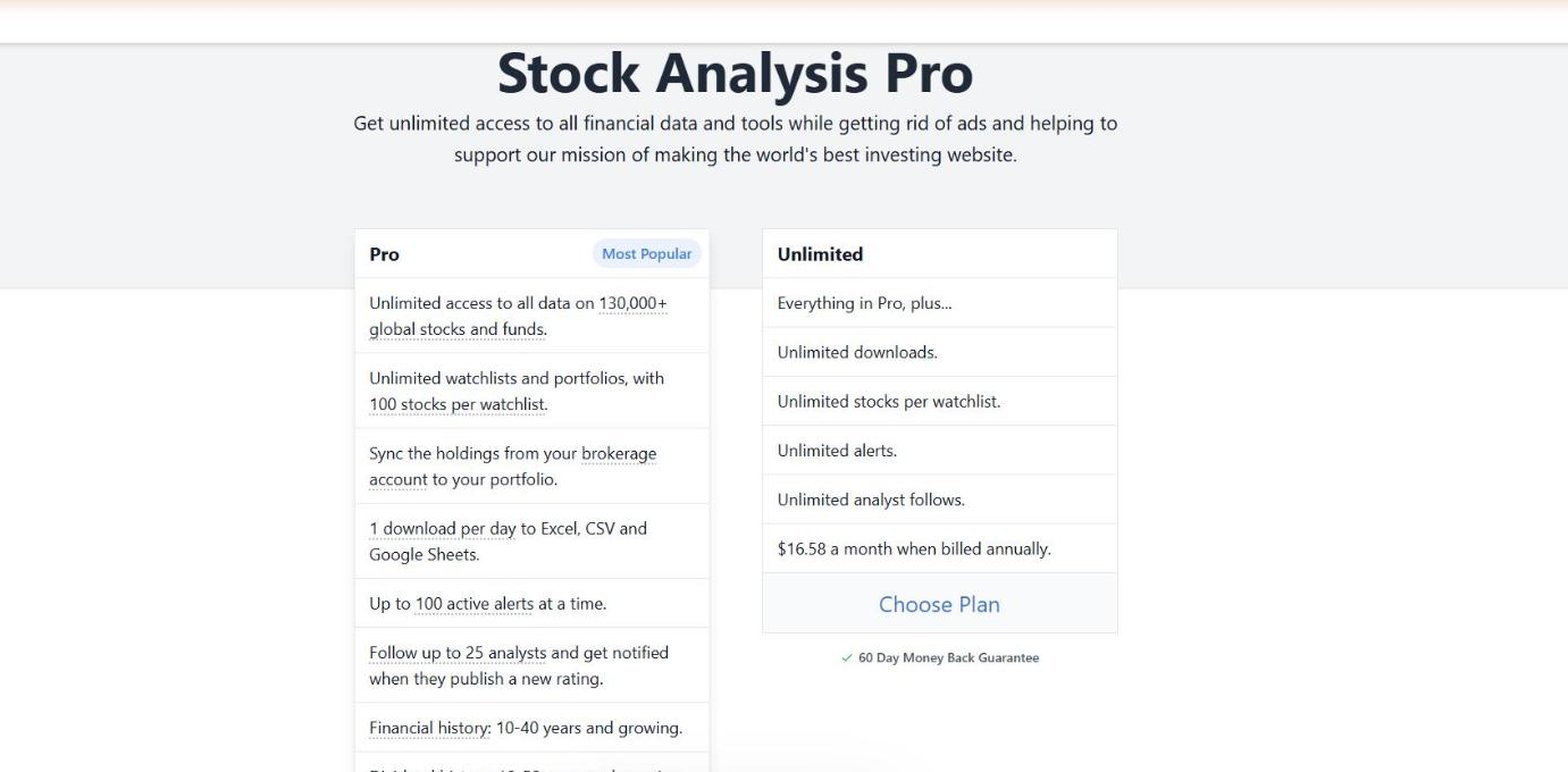
- Best for long statement history on a small budget.
- Free screener, 5 fiscal years of statements and a portfolio tracker.
- Pro from $6.58 a month, or $9.99 billed monthly.
- 10 to 40 years of financial history on Pro.
- Business metrics for 50,000+ stocks.
- Saved screeners and one download a day on Pro.
- 60-day money-back guarantee.
Stock Analysis covers all 3 jobs at the lowest price here. Its screener runs on more than 300 indicators at no cost, the free portfolio shows value and profit and loss by holding, and Pro opens the long history Stock Rover now sells on its higher plans.
Where it falls short: the portfolio is a holdings tracker rather than an analytics suite, with no benchmark or money-weighted return. Pro allows one download a day, and there is no ownership data, filing list, API or MCP server.
Stockopedia
Stockopedia is a UK-founded research service built around StockRanks, which score every stock on quality, value and momentum, and around screens that put those scores to work.
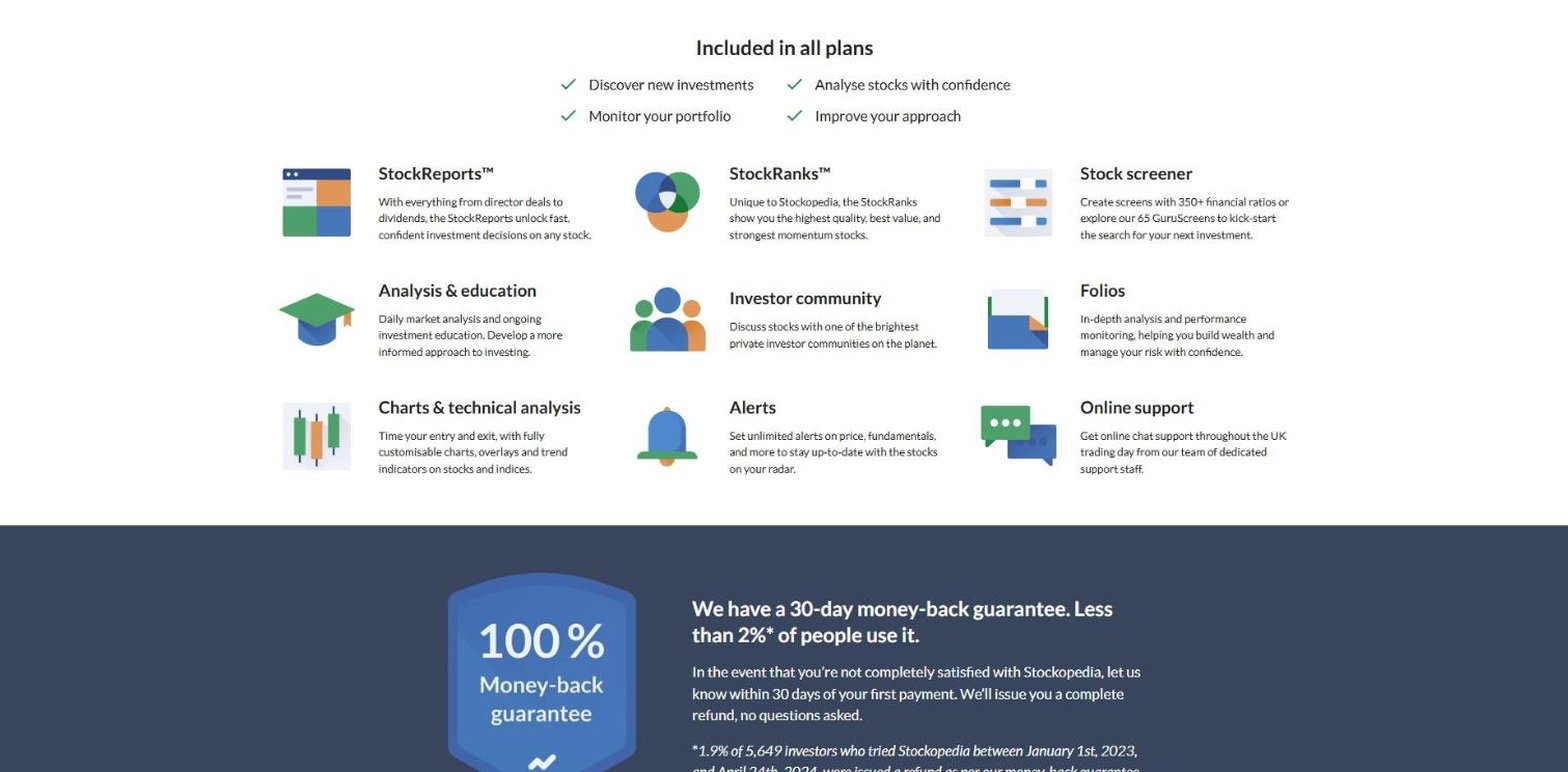
- Best for factor-ranked screening by quality, value and momentum.
- From $45 a month, priced by the markets you choose.
- Screener with 350+ ratios and 65 GuruScreens.
- 10 years of annual and interim statements.
- Major shareholders and directors' dealings.
- Folios for portfolio tracking, with CSV import.
- 14-day trial, card required, and a 30-day money-back guarantee.
Stockopedia is the alternative closest to Stock Rover's scoring side. StockRanks flag the highest-quality, best-value and strongest-momentum stocks, 65 ready-made GuruScreens give you a starting point for your own, and screens and Folios download to Excel or CSV.
Where it falls short: every feature sits behind the subscription, and it has the highest entry price on this list. There is no segment or KPI data and no API, and its rankings do more of the choosing for you than any other tool here.
TIKR
TIKR is a global fundamentals terminal sold at retail prices, built on S&P Capital IQ data for more than 100,000 stocks in 92 countries. Its free plan covers US stocks.
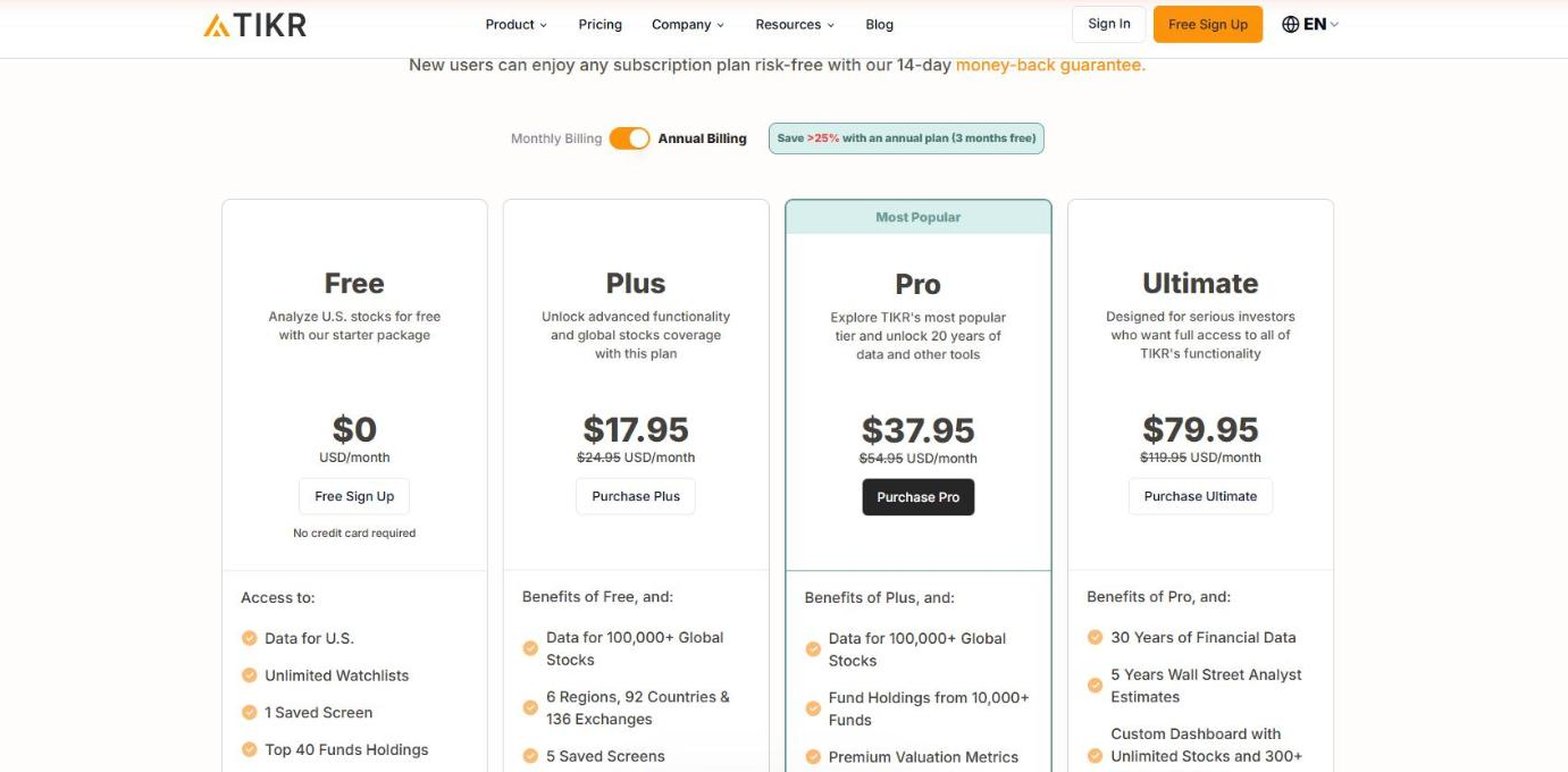
- Best for global fundamentals and segment history.
- Free plan with US data, a screener and one saved screen.
- Plus from $17.95 a month, or $24.95 billed monthly.
- 10 years and 20 quarters on Plus, 30 years on Ultimate.
- Segment data and export on Pro, from $37.95.
- Ownership, company filings and earnings call transcripts.
TIKR is the research half of Stock Rover at a lower price. Plus reaches 10 years of statements for less than Stock Rover's Premium, and TIKR shows what other investors hold, from the top 40 funds on Plus to more than 10,000 investors on Ultimate.
Where it falls short: TIKR has watchlists, not portfolios. Its help centre says it cannot record position sizes or cost basis, so your returns have to be tracked elsewhere. Segments and export need Pro, there is no API, and the pricing page lists the free plan's history as 3 years on its card and 5 years in the grid.
TradingView
TradingView is the charting platform most traders already know, with a fundamentals layer underneath that many investors never open: a stock screener, full statements, revenue by segment and SEC filings.
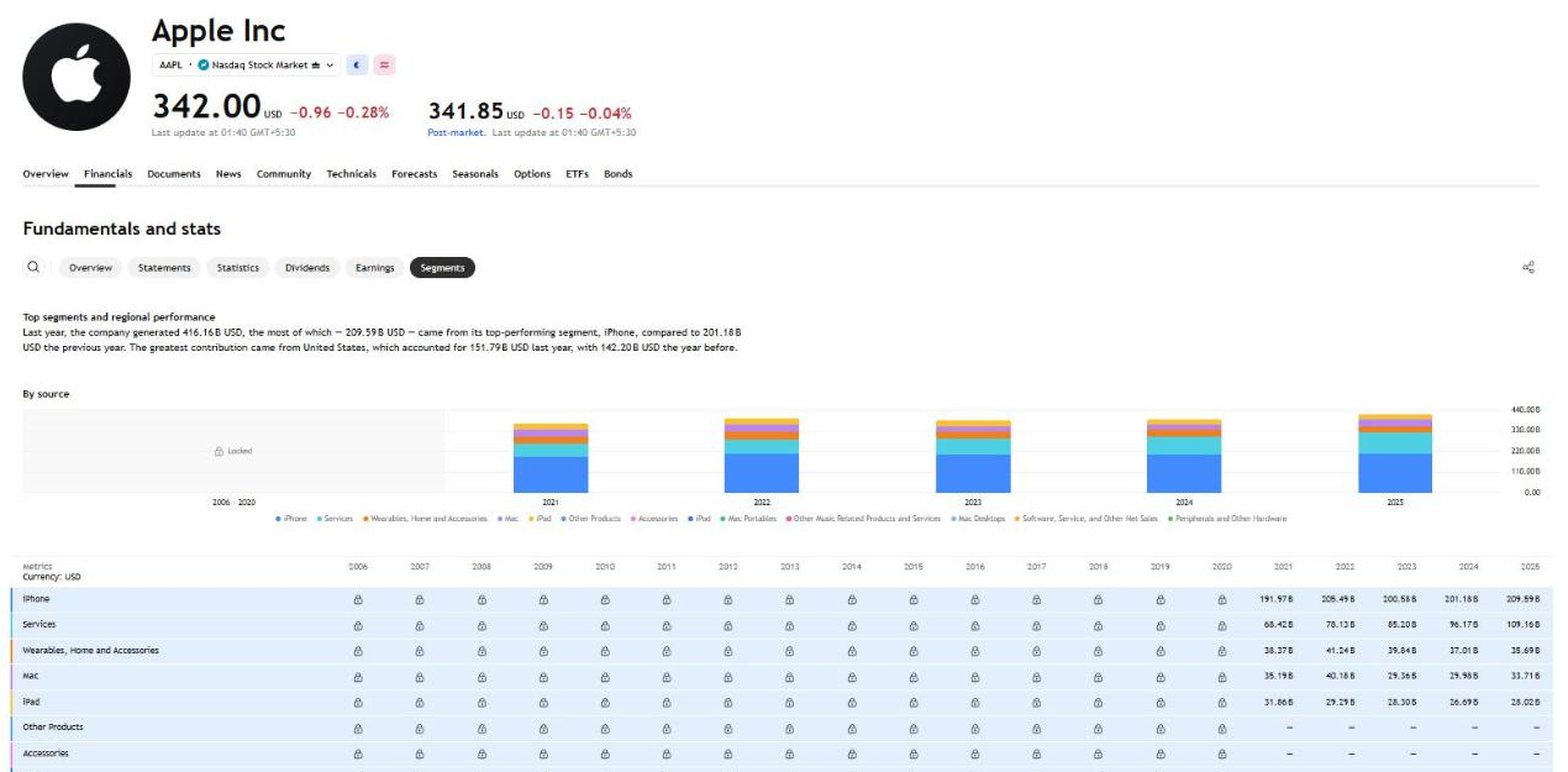
- Best for charting with fundamentals attached.
- Free Basic plan with the screener and one portfolio of 20 holdings.
- Essential from $12.95 a month.
- Statements back to 2006, with older years locked on Basic.
- Segments by source and country.
- SEC filings and other company documents.
- MCP server on Essential and above, in beta.
For a Stock Rover user who also kept a charting account, TradingView can replace both. The screener runs signed out with valuation, profitability and statement columns, the portfolio records transactions and shows how your holdings perform, and Essential adds chart data export.
Where it falls short: the fundamentals are a layer on a trading product rather than its centre. We found no company KPIs or ownership data on its stock pages, the free portfolio holds 20 positions, and there is no data API.
Yahoo Finance
Yahoo Finance is the quote and news site most investors already have open, with a free screener and free portfolios. Its paid tiers add portfolio analytics on Bronze, research on Silver, and about 40 years of statements on Gold, the longest history advertised on this list.
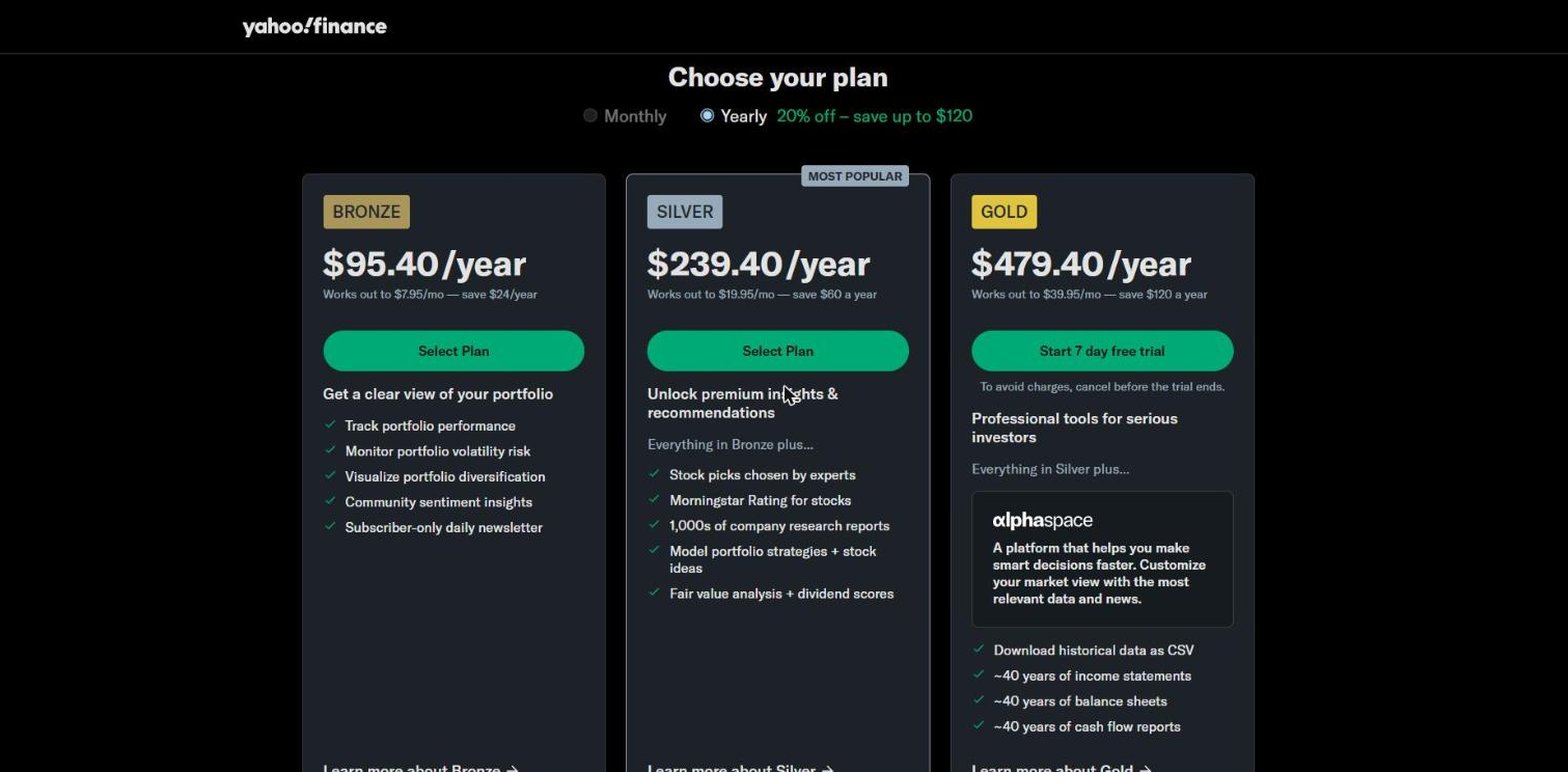
- Best for quotes, news and very long history.
- Free screener covering 50 regions.
- Free portfolios, linked to a broker or entered by hand.
- Bronze from $7.95 a month, for portfolio performance and risk.
- Silver $19.95, with fair value analysis and research reports.
- Gold $39.95, with ~40 years of statements and CSV download.
Its strength is convenience. The statements sit in one place with the quotes, news and portfolios, and the Holders tab shows institutional and insider ownership for each stock. Gold also comes with a 7-day trial.
Where it falls short: Bronze and Silver add no statement history or downloads, so a Stock Rover user who wants 10 years or more has to price Gold, at $39.95 a month on yearly billing. There is no segment or KPI data, no filing list and no public API.
Business Quant
Business Quant is ours. We build our fundamentals in house rather than licensing them from a data vendor, and our screener, stock pages and portfolio tracker all run on that one set of data.
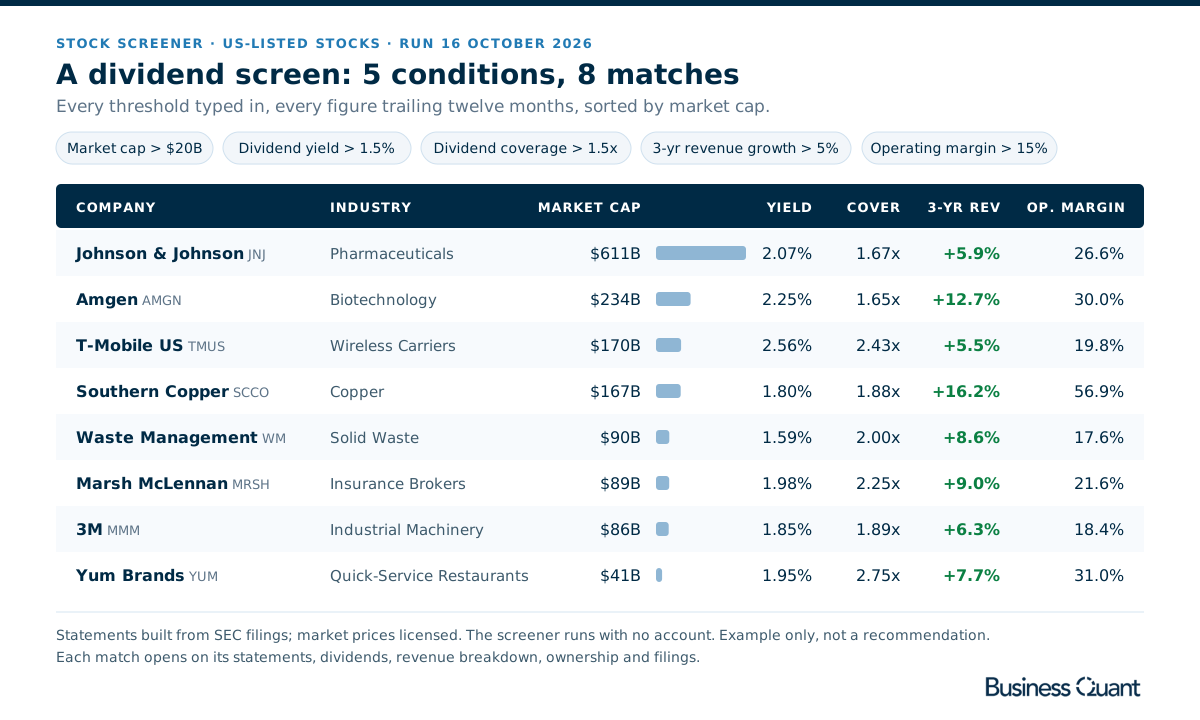
- Best for screening, segment and KPI research, and portfolio XIRR on one set of data.
- Free to use, 5 years and 20 quarters, no card.
- Pro from $29 a month, full history, export and API access.
List of features
- Stock screener
- Portfolio tracker: XIRR, benchmark and allocation
- Financial statements: annual, quarterly and TTM
- 4 standardised statement templates: general, real estate, utilities and capital markets
- Financial results from 10-K, 10-Q, 8-K, 20-F, 40-F and 6-K filings
- Ratios and growth metrics
- History page for every line item
- CSV and XLSX download
- Segment financials
- KPI and operating data
- Analyst estimates
- Dividends
- BQ-MICS industry classification: 11 sectors, 71 industry groups, 288 industries
- Industry financials
- Peers
- Time series tables
- Advanced charting
- Institutional ownership and insider trades
- 18 million+ SEC filings since 1993
- Economic data
- ETF and mutual fund screener
- Fund comparison
- Market heatmap
- API access
- MCP server
- Results within 10 to 15 minutes of release
The screener covers more than 700 metrics: the income statement, balance sheet and cash flow statement line by line in annual, quarterly and TTM form, plus growth rates, margins, valuation and dividend ratios. The screen in the figure is one a Stock Rover dividend investor would build, and it runs without an account. Every match opens on a stock page with its statements, segments, KPIs, estimates, dividends, ownership and filings. The portfolio tracker takes your trades or a CSV import and reports total return, XIRR, trailing dividend yield, performance against a benchmark, and position and sector allocation.
Statements are standardised on one of 4 templates (general, real estate, utilities or capital markets), so a bank shows bank line items rather than a retailer's. We take results from 10-K, 10-Q, 20-F and 40-F filings, and also from the 8-K and 6-K filings that carry earnings releases, so a new quarter appears within 10 to 15 minutes of the release. Pro opens every company's full statement history, segment and KPI data for up to 15 years and 40 quarters, CSV and XLSX downloads and our API, and the MCP server brings the same data into Claude and ChatGPT. For funds, the ETF and mutual fund screener filters more than 32,000 share classes on 102 metrics, and our ETF screener comparison sets it against the alternatives.
Stock Rover alternatives feature by feature
| Platform | Portfolio tracking |
Spreadsheet export |
Industry‑specific statements |
Segment financials |
Company KPIs |
Insider & Inst. Ownership |
SEC filings |
Economic data |
API access |
MCP server |
Plans from |
|---|---|---|---|---|---|---|---|---|---|---|---|
| Business Quant | ✓ | ✓ | ✓ | ✓ | ✓ | ✓ | ✓ | ✓ | ✓ | ✓ | $29/mo |
| TradingView | ✓ | ✓ | ✓ | ✓ | ✗ | ✗ | ✓ | ✓ | ✗ | ✓ | $12.95/mo |
| Finviz | ✓ | ✓ | ✓ | ✓ | ✗ | ✓ | ✓ | ✗ | ✗ | ✗ | $24.96/mo |
| Koyfin | ✓ | ✗ | ✓ | ✗ | ✗ | ✓ | ✓ | ✓ | ✗ | ✗ | $39/mo |
| Stock Analysis | ✓ | ✓ | ✓ | ✓ | ✓ | ✗ | ✗ | ✗ | ✗ | ✗ | $6.58/mo |
| Stockopedia | ✓ | ✓ | ✓ | ✗ | ✗ | ✓ | ✗ | ✗ | ✗ | ✗ | $45/mo |
| Morningstar | ✓ | ✗ | ✓ | ✗ | ✗ | ✓ | ✗ | ✗ | ✗ | ✗ | $20.75/mo |
| Seeking Alpha | ✓ | ✗ | ✗ | ✗ | ✗ | ✓ | ✓ | ✗ | ✗ | ✗ | $299/yr |
| TIKR | ✗ | ✗ | ✗ | ✓ | ✗ | ✓ | ✓ | ✗ | ✗ | ✗ | $17.95/mo |
| Yahoo Finance | ✓ | ✗ | ✓ | ✗ | ✗ | ✓ | ✗ | ✗ | ✗ | ✗ | $7.95/mo |
| Simply Wall St | ✓ | ✗ | ✗ | ✗ | ✗ | ✓ | ✗ | ✗ | ✗ | ✗ | $10.95/mo |
Sorted by ticks, ties broken alphabetically. A tick means the platform's own pages or help centre document the feature on a self-serve plan; a cross means we found no such documentation. Every product here has a stock screener, so screening has no column. "Portfolio tracking" means recording holdings with their cost; TIKR offers watchlists only. "Spreadsheet export" refers to the cheapest paid plan: TIKR reserves export for Pro, Simply Wall St for Unlimited and Yahoo Finance for Gold, and Seeking Alpha exports only its stock comparison. "Industry-specific statements" means a bank, for example, is shown with bank line items such as net interest income and loan-loss provisions rather than a generic template; we checked JPMorgan's income statement on each site or in its documentation. "Segment financials" means revenue by segment, product or geography over several years. "Company KPIs" means operating metrics such as subscribers or deliveries. "Insider & Inst. Ownership" covers insider trades or holdings and institutional holders. "SEC filings" means a company's filing list. "Economic data" means macro series such as GDP, inflation and interest rates, not only an economic calendar. "API access" and "MCP server" mean a self-serve API and an AI-assistant connector; Morningstar sells both only to enterprise customers.
Business Quant is the only product here that ticks every column. TradingView comes closest: besides portfolios, export, segment revenue and filing lists, it has industry-specific statements, economic data and an MCP server, but no company KPIs, ownership data or data API. Finviz follows with insider and institutional ownership data, and Stock Analysis is the only other product here with company KPIs. A cross shows what a product was built for, not how good it is.
What about Ziggma and Snowball Analytics?
Both come up often in the same searches, and both were checked against the same test as the rest of the list: a fundamental stock screener plus a company page with all 3 financial statements. Ziggma is a portfolio tool with a stock and ETF screener and its own stock scores, but its plan and feature pages list no financial statements view. Snowball Analytics is a portfolio and dividend tracker whose plan grid lists company fundamentals history but no stock screener. Both are strong portfolio trackers, and both appear in our portfolio tracker comparison.
Which Stock Rover alternative is right for you?
- You mostly screen and want it free: Finviz, with 50 portfolios on a free account.
- You want dashboards and global market views: Koyfin.
- You want an analyst's fair value next to the numbers: Morningstar Investor.
- You read before you buy: Seeking Alpha Premium.
- You judge companies from a visual report: Simply Wall St.
- You want 10 years or more for a few dollars a month: Stock Analysis Pro, from $6.58 a month.
- You screen on quality, value and momentum scores: Stockopedia.
- You follow companies outside the US: TIKR, with 92 countries from its Plus plan.
- You chart as much as you screen: TradingView.
- You want about 40 years of statements: Yahoo Finance Gold.
- You want screening, segment and KPI research and portfolio XIRR on one set of data: Business Quant.
Where I would move first
If your Stock Rover habit is formula screens and 20 years of fundamentals, you are paying for features few tools match, and moving may cost you more than it saves. For everyone else, I would start with Business Quant.
Take the 3 jobs in turn. The screener runs without an account, so you can rebuild your Stock Rover screens before signing up. Each match opens on statements, segments, ownership and filings, updated within 10 to 15 minutes of a company's release. And the portfolio tracker reports XIRR against a benchmark, with sector allocation and dividend yield, at no cost.
The free account shows 5 fiscal years, the same as Stock Rover's Premium. Pro, from $29 a month, opens the full record along with segment and KPI data, export and our API.
Try this before your renewal date: export your Stock Rover holdings to CSV, import them into our portfolio tracker, and rebuild your most-used screen. If the XIRR and the matches look right, you have your answer.
How this comparison was made
To make the list, a product had to do what most people use Stock Rover for: screen US-listed stocks on fundamental metrics, and show a company's income statement, balance sheet and cash flow statement, confirmed on the vendor's own pages, at no cost or at a self-serve price the vendor publishes. Portfolio tracking was compared but not required. 11 products met that bar.
Every price, plan limit and feature was read on each vendor's own pricing, plan, screener, help or stock pages on 16 October 2026, and the screenshots were taken there. Prices are each platform's lowest advertised monthly price that day, in US dollars; Seeking Alpha advertises only a yearly renewal. Stock Rover's May 2026 prices come from an archived copy of its own plans page. The Business Quant screen in the illustration was run on the same day.
The reviews, the list and the summary table run alphabetically, with Business Quant last, and the feature table is sorted by the number of ticks, with ties broken alphabetically. We make Business Quant, one of the 11 products compared here.
Image credits. Header photograph by Anne Rosly on Unsplash, used under the Unsplash License. Vendor screenshots were captured on 16 October 2026 from each provider's own pricing, plan or stock pages and are reproduced for comparison. Simply Wall St plan prices, which display in local currency outside the US, were hidden in its screenshot; its US dollar prices are taken from the same page. The screener illustration is our own, built from a live screen.
Frequently asked questions
Is Stock Rover free?
Partly. Stock Rover has a free plan that it describes as designed for basic research on individual stocks and keeping up with the markets. Its plan comparison lists screening, portfolio analytics and historical fundamentals on the 4 paid plans: Premium, Premium Plus, Ultimate and Ultimate Pro. Every paid plan has a 14-day trial, and Stock Rover says the trial needs no credit card.
How much does Stock Rover cost in 2026?
On 16 October 2026 Premium cost $34 a month on monthly billing, $29 a month billed annually ($348 a year) or $24 a month on 2-year billing ($576 every 2 years). Premium Plus was $70, $49 or $42; Ultimate $99, $79 or $69; Ultimate Pro $199, $149 or $129. In May 2026 the cheapest plan, Essentials, was $7.99 a month on monthly billing.
What is the best free alternative to Stock Rover?
For fundamental screening, company research and portfolio tracking at no cost, Business Quant is free to use with no card: the stock screener covers more than 700 metrics, every US-listed stock has statements, segments, ownership and filings pages, and the portfolio tracker reports XIRR against a benchmark. Stock Analysis and TradingView also combine a free screener with a free portfolio, and Finviz, Yahoo Finance and Koyfin run free screeners with portfolio features.
Is Stock Rover worth it?
It depends on which of its features you use. Stock Rover's strengths are equation-based and historical screening from Premium Plus, 20 years of fundamentals from Ultimate, and portfolio analytics with brokerage integration on every paid plan. If you mainly screen on standard fundamentals, read statements and track holdings, several tools in this list do those jobs for less, and some at no cost.
Which is better, Stock Rover or Koyfin?
They are built for different work. Stock Rover is organised around tables, screens and portfolios, with fundamentals history priced by plan: 5, 10 or 20 years. Koyfin is a dashboard and charting terminal with global coverage; its free plan includes a stock screener, 2 years of statements and one portfolio account, and Plus at $39 a month on annual billing adds 10 years and an ETF screener.