9 Best Dividend Trackers for 2027
Every dividend tracker shows a yield. Which ones show the ex-date, the payout history and the next dividend stock worth owning?


A dividend tracker fills in the dividends your stocks pay from its own data, so you do not type in each payment, and shows what you have received and what is due next. Most also show each stock's payout history, and a few list dividends across the whole market or screen for new dividend stocks.
Below are 9 dividend trackers that run on the web, from free trackers to paid research services. We compare them on what you can track at $0, ex-date history, market-wide dividend lists, dividend screening, API access and MCP servers.
Why the ex-date matters more than the pay date
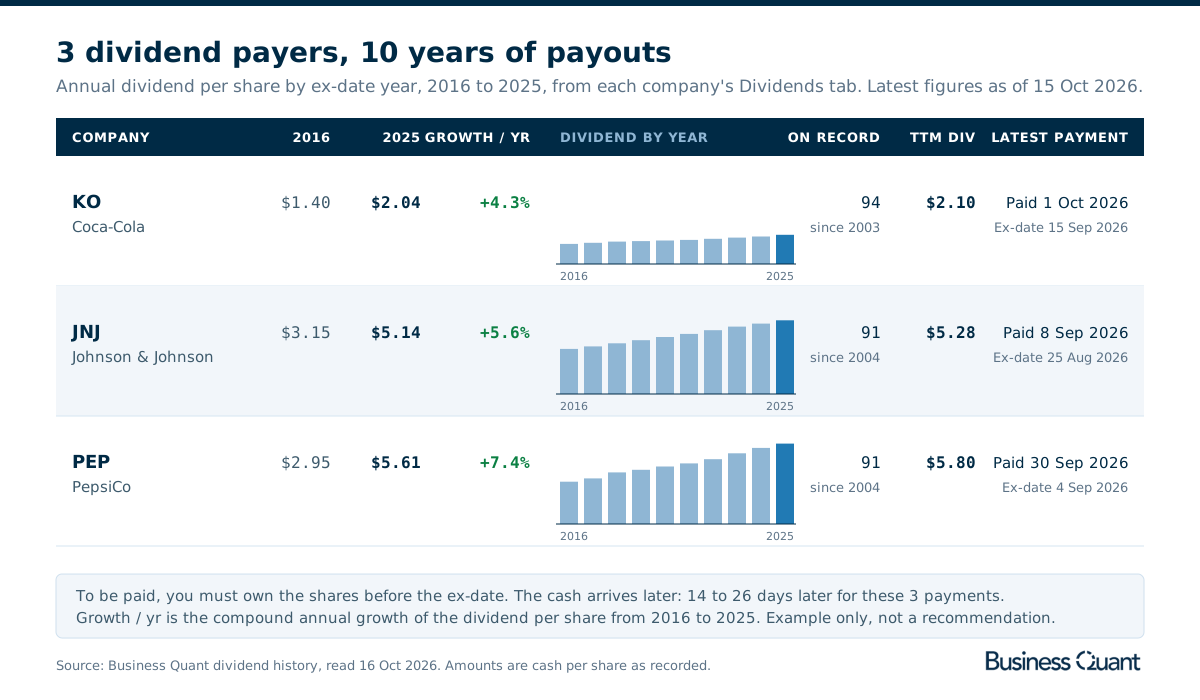
To receive a dividend you must own the shares before the ex-dividend date; the cash arrives later, on the pay date. Coca-Cola's latest dividend of $0.53 a share went ex on 15 September 2026 and was paid on 1 October 2026, so anyone who bought on 15 September did not receive it. Johnson & Johnson's last dividend was paid 14 days after its ex-date and PepsiCo's 26 days after, so a tracker that lists only pay dates is 2 to 4 weeks behind the decision you actually have to make.
The payout history matters for a different reason: today's yield hides the trend. Between 2016 and 2025, Coca-Cola's annual dividend rose from $1.40 to $2.04 a share, about 4.3% a year, while PepsiCo's rose from $2.95 to $5.61, about 7.4% a year, and nearly doubled. Both look like steady payers on a quote page; only the record of payments shows which one has grown its dividend faster, and it shows a cut as soon as one happens.
How to choose a dividend tracker
- Dividends you never type. Payouts filled in from the tracker's own data.
- Ex-dates as well as pay dates. The date you must own by, not only the date cash arrives.
- Payout history. Years of payments, so you can see growth and cuts.
- A view beyond your holdings. Dividends across the market, not only your own stocks.
- A way to find new payers. A screener on yield, coverage and payout ratio.
- API and MCP access. Whether a program or an AI assistant can read the data for you.
For performance rather than income, such as XIRR against a benchmark, our portfolio tracker comparison covers that side.
The 9 dividend trackers at a glance
- Digrin
- DivTracker
- Seeking Alpha
- Sharesight
- Simply Safe Dividends
- Snowball Analytics
- Stock Events
- Track Your Dividends
- Business Quant
| Platform | Best for | Plans from |
|---|---|---|
| Digrin | Dividend growth investors who log every trade | See note |
| DivTracker | Simple income tracking on iPhone and web | $2.50/mo |
| Seeking Alpha | Dividend grades next to written analysis | $299/yr |
| Sharesight | Dividend and tax reporting | $7/mo |
| Simply Safe Dividends | Dividend safety and cut warnings | $39/mo |
| Snowball Analytics | Income calendar and yield on cost | $6.67/mo |
| Stock Events | Ex-date reminders and estimated payouts | $7.99/mo |
| Track Your Dividends | Manual dividend portfolios at no cost | $9.99/mo |
| Business Quant | Payout history, ex-dates and dividend screening, with export and API access | $29/mo |
Rows are alphabetical, Business Quant last. "Plans from" is the cheapest paid plan's lowest advertised monthly price on 16 October 2026; Seeking Alpha advertises an annual renewal only, and Digrin publishes its prices in euros only.
Dividend trackers reviewed
Digrin
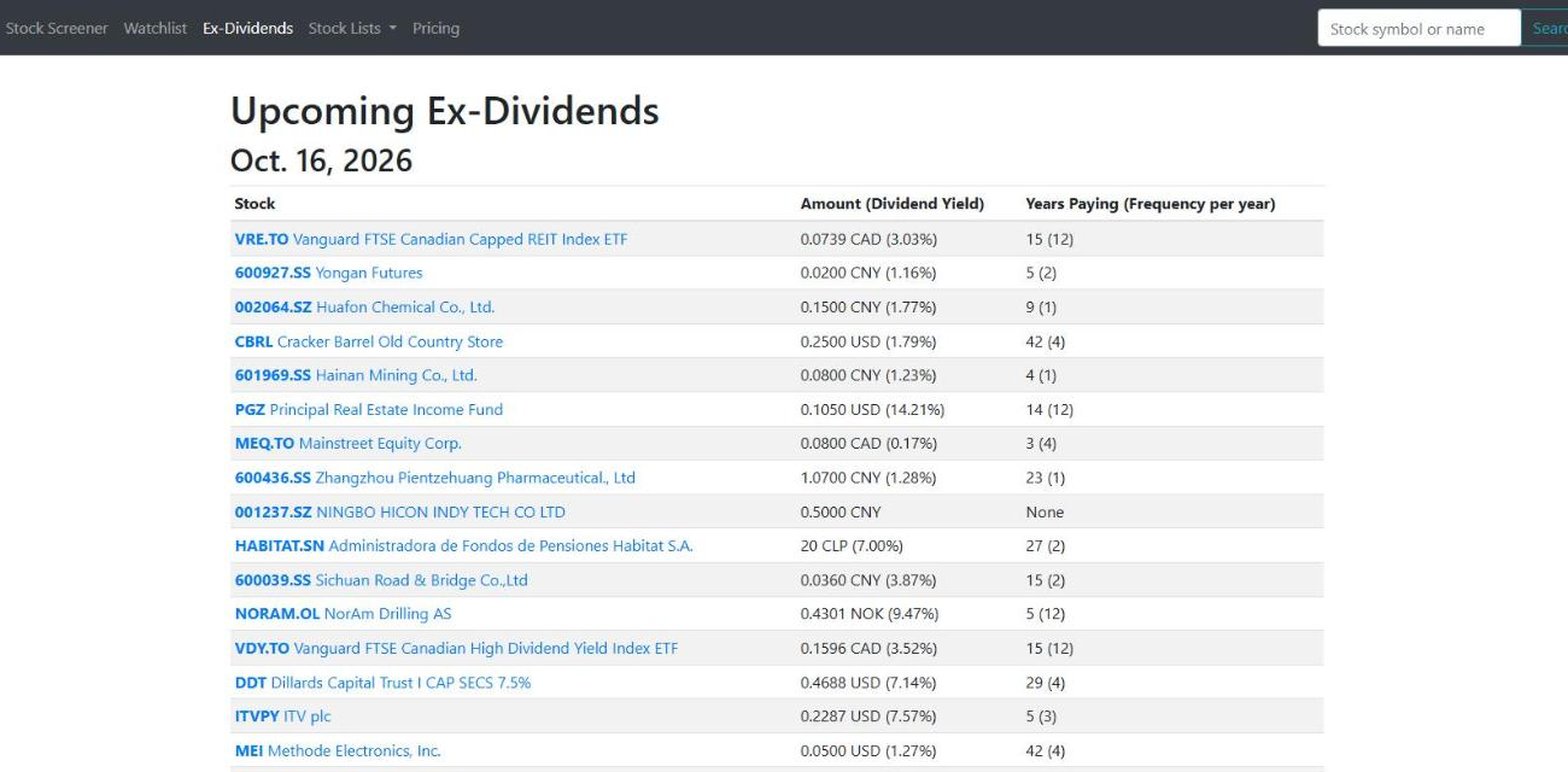
Digrin is a dividend portfolio tracker built by a dividend investor and running since 2014. Its stock pages, its upcoming ex-dividend list and an example of its screener can all be read without an account.
- Best for dividend growth investors who log every trade.
- $0 plan: one portfolio, 30 transactions a month.
- Dividend calendar 6 months forward at $0, 2 years on Plus.
- Stock pages with ex-date, pay date and amount per payment.
- Screener on yield, payout ratio and 3 and 5-year dividend growth.
- CSV import at $0; export from Plus.
Digrin's numbers are built for dividend growth investing: yield on cost, dividend growth rate and XIRR on your portfolio, and on each stock page the 3-year average growth of the dividend, 5.01% for Coca-Cola. The screener comes with preset lists such as dividend Champions, Contenders and Challengers, and Interactive Brokers and Trading212 accounts sync daily.
Where it falls short: plans are priced only in euros, the $0 plan allows 30 transactions a month in a single portfolio, CSV export and tax estimates start on Plus, and there is no API or MCP server.
DivTracker
DivTracker is a dividend tracker for iPhone, iPad and the web. Its aim is simplicity: add your holdings and see your dividend income and upcoming payouts without building anything.
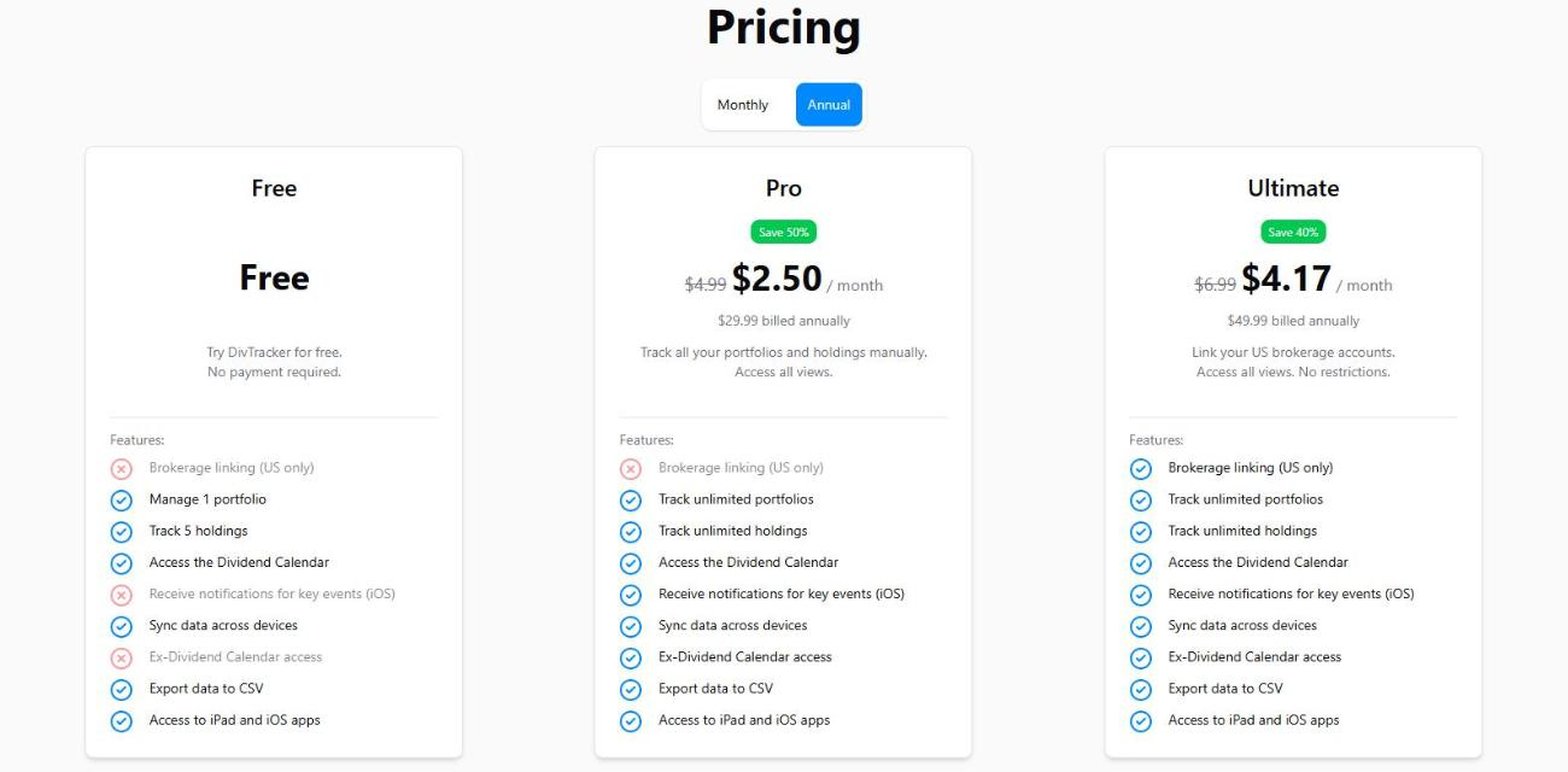
- Best for simple income tracking on iPhone and web.
- $0 plan: one portfolio, 5 holdings, dividend calendar.
- Pro from $2.50 a month, unlimited portfolios and holdings.
- Ex-dividend calendar and iOS notifications on Pro.
- Ultimate from $4.17 a month, adding US brokerage linking.
- CSV export on every plan.
DivTracker has the cheapest paid plan in this comparison, and it says it tracks more than 250,000 holdings across 20,000 portfolios. Its stock pages carry dividend history and figures such as the P/E ratio and payout ratio, and its income views show which holdings your dividends come from.
Where it falls short: 5 holdings makes the $0 plan a trial in practice, the ex-dividend calendar and notifications need Pro, and there is no dividend screener, API or MCP server.
Seeking Alpha
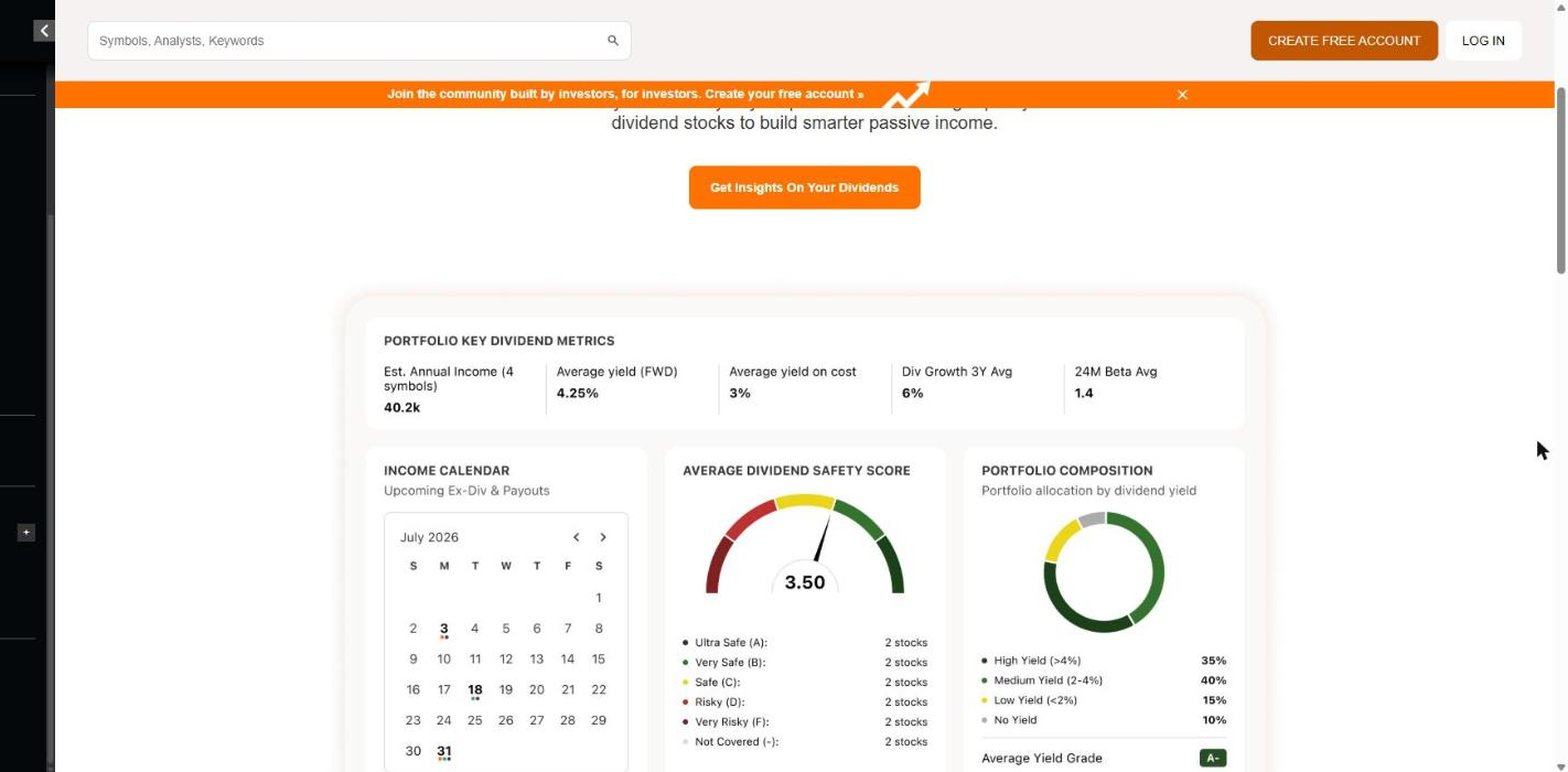
Seeking Alpha is an investing research community with a detailed public dividend record for each stock. Its Dividend Dashboard turns a list of your symbols into an income forecast and a calendar, at no cost with an account.
- Best for dividend grades next to written analysis.
- Dividend Dashboard at no cost with an account.
- Payout history with ex, record, pay and declaration dates.
- Dividend scorecard: yield, growth, safety and estimates.
- Stock screener with a dividend yield filter, on Premium.
- Premium renews at $299 a year, after $4.95 for the first month.
Each Coca-Cola dividend appears with its ex-date, record date, pay date and declaration date, more dates per payment than any other public table here, next to a count of 63 consecutive years of growth. Premium adds the analyst articles, Quant Ratings and screeners that Seeking Alpha is known for.
Where it falls short: the screener and analysis need Premium, which is priced by the year with no monthly option, we found no market-wide ex-dividend list, and there is no public API or MCP server.
Sharesight
Sharesight is a portfolio tracker built around reporting, used by more than 200,000 investors by its own count. Dividends and corporate actions are recorded automatically, and the reports turn them into income and tax figures.
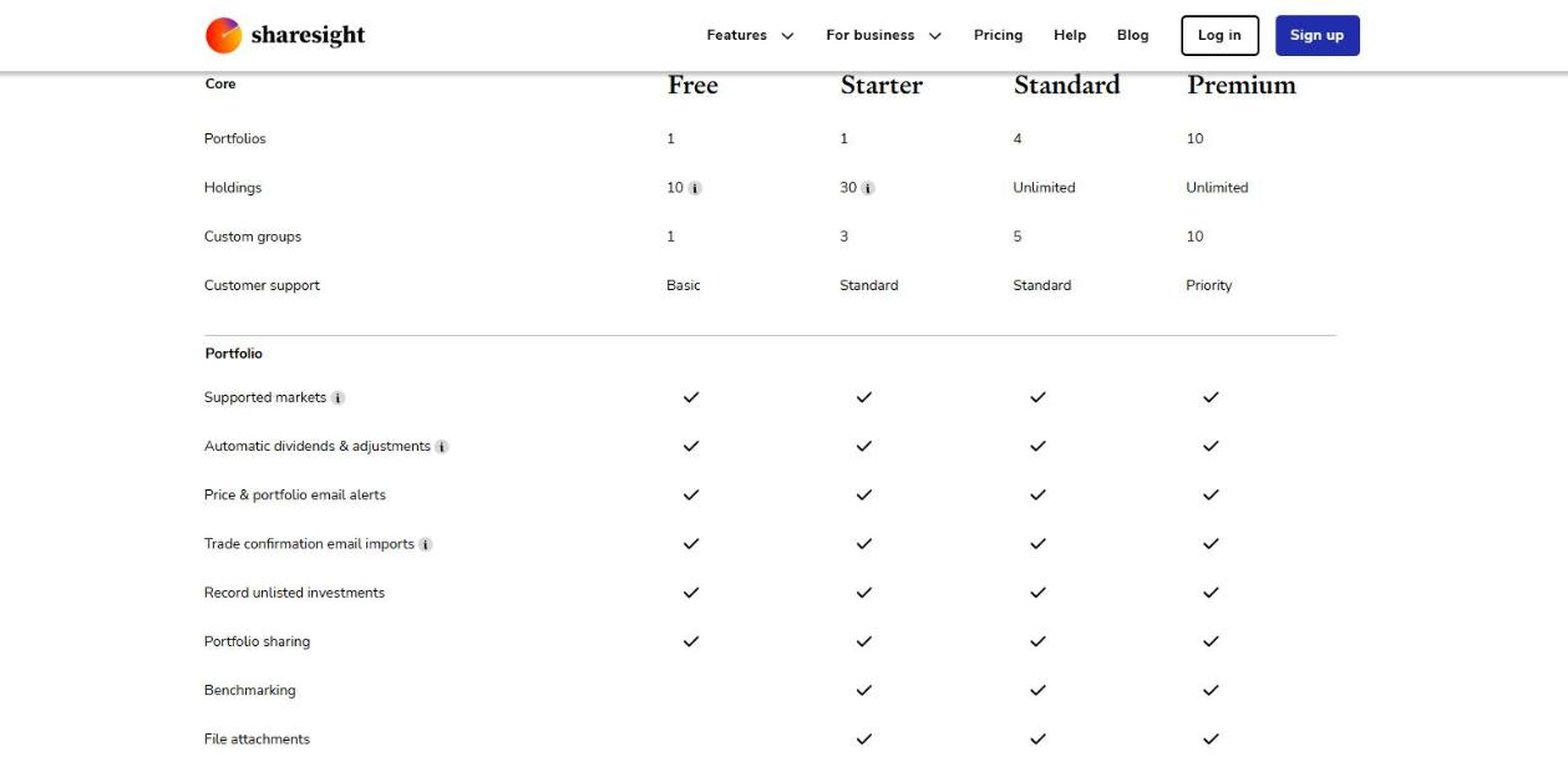
- Best for dividend and tax reporting.
- $0 plan: one portfolio, 10 holdings including closed ones.
- Starter from $7 a month, with the taxable income report.
- Standard from $18 a month, with future income and calendar reports.
- API for Standard, Premium and Business customers, on request.
Sharesight is strongest where dividends meet paperwork: the taxable income report sets out the dividend income you received, and multi-currency valuation on Standard suits investors holding stocks in several countries.
Where it falls short: the $0 plan counts closed positions towards its 10 holdings, the future income report and dividend calendar start on Standard, and there are no public dividend pages, market-wide list or screener for stocks you do not own.
Simply Safe Dividends
Simply Safe Dividends is a dividend research service, running since 2015, built around its Dividend Safety Scores: a rating of how likely each company is to cut its dividend, which it says has avoided 97% of cuts. The portfolio tracker comes with the subscription.
- Best for dividend safety and cut warnings.
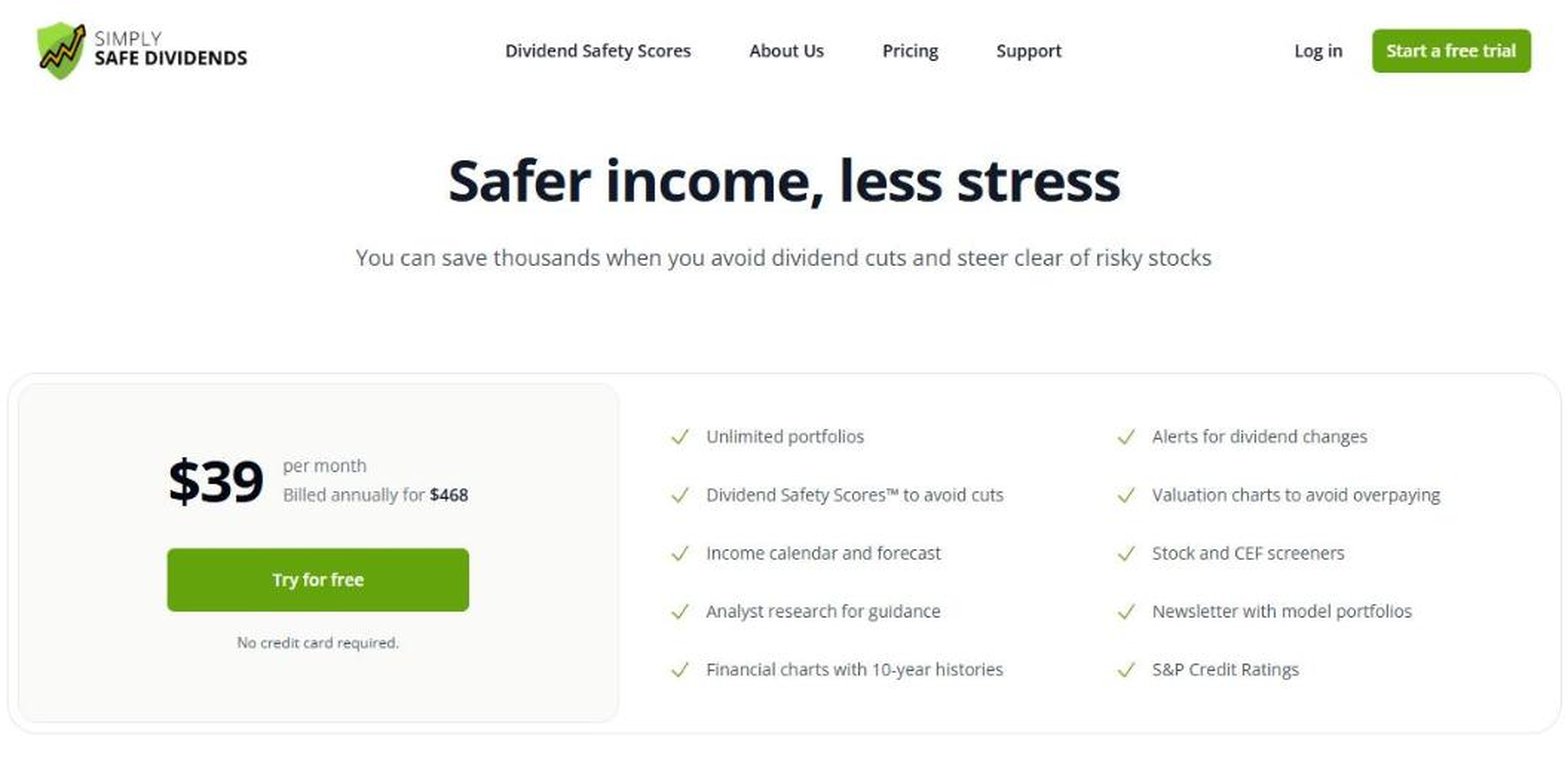
- $39 a month, billed annually only.
- Trial with no card, then a 60-day money-back guarantee.
- Dividend Safety Scores and alerts for dividend changes.
- Income calendar and forecast, unlimited portfolios.
- Stock and CEF screeners, plus analyst research.
This is the most research-led product in the group. Alongside the scores it publishes analyst research, model portfolios in a newsletter, valuation charts, 10-year financial charts and S&P credit ratings, all aimed at one question: will this dividend survive?
Where it falls short: there is no $0 version, the single plan is billed at $468 a year, and there is no API or MCP server.
Snowball Analytics
Snowball Analytics is a dividend and portfolio tracker based in Lyon, France. Its dividend features sit on every plan, including the $0 one.
- Best for an income calendar and yield on cost.
- $0 plan: one portfolio, 10 holdings.
- Starter from $6.67 a month, unlimited holdings and brokerage linking.
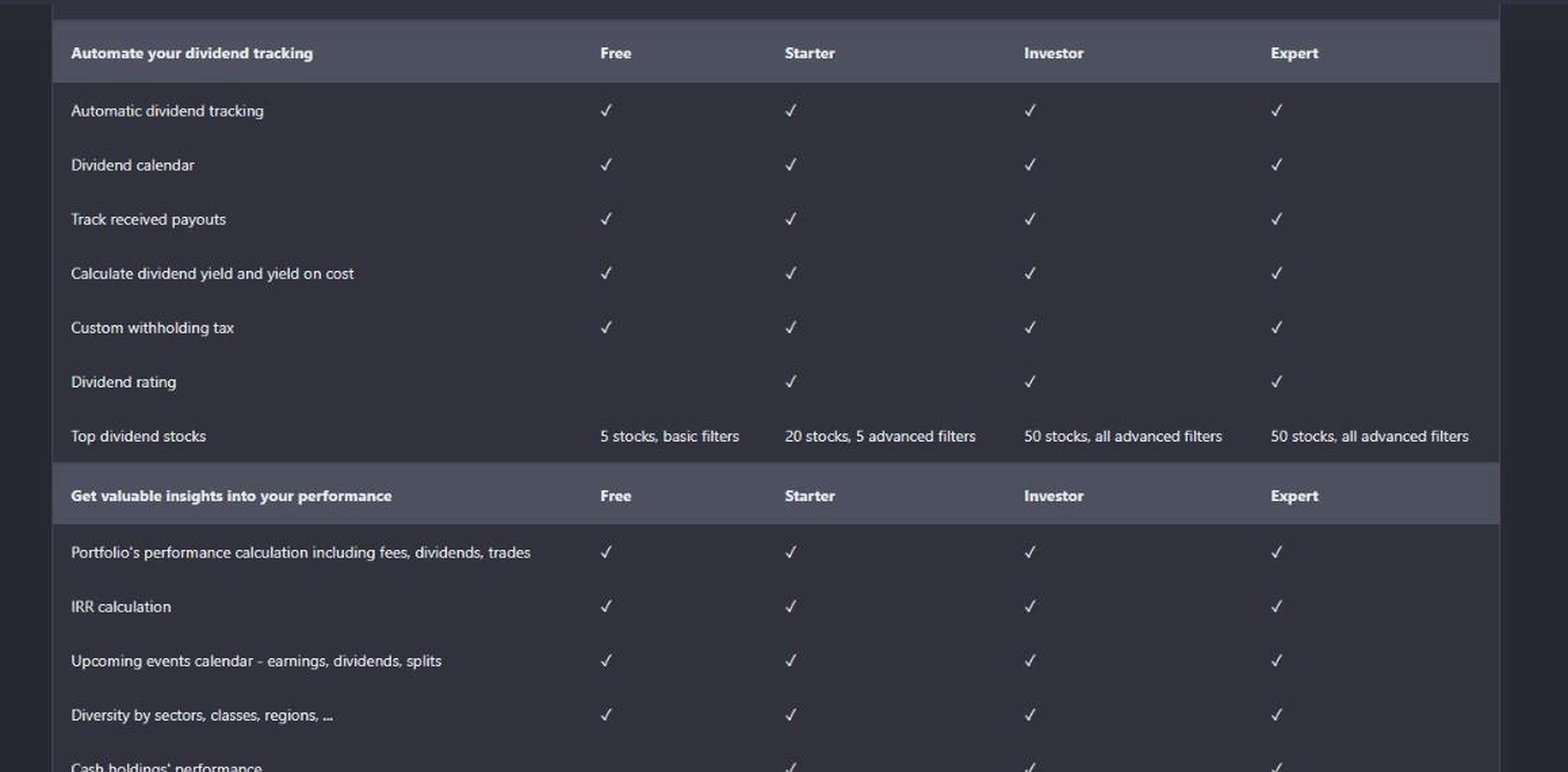
- Received payouts, yield on cost and withholding tax on every plan.
- Public ex-dividend calendar for popular US stocks.
- Top dividend stocks with filters, 5 at $0 and 50 on Investor.
- MCP server for AI assistants, on Expert.
Snowball's public stock pages list each payment with its declaration date, ex-date and pay date, and its ex-dividend calendar shows upcoming payouts across popular US stocks, so it works for stocks you have not bought yet as well as the ones you hold. Dividend ratings and push notifications for dividend events start on Starter.
Where it falls short: most dividend portfolios outgrow 10 holdings, the full dividend stock list needs Investor, the MCP server needs Expert at $249.99 a year, and there is no data API.
Stock Events
Stock Events is an event tracker for your stocks, used by more than a million people by its own count. Dividends are its best-known feature: ex-dates, pay dates and estimates of payments that have not been announced yet.
- Best for ex-date reminders and estimated payouts.
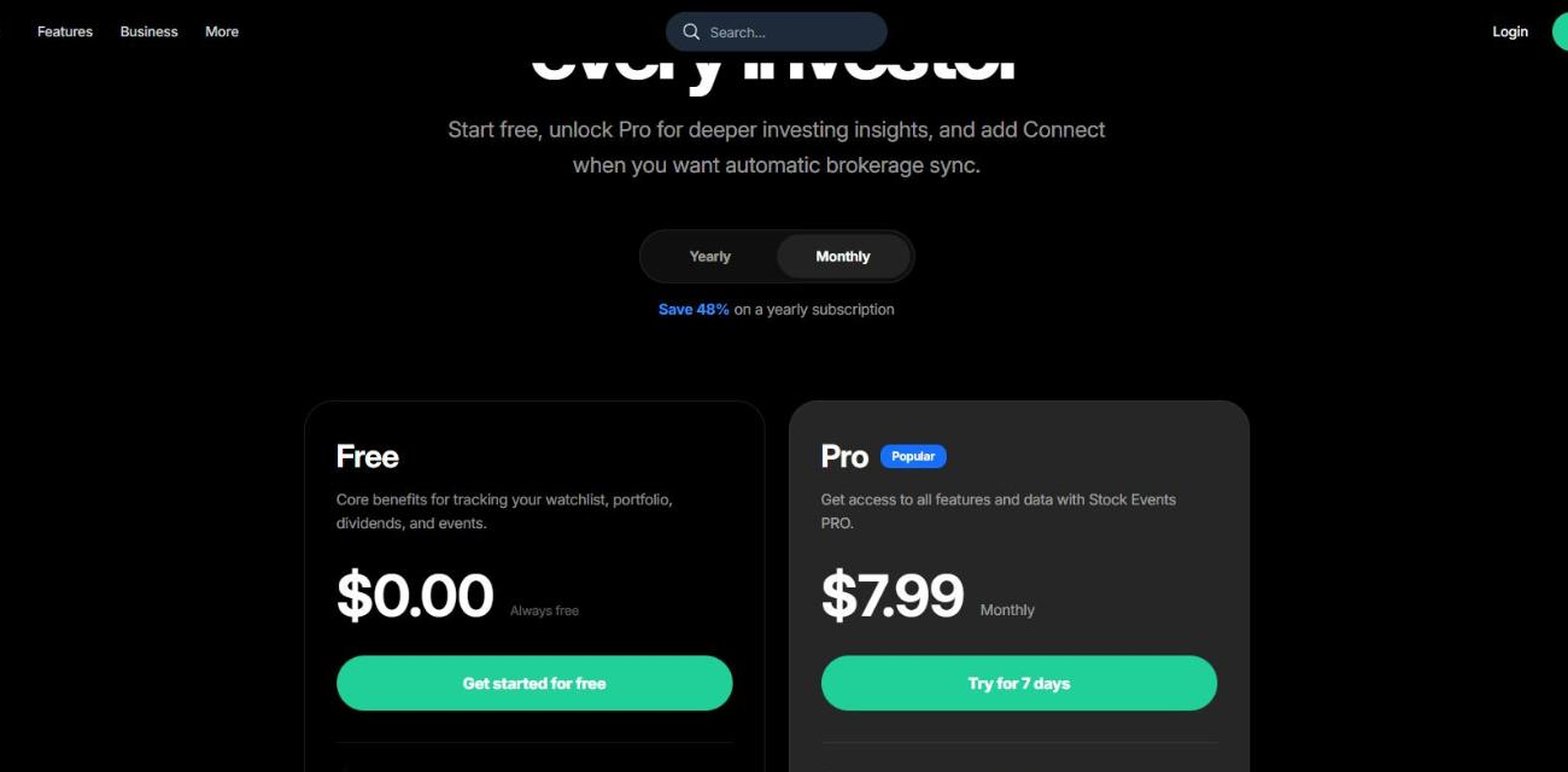
- $0 plan: up to 15 stocks, with dividend and event tracking.
- Pro $7.99 a month, or $49.99 a year.
- Estimated future dividends where none is announced yet.
- Income by year, month and day, yield and yield on cost.
- API on Pro for your own watchlists, transactions and dividends.
The estimates set Stock Events apart. Coca-Cola's page showed the last ex-date of 15 September 2026, the payment on 1 October and an estimated next payment on 15 December, so your calendar is never empty just because a board has not declared yet. Distribution views split your income by asset, sector, industry and country.
Where it falls short: the $0 plan stops at 15 stocks, brokerage sync is an add-on at $0.99 a week, and we found no market-wide dividend list or dividend screener.
Track Your Dividends
Track Your Dividends is a dividend tracker whose $0 version is generous where others are tight: unlimited portfolios, as long as you enter them by hand. It counts more than 40,000 free users.
- Best for manual dividend portfolios at no cost.
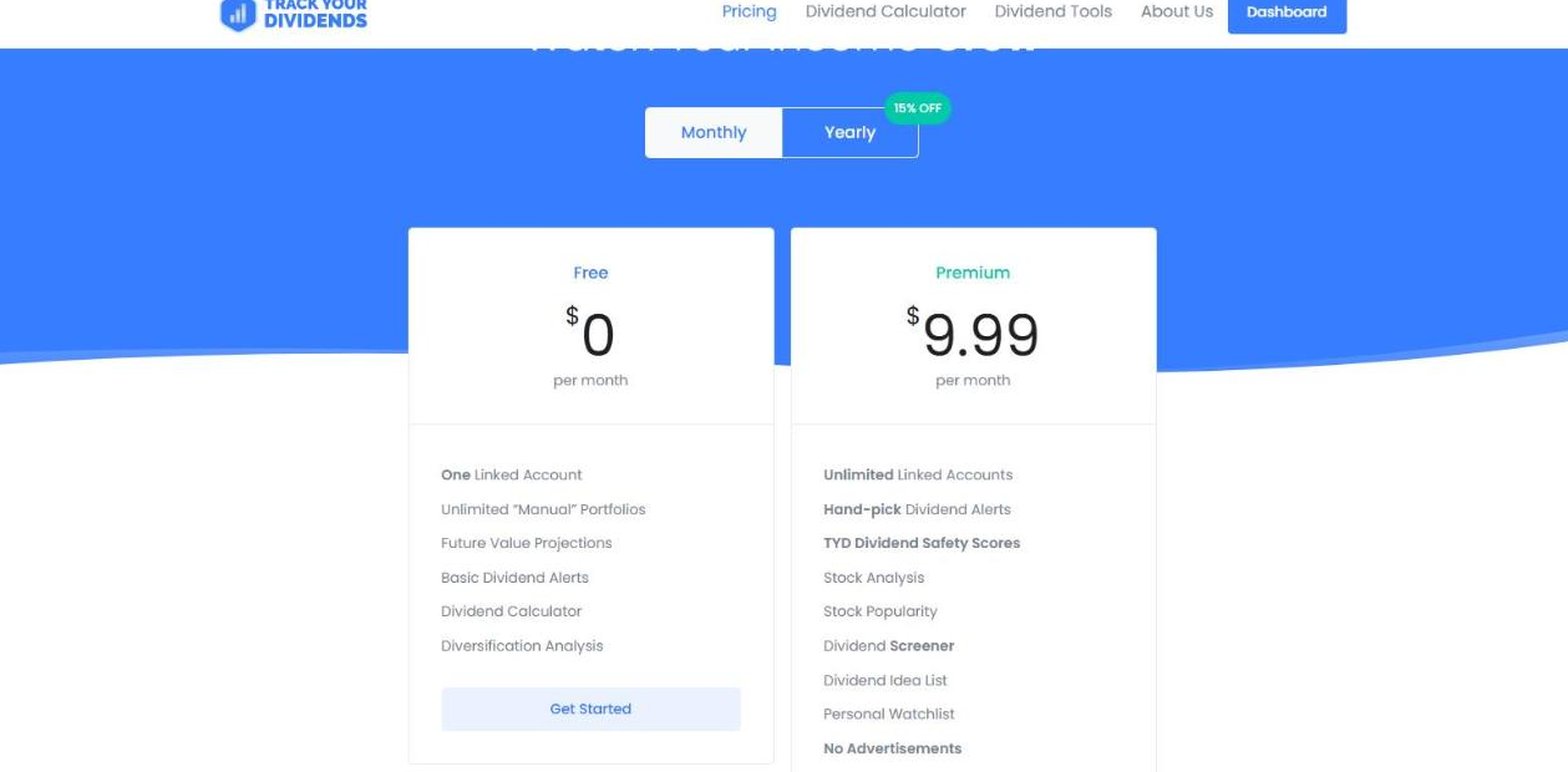
- $0 plan: unlimited manual portfolios, one linked account.
- Future value projections and basic dividend alerts at $0.
- Premium $9.99 a month, or $99.99 a year.
- Dividend screener and TYD Dividend Safety Scores on Premium.
- Alerts you pick: declaration, payment and weekly recap.
Account linking uses Plaid, and Premium removes the one-account limit. Its research pages carry yield history, payout ratios and a full history of payments. There is a 7-day trial and a 14-day money-back guarantee on Premium.
Where it falls short: stock analysis, including the payment history, sits on Premium along with the screener and safety scores, and there is no API or MCP server.
Business Quant
Business Quant is ours. Each stock's page has a Dividends tab listing every payment with its ex-date and pay date, beside a market-wide dividend feed, a screener with dividend filters and a portfolio tracker.
- Best for payout history, ex-dates and dividend screening, with export and API access.
- Free to use, with every dividend on record, the screener and the portfolio tracker, no card.
- Pro from $29 a month, full history, export and API access.
List of features
- Dividends tab: every distribution with ex-date, pay date, amount and type
- Dividend statistics: TTM dividend, latest and peak yield, largest payout, years paid
- Payout history and trailing yield charts
- Corporate actions feed of dividends, splits and listings, back to 1990
- Stock screener with more than 700 metrics, including dividend yield, coverage and payout ratio
- Portfolio tracker with trailing 12-month dividend yield, total return and XIRR
- Financial statements in industry-specific layouts
- CSV and XLSX download
- Dividends API
- MCP server
The Dividends tab starts with the statistics a dividend investor checks first. For Coca-Cola that is 94 distributions on record from 2003 to 2026, a trailing 12-month dividend of $2.10, the latest yield against its peak of 4.88% in March 2009, the largest single payout, the last payment date and 24 years of payments. Below sit a payout history chart over 5 years, 10 years or the full record, a trailing yield chart, and the distribution table with each ex-date, amount, type and pay date. A free account opens every record and lets you download them.
For the market as a whole, the corporate actions feed lists dividends, splits, bankruptcies, delistings and new listings across NYSE, NASDAQ and OTC stocks, updated every business day, and its Dividends filter turns it into a running log of who paid what. To find the next payer, the screener filters on dividend yield, dividend coverage, free cash flow payout ratio and the growth of dividends paid, and the portfolio tracker reports the trailing 12-month dividend yield of the stocks you own, next to total return and XIRR.
Dividend trackers feature by feature
| Platform | Tracker at $0 |
Ex‑date history at $0 |
Market‑wide dividend list |
Dividend screener |
API access |
MCP server |
Plans from |
|---|---|---|---|---|---|---|---|
| Business Quant | ✓ | ✓ | ✓ | ✓ | ✓ | ✓ | $29/mo |
| Snowball Analytics | ✓ | ✓ | ✓ | ✓ | ✗ | ✓ | $6.67/mo |
| Digrin | ✓ | ✓ | ✓ | ✓ | ✗ | ✗ | See note |
| Seeking Alpha | ✓ | ✓ | ✗ | ✓ | ✗ | ✗ | $299/yr |
| Stock Events | ✓ | ✓ | ✗ | ✗ | ✓ | ✗ | $7.99/mo |
| DivTracker | ✓ | ✗ | ✓ | ✗ | ✗ | ✗ | $2.50/mo |
| Sharesight | ✓ | ✗ | ✗ | ✗ | ✓ | ✗ | $7/mo |
| Track Your Dividends | ✓ | ✗ | ✗ | ✓ | ✗ | ✗ | $9.99/mo |
| Simply Safe Dividends | ✗ | ✗ | ✗ | ✓ | ✗ | ✗ | $39/mo |
Sorted by ticks, ties broken alphabetically. A tick means the platform's own pricing, plan, help or stock pages document the feature; a cross means we found no such documentation or, for the "$0" columns, that it needs a paid plan or trial. "Tracker at $0" means you can record holdings and see a dividend figure for them without paying. "Ex-date history at $0" means a stock's past payments with their ex-dates are visible without paying. "Market-wide dividend list" means an ex-dividend calendar or dividend feed covering stocks beyond your own. "Dividend screener" means filters on dividend metrics such as yield or payout ratio. "API access" and "MCP server" mean a documented data API and a connector for AI assistants. The last 4 columns count any plan.
Business Quant is the only tracker here that ticks every column. Snowball Analytics comes closest with 5: its dividend features are open at $0 and its MCP server is on Expert, but it has no data API. Digrin follows with 4 for its open stock pages, ex-dividend list and screener, then Seeking Alpha and Stock Events with 3. Sharesight's strength is reporting what you were paid and taxed, which no column here measures. A cross shows what a product was built for, not how good it is.
What about getquin and mobile-only apps?
The net-worth platform getquin comes up in dividend tracker searches, but its dividend forecasting sits on a plan priced in euros, and we found no per-stock payout history on its pages. Several popular dividend apps on Google Play and the App Store have no web version, so none of them made the list.
Which dividend tracker is right for you?
- You invest for dividend growth and log every trade: Digrin.
- You want the cheapest paid tracker for an iPhone: DivTracker.
- You want dividend grades next to written analysis: Seeking Alpha.
- You need dividend and tax reports: Sharesight.
- You want a warning before a dividend is cut: Simply Safe Dividends.
- You want an income calendar and yield on cost at $0: Snowball Analytics.
- You want ex-date reminders and estimated payouts: Stock Events.
- You want unlimited manual portfolios at no cost: Track Your Dividends.
- You want every payout on record, a dividend screener and the cash flow behind each dividend, with export and an API: Business Quant.
If you want to screen beyond dividends, our stock screener comparison covers the wider field, and our stock analysis websites guide looks at researching a company in depth. The financial statements guides explain the cash flow lines that decide whether a dividend is covered.
Where I would track my dividends
If all you want is a calendar of the cash landing in your account, any income tracker with a calendar will do that job. If you pick individual dividend stocks and want to know which ones deserve the money, I would start on Business Quant.
How much did each stock pay, when is the next payment, and by when do you have to own it? The Dividends tab answers all 3 for every US-listed stock: each ex-date and pay date on record, Coca-Cola's 94 payments back to 2003 among them, and the next dividend once it is announced. The payout chart shows whether a dividend is growing, as PepsiCo's did at 7.4% a year from 2016 to 2025, and the cash flow statement on the same site shows the cash that pays for it.
It also covers the stocks you do not own yet: the corporate actions feed logs dividends across the market, the screener filters on yield, coverage and payout ratio, and the portfolio tracker reports your trailing 12-month yield. All of it is free to use with no card, and Pro, with export and API access, is from $29 a month.
A 10-minute test you can run on any tracker: pick your 3 largest dividend holdings and write down, for each, the last ex-date, the last pay date and the dividend 5 years ago. If a tracker cannot give you all 9 numbers, it is showing you your income, not your dividends.
How this comparison was made
To make the list, a product had to track dividends on the web from its own dividend data: show dividend payments for individual stocks with their dates, and give a dividend figure such as income, yield or a calendar for a portfolio you record, at no cost or at a self-serve price published on the vendor's own site. Mobile-only apps and spreadsheet templates were not included. 9 trackers met that bar.
Every price, plan limit and feature was read on the vendor's own pricing, plan, help, product or stock pages on 16 October 2026 and screenshotted there. Prices are each platform's lowest advertised monthly price in US dollars on that date; Seeking Alpha advertises an annual renewal only, and Digrin prices its plans in euros only. The dividend figures for Coca-Cola, Johnson & Johnson and PepsiCo come from our dividend data, read the same day.
The list, the summary table and the reviews run alphabetically, with Business Quant last, and the feature table is sorted by the number of ticks, with ties broken alphabetically. We make Business Quant, one of the 9 products compared here.
Image credits. Header photograph by Ibrahim Rifath on Unsplash, used under the Unsplash License. Vendor screenshots were captured on 16 October 2026 from each provider's own pricing, plan or product pages and are reproduced for comparison. The dividend history illustration is our own, built from our dividend data.
Frequently asked questions
What is the best website to track dividends?
It depends on whether you want to track income or research payers. For the dividend record of any US-listed stock, Business Quant shows every distribution with its ex-date, pay date and amount, Coca-Cola's 94 payments back to 2003 for example, along with a market-wide dividend feed, a screener with dividend yield, coverage and payout filters, and a portfolio tracker that reports your trailing 12-month yield. For a calendar of your own income, Snowball Analytics, Stock Events and Seeking Alpha's Dividend Dashboard all show upcoming ex-dates and payment dates.
What is the best app to track dividends?
Most dividend trackers now work in a browser and on a phone. DivTracker runs on iOS and the web, from $2.50 a month on its Pro plan, Stock Events and Snowball Analytics publish apps on the App Store and Google Play alongside their web versions, and Sharesight has a mobile app as well. Whichever you choose, check that the app shows ex-dates as well as pay dates.
Is there a free dividend tracker?
Yes, several. Business Quant is free to use with no card: dividend history with ex-dates, the corporate actions feed, the stock screener and the portfolio tracker need no payment. Seeking Alpha's Dividend Dashboard is free with an account. Track Your Dividends allows unlimited manual portfolios at $0, Stock Events tracks up to 15 stocks, Snowball Analytics and Sharesight allow 10 holdings, DivTracker allows 5, and Digrin allows one portfolio with 30 transactions a month. Simply Safe Dividends offers a free trial instead.
Is there a free spreadsheet I can use to track dividends?
You can build one, but you have to look up every payment, ex-date and dividend change yourself. A quicker route is to download the history: on Business Quant a free account lets you view and download every distribution a stock has recorded, ready for a spreadsheet, and DivTracker and Snowball Analytics export your portfolio data to CSV on every plan, Digrin from its Plus plan.
What is an ex-dividend date and why does a tracker need it?
It is the cut-off for the next payment: you must own the shares before the ex-date to receive the dividend. The cash arrives later, on the pay date. Coca-Cola's latest dividend of $0.53 had an ex-date of 15 September 2026 and was paid on 1 October 2026, so a buyer on 15 September did not receive it. A tracker that shows only pay dates tells you when money arrives, but not when you need to act.
How much do you need to invest to make $1,000 a month in dividends?
Divide the income you want by the portfolio's yield. $1,000 a month is $12,000 a year, which takes about $400,000 at a 3% yield and $300,000 at 4%. Yields change with prices and dividends get cut as well as raised, so a dividend tracker that shows each holding's payout history and yield on your actual portfolio keeps the estimate honest. This is arithmetic, not investment advice.