12 EOD Stock Data APIs Compared
Three things decide whether a daily price series is usable: how corporate actions are handled, whether dead companies are still in it, and how you get the whole universe out.

Daily price data is the first dataset most people buy and the one they think about least. It is a row per day per ticker. How different can vendors really be?
Different enough that the same strategy, tested on 2 feeds, can disagree by more than the edge you were trying to measure. I want to walk you through why that happens, because it comes down to 3 decisions your vendor already made on your behalf, and none of them tends to show up on a pricing page.
- How corporate actions are handled. An unadjusted series shows a 4-for-1 split as a 75% single-day collapse. An adjusted one folds splits and dividends back through history so returns stay continuous. Both are legitimate outputs, and using the wrong one silently ruins everything downstream.
- Whether dead companies are still in the data. If a vendor carries only currently-listed securities, every firm that failed or was acquired has been deleted from history, and your backtest is measuring survivors.
- How you get the whole universe out. Answering one question about one ticker is a completely different job from loading 30 years of every US listing into a database, and vendors tend to be built for one or the other.
What follows is 12 providers that sell end-of-day equity prices through a documented API or a documented bulk download, measured against those 3 questions. Business Quant is one of them, and you should read our entry with the same scepticism you bring to the rest.
Survivorship bias is not a rounding error
Start here, because this is the failure that quietly invalidates more backtests than the other 2 combined, and it is completely invisible while it is happening. Nothing errors. No warning appears. Your results just get better than they should be.
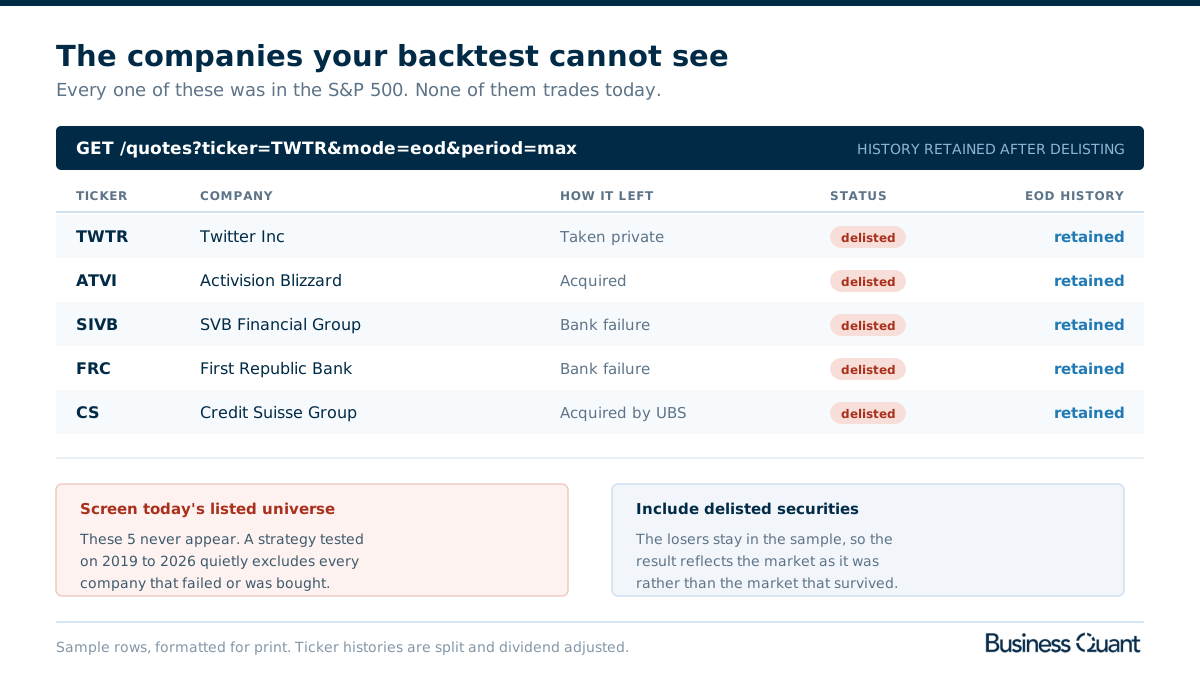
Think about what a US equity universe drawn from today's listings quietly leaves out, just over the last few years. A social network taken private. A games publisher absorbed by Microsoft. Two large regional banks that failed inside a fortnight. A systemically important Swiss lender bought by its rival over a weekend.
None of those were obscure. Several were index constituents days before they disappeared. Yet if your data source keeps only what is listed today, all of them are simply gone, and so is every price they ever printed.
Now test a strategy across that period. You have excluded the worst outcomes in your own sample, which means the bias runs one direction, always flattering. And it bites hardest exactly where you most want to trust your numbers: small caps, financials, and any window containing a crisis.
The fix is not clever, which is what makes it easy to skip. You need the dead companies still in the data, with prices intact up to their last trading day, and a way to know when each one stopped.
Adjusted, unadjusted, and knowing which one you were handed
The second decision is subtler, because here both answers are genuinely correct. It depends entirely on what you are doing.
Adjusted series restate history so splits and dividends never appear as price moves. This is what you want for returns, for charts spanning years, and for anything that compares performance across time. The trade-off is that the price shown against a date is not the price that printed that day.
Unadjusted series preserve exactly what traded. Reach for this when you are reconciling against a broker statement, modelling an option that struck at a specific level, or working out why a chart you drew in 2018 disagrees with the same chart today.
So there are 2 things worth establishing with any vendor before you commit, and neither is usually on the pricing page. First, which one you get by default, because it is rarely stated and the difference stays hidden until a split happens. Second, whether dividends are adjusted as well as splits, because several feeds handle splits only and still describe the output as adjusted.
Bulk download, or how long your first load actually takes
This is the dimension most comparisons skip, and it will decide more of your engineering time than the price does.
There are 2 shapes of product here, and swapping one for the other is painful.
- Per-ticker APIs. You ask for a symbol, you get its series. Excellent for answering questions on demand. Rough for a first load, because 8,000 tickers means 8,000 requests, retry handling, and a job measured in hours or days against a rate limit.
- Bulk delivery. One file per exchange per day, or a batch job producing a compressed archive of the whole universe. Populating a database turns into a download and a copy command instead of a crawler you have to babysit.
The rule I would apply: if you are building a research database you want bulk, if you are serving a web app you want per-ticker, and if you are doing both you want a vendor that offers both. Working out which shape you need before you shortlist will reorder the shortlist, because several vendors that are excellent at one are genuinely awkward at the other.
The 12 in this comparison
- EODHD
- Tiingo
- Intrinio
- Financial Modeling Prep
- EODData
- Norgate Data
- QUODD
- QuantQuote
- Databento
- HistoricalData.net
- Marketstack
- Business Quant
| Provider | Adjustment | Delisted kept | History | Bulk | Entry |
|---|---|---|---|---|---|
| EODHD | Splits and dividends | Yes, via flag | 30+ years US | Per exchange | $19.99/mo |
| Tiingo | Adjusted | Reported yes | 30+ years | Per ticker | $0 / $30 |
| Intrinio | Both | Not published | 50+ years US | CSV, Snowflake, S3 | $150/mo |
| Financial Modeling Prep | Adjusted close | Not published | By tier | All symbols by date | $0 / $19 |
| EODData | Splits and dividends | Not published | 30+ years | Not published | $0 / $69.95 |
| Norgate Data | Adjusted | Yes, its purpose | Deep | Local database | Subscription |
| QUODD | Both | After Sep 2010 | Not published | Not published | On contact |
| QuantQuote | Split adjusted | Not published | Since Jan 2000 | CSV files | Per dataset |
| Databento | Not published | Not published | By dataset | Batch jobs | $125 credit |
| HistoricalData.net | Not published | Yes | Not published | Bulk CSV | Per download |
| Marketstack | Splits and dividends | Not published | 1 to 15+ years by tier | Per ticker | $0 / $9.99 |
| Business Quant | Splits and dividends | Yes | 30+ years | Multi-ticker | $0 |
Scroll the table sideways to see every column. Where a vendor does not publish a figure the cell says so rather than carrying an estimate.
Taking each in turn
EODHD
Named for this exact dataset, and it shows. End-of-day prices are the core product rather than a feature bolted onto something larger, and the coverage is the widest you will find in this group.
- 150,000+ tickers across worldwide exchanges, with 30+ years of history on major US markets and 15 to 20 years across most of Europe and Asia.
- Adjusted for splits and dividends, stated plainly rather than left for you to infer.
- Delisted symbols are first-class, retrievable per exchange in the tens of thousands.
- Bulk delivery per exchange, which is what makes a full historical load practical rather than a week of paginating.
- $19.99 a month for end-of-day with 100,000 calls a day.
One thing to settle early rather than late: paid plans are sold for personal use, and commercial applications are priced separately. Worth a conversation before you build.
Tiingo
Tiingo covers 109,629 securities with 30+ years of price history, and prices its paid tier well below where this category usually sits. That combination is rare enough to be worth a look on its own.
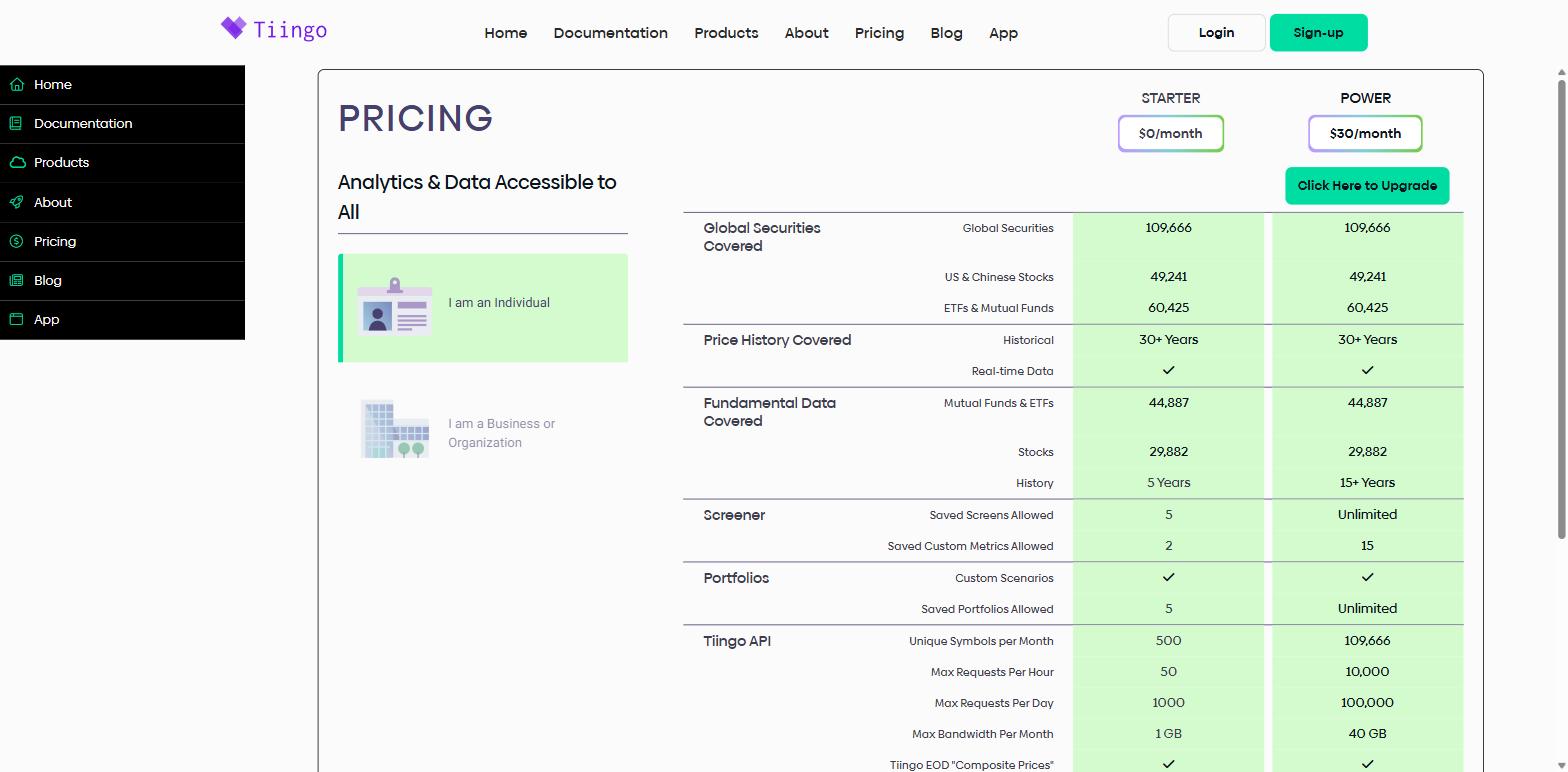
The free Starter plan advertises 1,000 requests a day, but that number is not the one that will stop you. The binding constraints are 500 unique symbols a month, 50 requests an hour and 1 GB of bandwidth, and it is easy to burn through a month's symbol allowance in a single afternoon of exploratory work. Power lifts all of that to the full security list, 10,000 requests an hour, 100,000 a day and 40 GB, for $30 a month. Both plans are licensed for internal use only.
Delivery is per ticker rather than bulk, so plan for a full universe load to be a long-running job even on Power.
Intrinio
Intrinio publishes the deepest price history in this comparison by a wide margin, and it does not force the adjusted-or-unadjusted choice on you either.
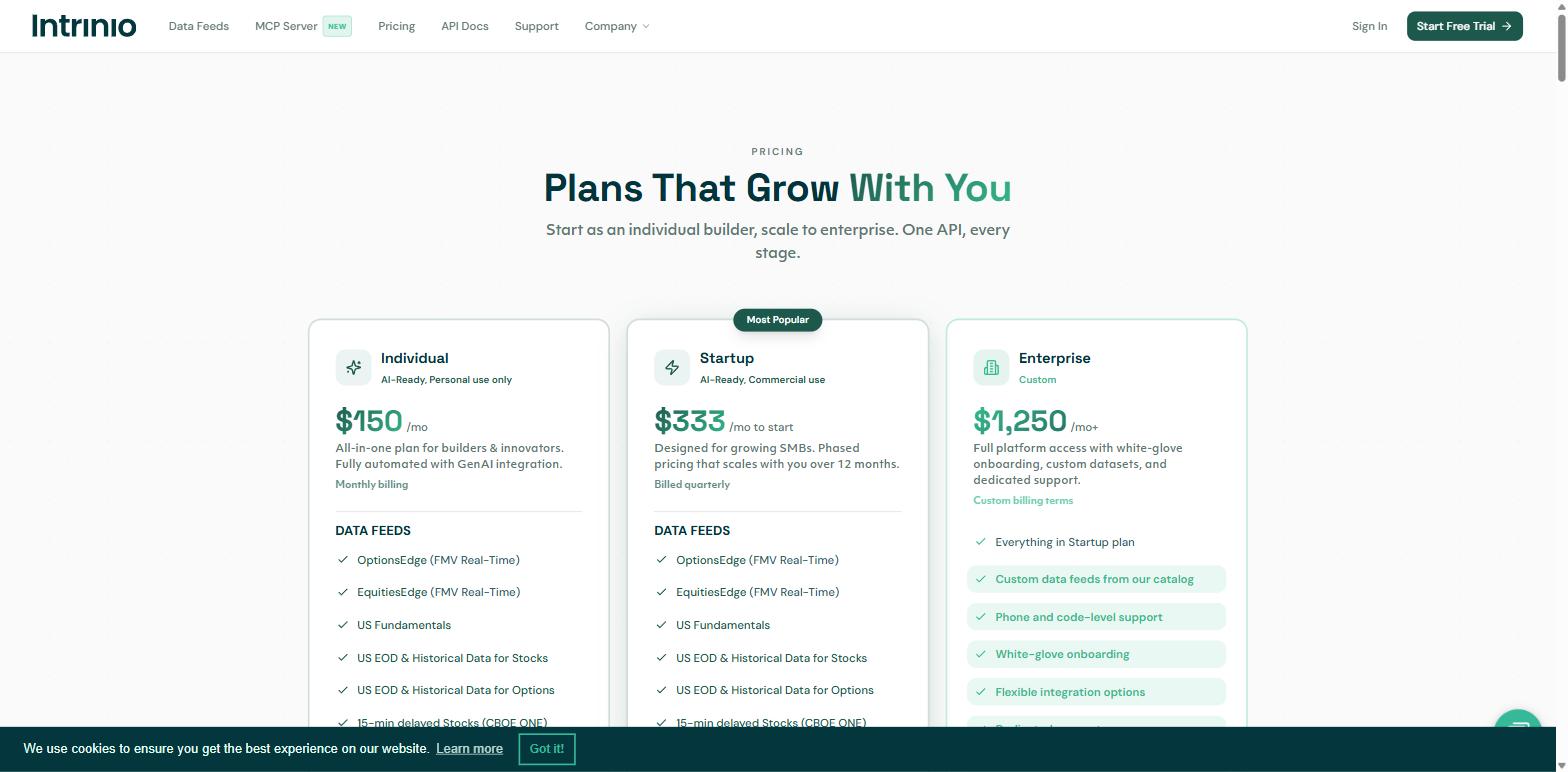
- 50+ years of dividend and split adjusted history for US equities, which reaches back past every recession most strategies are ever tested against.
- Adjusted and unadjusted together, with the split ratios and adjustment factors.
- Four delivery routes. API, CSV bulk download, Snowflake and S3, covering both the query pattern and the warehouse-load pattern from one subscription.
- From $150 a month on the individual plan, with a free trial and enterprise pricing on consultation.
Shipping the adjustment factors alongside both series is the detail worth noticing here. It turns the adjustment from something you accept into something you can audit, which is exactly what you want on the day 2 vendors disagree about the same date.
Financial Modeling Prep
FMP is a broad financial data platform, and the part that matters for this article is that it treats bulk end-of-day as a first-class endpoint rather than something you assemble yourself from per-ticker calls.
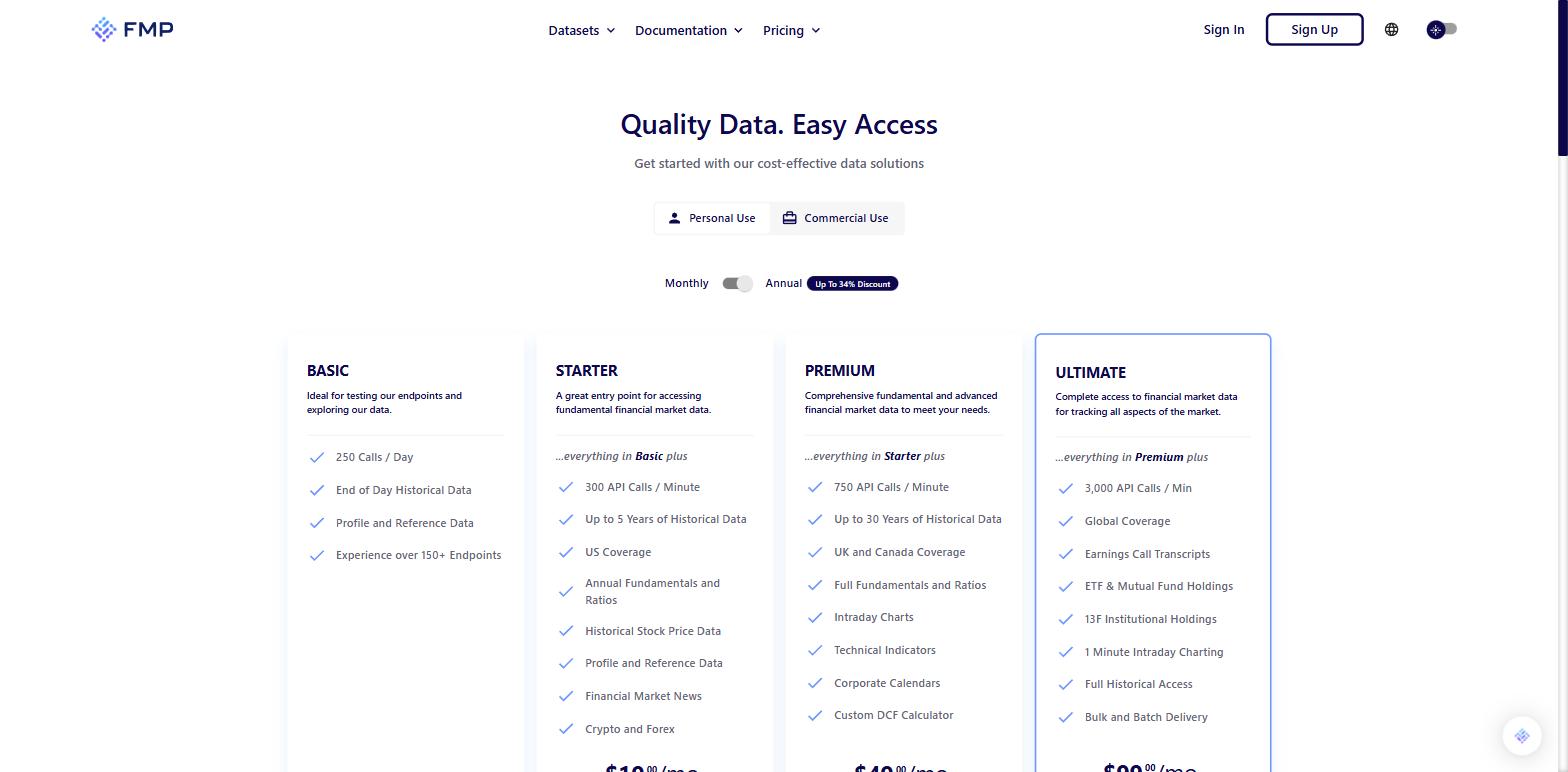
The bulk endpoint returns every symbol for a given date as CSV, with open, high, low, close, volume and adjusted close on each row. That flips the shape of a historical load: instead of one request per ticker, you make one request per day and loop over dates. For an incremental daily pipeline it is close to ideal, because yesterday's file is a single call, every day, forever.
A free plan exists and paid plans start at $19 a month, though the bulk endpoints sit on the upper plans rather than the entry ones. Confirm your tier includes them before you design around the pattern.
EODData
EODData has been serving this single dataset for a long time, and the pitch is breadth of exchange coverage at a low ceiling price.
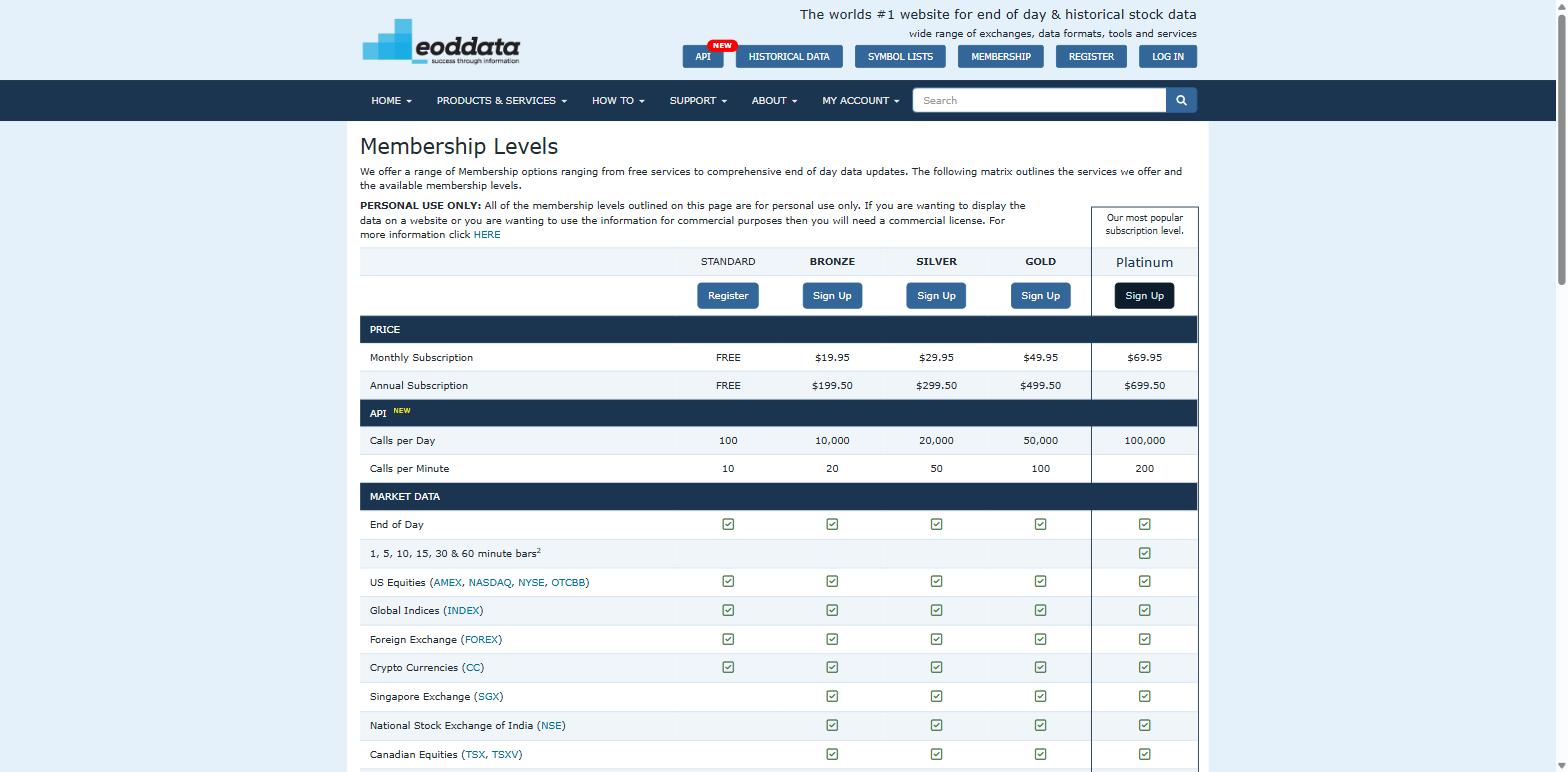
- 100,000+ symbols across dozens of international exchanges, spanning stocks, ETFs, mutual funds, indices, forex and crypto.
- 30+ years of end-of-day history, with intraday bars at 1 and 5 minutes on some exchanges.
- Splits and dividends supplied as corporate actions alongside the price series.
- 60+ technical indicators computed server-side, if you would rather not maintain that code yourself.
- Pricing runs from free to $69.95 a month across tiered membership levels.
Delisted retention is not addressed in the published material, so if survivorship matters to your work, ask about it directly rather than assuming either way.
Norgate Data
Norgate exists because of the survivorship problem, and that origin runs through every part of the product. It is built for systematic traders who need to see a universe as it actually stood on a historical date.
- Survivorship-bias-free by construction, with delisted securities carried at full history rather than bolted on afterwards.
- Historical index constituents, so you can reconstruct what was genuinely in an index on a given date instead of applying today's membership backwards.
- Data is maintained in a local database and updated in place, which suits a backtesting engine far better than an HTTP round trip per symbol.
- Subscription pricing aimed at individual and professional traders rather than enterprise contracts.
If point-in-time universe construction is the thing standing between you and a backtest you trust, this is the specialist in that particular problem.
QUODD
QUODD's distinguishing move is that it does not make you pick. Adjusted and unadjusted prices arrive together, alongside the corporate actions that connect them.
- Adjusted and unadjusted OHLCV from one source, so you can reconcile one against the other.
- Corporate action data supplied alongside rather than sold as a separate product you join yourself.
- Identifier continuity, which stops recycled tickers splicing 2 companies together.
- Inactive securities supported after 1 September 2010, a specific and unusually candid boundary.
That date deserves more than a glance. Delisted coverage does not reach the 2008 crisis, which matters enormously if your sample starts before 2010 and not at all if it starts after.
QuantQuote
A defined product rather than a platform, and there is something to be said for that. End-of-day OHLCV for more than 6,000 US equities back to January 2000, split-adjusted, delivered over REST in JSON or as CSV files.
The start date spans the dot-com unwind, 2008 and everything since. The universe is a working set of liquid names rather than a long tail of thinly traded listings. CSV delivery sits alongside REST, so a bulk load does not mean crawling an API. Dividend treatment is worth confirming directly, since the published material specifies splits.
What you are buying here is predictability. You know the universe, the start date and the format up front, which for a defined research project is often exactly what you want.
Databento
Databento comes at this from the market microstructure end. Consolidated end-of-day OHLCV across every exchange and ATS is really the daily slice of a much deeper stack.
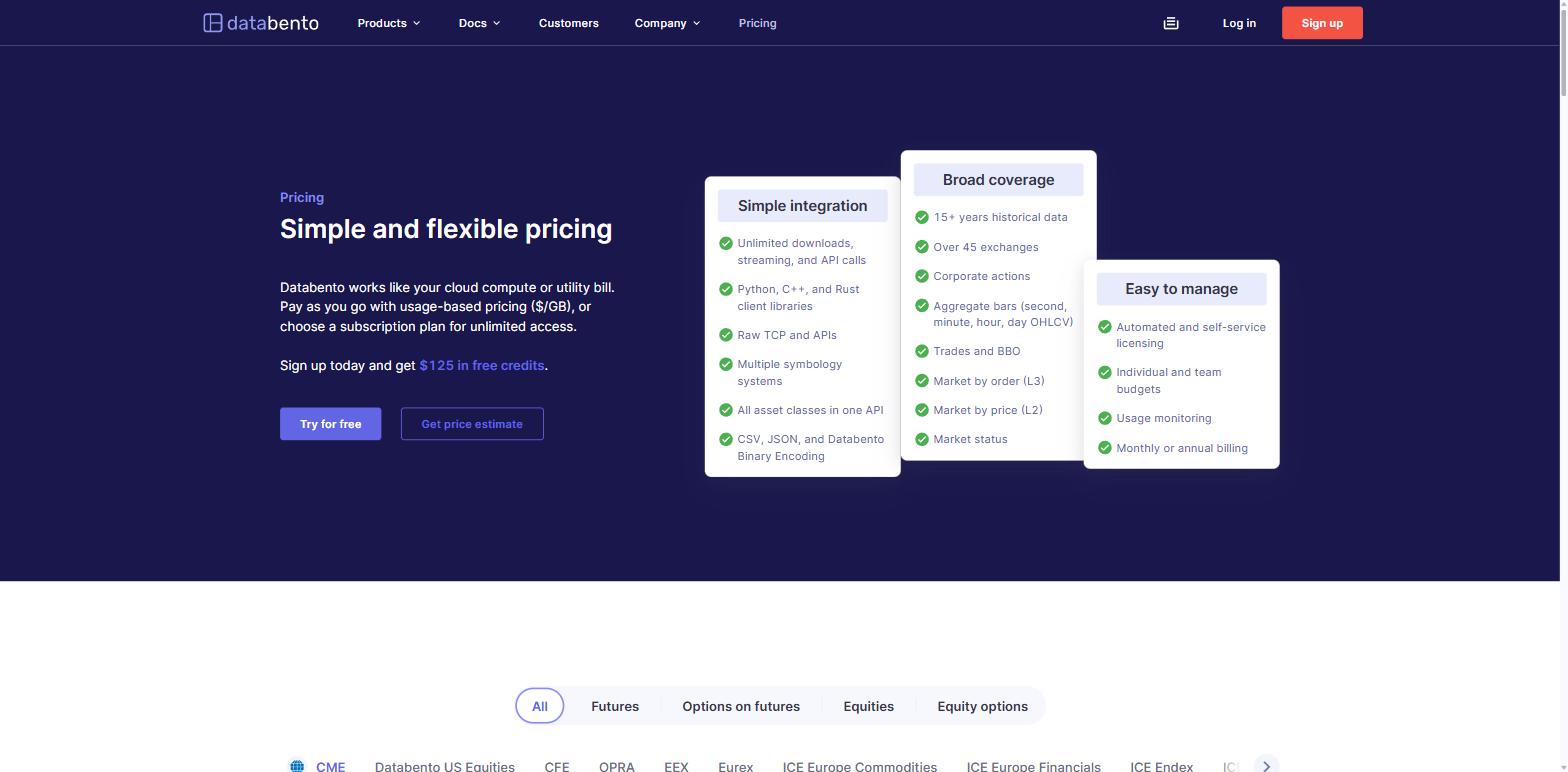
- Consolidated across all exchanges and ATSs rather than a single venue's partial view.
- Batch jobs for bulk retrieval, built for moving large historical ranges rather than polling endlessly.
- Usage-based pricing with $125 credited to new accounts, so evaluating it costs nothing real.
- The same platform carries tick and order book data, which matters if daily bars are your starting point rather than your destination.
If there is any chance your requirement moves to intraday later, starting here avoids a migration you would rather not do twice.
HistoricalData.net
The simplest proposition in this comparison, and simplicity has real value when you know exactly what you need. Bulk CSV downloads of US stock and options history, with delisted ticker records included so researchers are not quietly working on survivors.
- Delisted records included, stated openly as a selling point rather than buried in documentation.
- Bulk CSV rather than per-request calls, which suits a one-off load into a database.
- Options history alongside equities, which is unusual at this end of the market.
This is a download product rather than a live feed, so a daily-refreshing pipeline is a different shape of job than the one it is designed for.
Marketstack
Marketstack is the cheapest paid entry here, and its tier structure ties history depth directly to price in a way that is genuinely easy to misread.
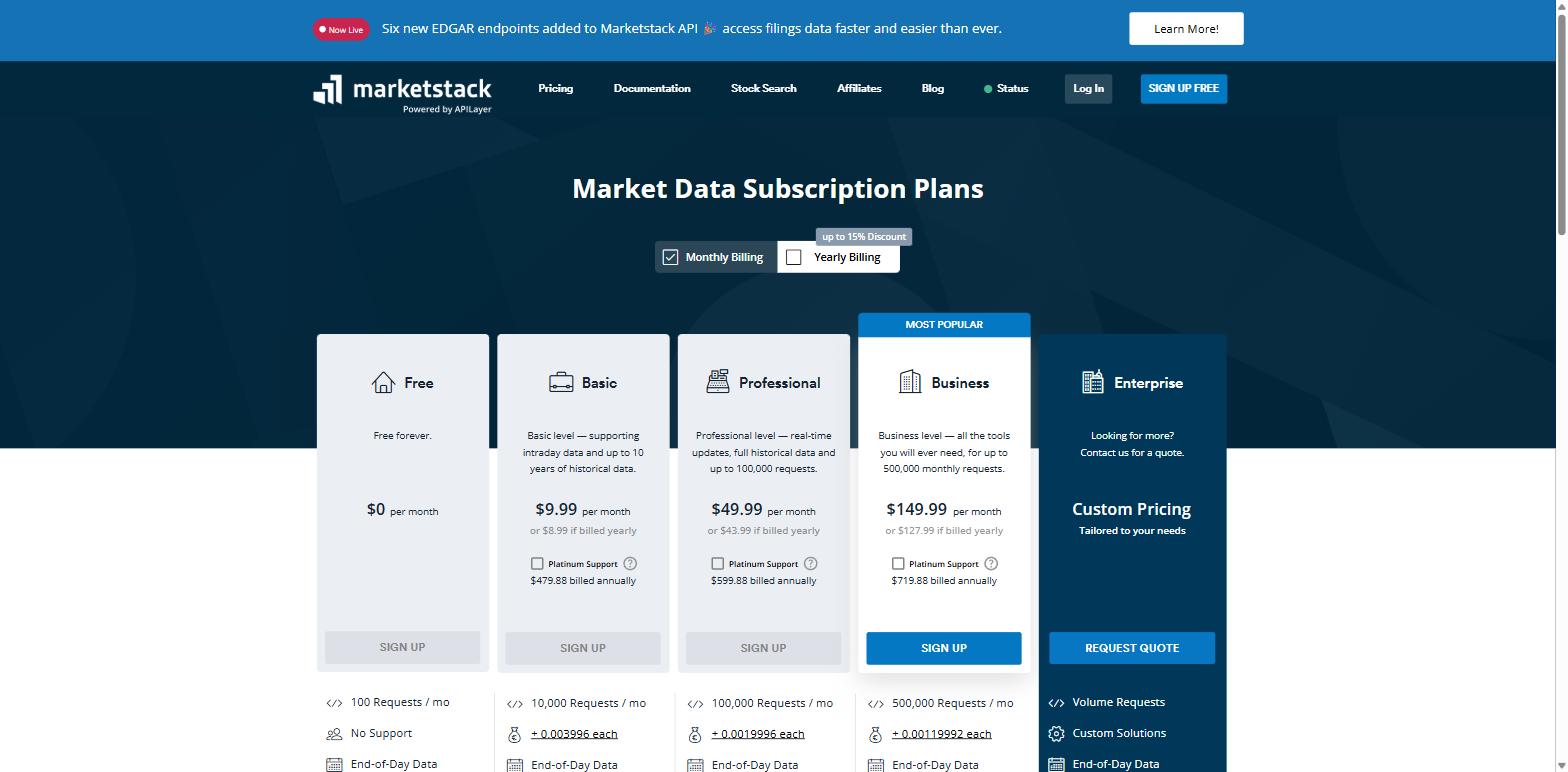
The free plan allows 100 requests a month with one year of history and internal use only, which makes it an integration test rather than a research tool. Basic is $9.99 a month for 10,000 requests and 10 years of history. Professional is $49.99 for 100,000 requests, 15+ years and real-time updates. Coverage runs to 30,000+ tickers across 70 exchanges, with splits and dividends included.
My advice is to read the history column before the request column when you choose a tier. Delivery is per ticker throughout, so bulk loads stay slow regardless of what you pay.
Business Quant
Our own API is built around the first 2 questions this article opened with, because they are the ones that quietly break research long after you have stopped looking.
- Prices are adjusted for splits and dividends, so your return series stays continuous through corporate actions without you maintaining a factor table.
- Delisted securities keep full history, right up to the last trading day.
- 30+ years of history across roughly 35,700 US-listed securities, including OTC names, ETFs and mutual fund share classes.
- 4 modes in one place: settled history, live daily, minute bars and a snapshot.
- Multi-ticker requests return a dictionary keyed by ticker, each with its own metadata and data block, rather than a flat array you have to group yourself.
- Corporate actions are queryable separately, covering 15 event types including splits, spinoffs, mergers, delistings and ticker changes, with the counterparty attached.
- 30 API calls a day on the free key, enough to test the adjustment and delisting behaviour, then 75 a minute on Pro up to 900 a minute on Enterprise, with commercial distribution on the enterprise plan.
Daily history, minute bars and their sample responses are in the EOD Stock Price API and Intraday Stock Data API documentation.
Scope worth knowing up front: coverage is US-listed securities, so a company trading only in Frankfurt or Tokyo will not be there, and prices are served adjusted.
Reading end-of-day prices from the Business Quant API
| What you want | How you get it |
|---|---|
| Settled history only, no partial bar | mode=eod |
| History with today's bar included | mode=daily during market hours |
| Just the current price | mode=snapshot |
| Many tickers in one call | Comma-separated list, returns a dict |
| A defined window | period or from_date and till_date |
| A delisted company's history | Query the ticker as normal |
| Why a price series jumps | The corporate actions endpoint |
| Whether a ticker was reused | Ticker adopted and retired events |
Where this leaves you
If you are building something that measures historical performance on US equities, I would start with Business Quant, and I would start with the delisted question rather than the price.
The case comes down to 3 specifics. Your prices arrive adjusted for splits and dividends, so returns stay continuous without you maintaining a factor table that will eventually drift. Companies that failed or were bought keep their full history, so a universe drawn from this data is not silently filtered down to the winners. And settled history, the live bar, 1-minute intraday and a current snapshot all come from a one place, across 30+ years and roughly 35,700 securities. It is free to use, so the evaluation costs you an afternoon rather than a procurement cycle.
Here is the test I would run first, because it takes 10 minutes and almost nobody does it. Pick a company that was acquired or failed in the last few years and ask any vendor for its price history. If you get a series ending on its last trading day, they kept it. If you get an empty response, you have just learned something important about every backtest you were planning. Then repeat with a stock that split recently and check whether the pre-split prices were restated. Two queries, and you will know more about a feed than its feature page will ever tell you.
Prices are usually one input rather than the whole answer. For the reported numbers behind them, have a look at the financial statements API comparison, and the financial statements API comparison covers how price history sits alongside fundamentals, filings and macro.
How this comparison was made
One test decided the roster: historical end-of-day equity prices sold through a documented API or a documented bulk download. Vendors were not excluded for appearing in other comparisons on this site, because most of them sell overlapping buckets and holding one back to keep rosters tidy would leave visible holes.
Prices, limits and coverage figures were read off each vendor's own published material on 13 August 2026, not lifted from other roundups. Where a vendor does not publish a figure, the table says so rather than carrying an estimate, which is why several adjustment cells read as unpublished. Every provider here is described from what it actually documents, and Business Quant appears in roster order rather than at the top. Business Quant, which publishes this page, makes one of the 12 products compared here, and its plan limits were read from its own pricing page on 3 October 2026.
Image credits. Header photograph by Anne Nygård on Unsplash, used under the Unsplash License. Diagrams are Business Quant originals.
Frequently asked questions
Is there a free EOD stock data API?
Business Quant is free to use for end-of-day prices across 30+ years, with commercial distribution on the enterprise plan. Several others run free entry points with their own shapes: EODHD allows 20 calls a day but caps history at the past year, Tiingo allows 1,000 requests a day inside a 500-symbol monthly limit, Marketstack allows 100 requests a month with one year of history, and Financial Modeling Prep and EODData both publish free tiers. Read the history limit as carefully as the call limit, because that is usually where the real ceiling sits.
What does survivorship bias mean in stock data?
It means your dataset contains only companies that still exist. Every firm that went bankrupt, was acquired or was delisted has quietly vanished, so a backtest measures the performance of the winners and calls it the market. It inflates returns, and the effect is largest exactly where you would want accuracy, in small caps and in crisis periods.
Do I need adjusted or unadjusted prices?
Adjusted for almost anything involving returns, because an unadjusted series shows a 4-for-1 split as a 75% crash. Unadjusted when you need what actually printed on the tape, such as reconciling against a broker statement or modelling an option strike. Some providers give you both, most pick one, and very few tell you which without being asked.
How do I bulk download end-of-day data for every ticker?
It depends entirely on the vendor, and it is the difference between a 20-minute load and a 3-day one. EODHD publishes one file per exchange per day, Financial Modeling Prep returns every symbol for a given date in a single call, Intrinio offers CSV, Snowflake and S3 delivery, and Databento runs batch jobs. Others only let you paginate ticker by ticker. If you are populating a database rather than answering one-off queries, settle this before you compare prices.