10 Best Financial Statements APIs
Pulling the numbers is the easy part. Making a bank, a REIT and a software company line up in the same schema is the product, and it is where these 6 diverge.


Every provider in this category ingests the same XBRL from the same regulator. The filings are free, the tags are public, and the parsing is a known exercise. So the interesting question is not who has the data. It is what each one does to it afterwards.
Normalisation is the entire product, and it is harder than it sounds for 3 reasons that show up in that order.
- Filers label things differently. One company reports "total net revenues", another "net sales", a third "revenues". A schema that does not map those to one field leaves you writing the mapping, and rewriting it whenever a filer restructures.
- Some industries do not fit a generic statement at all. A bank has no cost of goods sold and no gross margin. A REIT is judged on funds from operations, which is not on any standard income statement. Forcing them into one template produces fields that are technically populated and analytically meaningless.
- A flat list of rows cannot be added up. Statements contain both components and the subtotals of those components. Handed 40 rows with no type information, a program cannot tell which is which, and the first thing it does is double count.
The 10 below all return financial statements through a documented API. Some treat statements as their whole business and some carry them inside a broader platform, which is worth knowing when you read each entry but is not a reason to leave one out.
Standardized or as-filed, and why you may need both
There is a fork in this market that decides which vendors are even candidates, and it is worth settling before you compare prices.
Standardized means every company's numbers are mapped onto a common schema. Revenue is always in the revenue field, whatever the filer called it. This is what you want for screening, ranking and any comparison across companies, and it is the only practical way to look at 500 companies at once.
As-filed means the numbers come back exactly as the company reported them, with the filer's own labels and structure intact. This is what you want when a specific number matters and you need to defend it, or when a company reports something unusual that a standard schema has nowhere to put.
The trade-off is real in both directions. Standardisation involves judgement, and a mapping decision you disagree with is invisible unless the provider tells you what it did. As-filed data is faithful and unusable for comparison, because you are back to reconciling labels yourself.
Most serious work eventually wants both: standardised for the screen, as-filed to check the handful of names that survive it. Providers here sit on different sides of that line, and one of them is built specifically for the as-filed side.
The problem with a flat list of rows
The subtler failure is structural. Ask for an income statement and you get back rows. Some are components. Some are already sums of those components. Nothing about the numbers themselves tells you which.
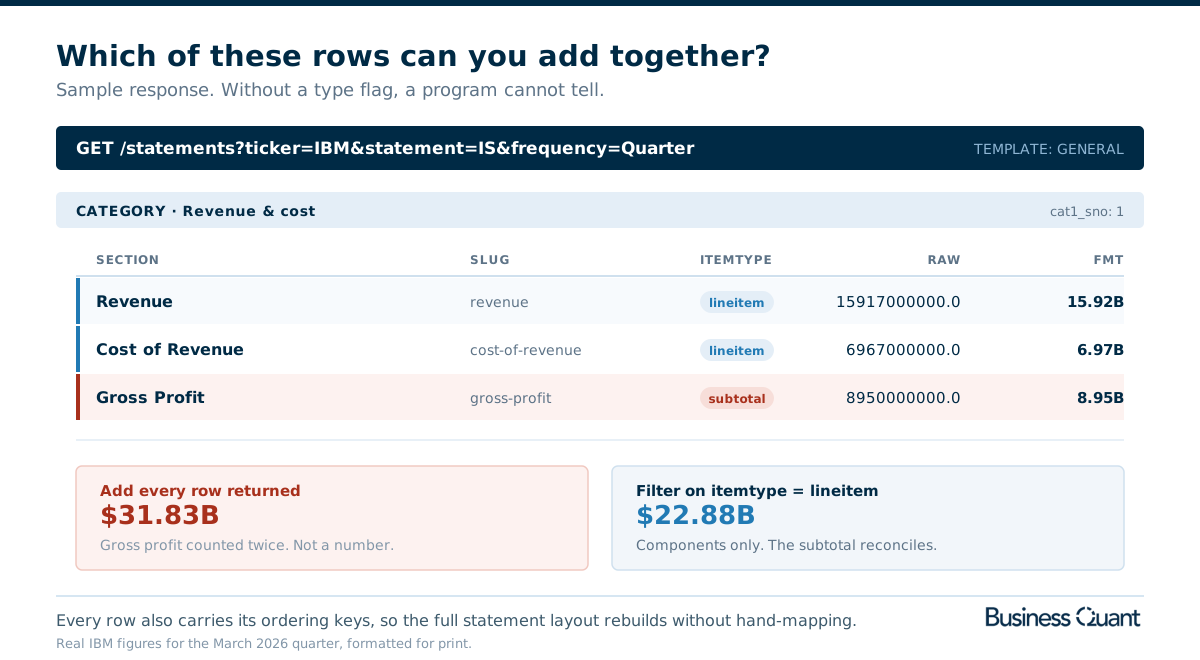
3 rows, and 2 defensible ways to sum them that differ by $9 billion. Scale that to a full statement with a dozen subtotals and the error compounds quietly, because nothing throws an exception. You get a plausible number that is wrong.
This is the argument for schema metadata over convenience. A response that flags each row as a component or a subtotal, and carries the ordering keys to rebuild the statement in the order the company presented it, is doing work you would otherwise do by hand against a layout that changes between filers.
How the 10 stack up
- SimFin
- Calcbench
- Daloopa
- Finnhub
- SEC EDGAR XBRL
- sec-api.io
- Financial Modeling Prep
- Intrinio
- EODHD
- Business Quant
| Provider | Approach | History | Industry templates | Entry |
|---|---|---|---|---|
| SimFin | Standardised, curated | 5y free, 20y+ paid | Single schema | $0 / $15 |
| Calcbench | As-filed XBRL | Since XBRL mandate | As reported | On contact |
| Daloopa | KPI and line item | Not published | Model driven | On contact |
| Finnhub | Standardised | 30+ years | Single schema | $3,500/mo |
| SEC EDGAR XBRL | As-filed tags | Since XBRL mandate | As reported | $0 |
| sec-api.io | Standardised from XBRL | Since 2005 | As reported | $49/mo |
| Financial Modeling Prep | Standardised | 5y to 30y by tier | Single schema | $0 / $19 |
| Intrinio | Standardised | By feed | Single schema | $150/mo |
| EODHD | Standardised | US from 1985 | Single schema | $59.99/mo |
| Business Quant | Standardised, 5 views | 20+ years | 4 templates | $0 |
Scroll the table sideways to see every column.
Each provider in detail
SimFin
SimFin's differentiator is human judgement. Rather than relying purely on automated XBRL parsing, its team curates the standardisation, which produces more consistent mapping than an algorithm working alone on filings that were never designed to be consistent.
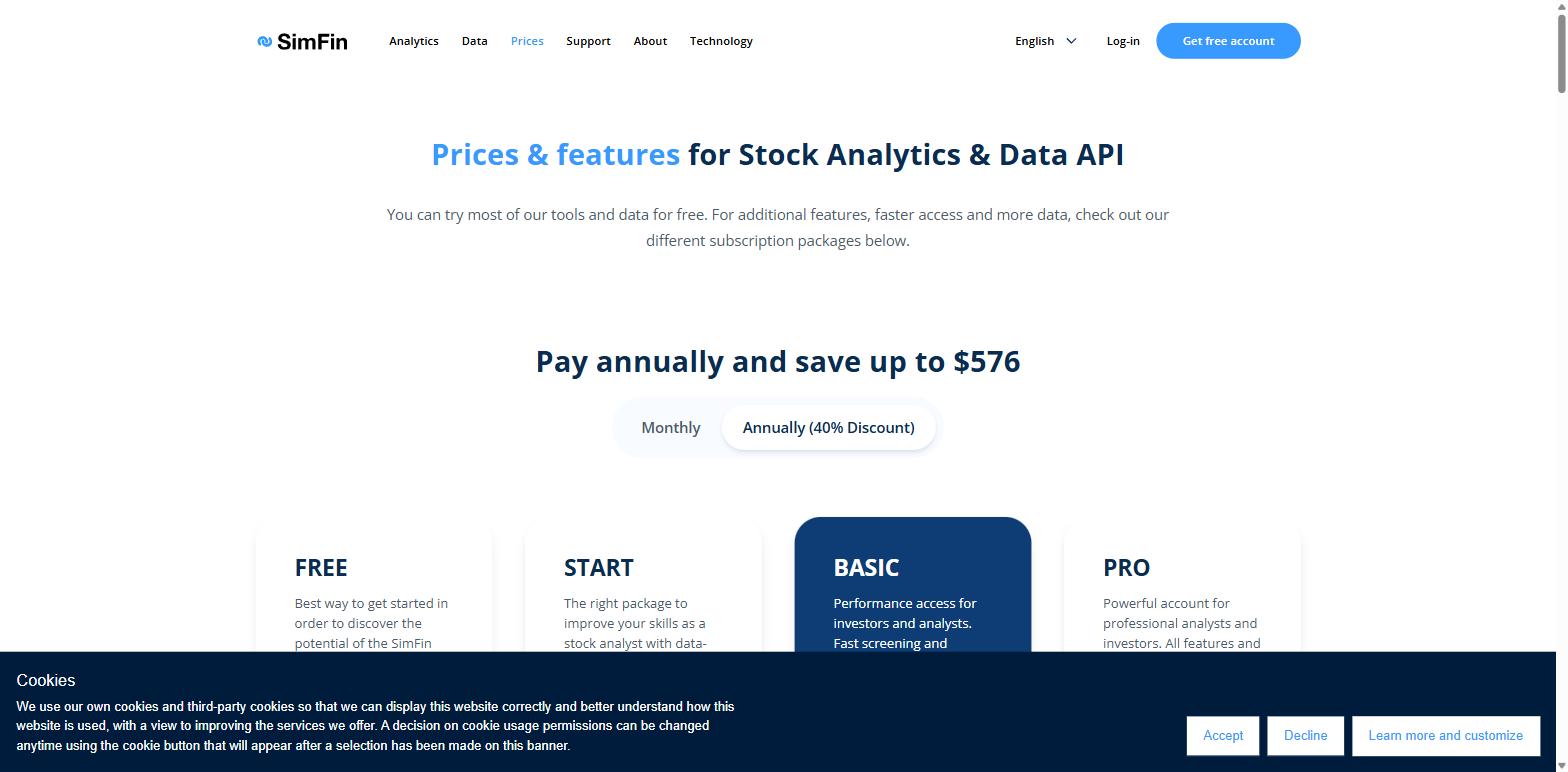
- The free tier covers 5,000 US stocks with 5 years of history and 500 high-speed credits a month, which is a genuinely usable evaluation rather than a teaser.
- Paid tiers are the cheapest here: Start at $15 a month, Basic at $35, Pro at $71, extending history to 10 and then 20+ years.
- A Python package downloads and caches to disk, then loads into pandas, so the common workflow is 3 lines rather than an HTTP client.
The consideration is scale of coverage. Curation is what makes the data consistent and it is also what bounds how much of the market gets covered and how quickly new filings are absorbed. For US equities at a sensible price this is hard to argue with.
Calcbench
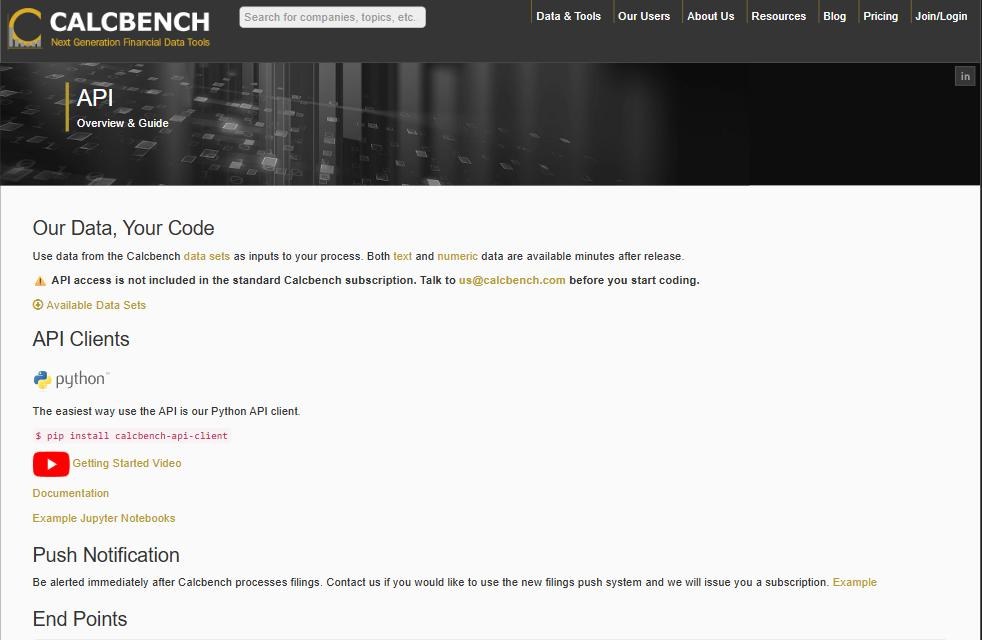
Calcbench sits deliberately on the other side of the standardised divide. It is an interface to the XBRL in 10-K and 10-Q documents as companies filed them, which makes it the reference when the exact reported figure matters more than comparability.
- As-filed detail, preserving the company's own presentation rather than mapping it away.
- Numbers and text together, covering 10-Ks, 10-Qs, earnings releases and proxy statements, so a figure and the disclosure explaining it are in the same place.
- Disclosure search across filings, and peer comparison over time.
- A published Python client, aimed at analysts rather than application developers.
Calcbench is the tool for the moment a number looks wrong and you need to see exactly what was reported and what the footnote said. It is not the tool for screening 3,000 companies on gross margin, and it does not pretend to be.
Daloopa
Daloopa goes deeper than the statements themselves. Its product is the operating detail underneath: thousands of KPIs across 6,000+ tickers, the segment and unit metrics that sell-side analysts rebuild by hand into models every quarter.

- KPI-level granularity, well below what a standard statement schema carries.
- Every data point is source-linked back to the document it came from.
- Built for model-building workflows rather than general application data.
- Priced on contact, consistent with a buy-side and sell-side client base.
If your work is building and maintaining company models, this is aimed squarely at you. If you need 5 standard fields across a wide universe, it is more product than the job requires.
Finnhub
Finnhub carries standardised financial statements going back 30+ years annually and quarterly, alongside as-reported financials, in one of the broadest catalogues in market data.
- Standardised and as-reported side by side, which is unusual and useful.
- 30+ years of history, deeper than most of this group.
- Global coverage on the paid plan, where the free plan is US only.
- Standardised statements start at $3,500 a month, with nothing between that and free.
Finnhub is excellent value if you are buying a complete global feed and statements are one of many datasets you need. As a way to acquire statements specifically, the step from free to $3,500 makes it a decision about the whole platform rather than about fundamentals.
SEC EDGAR XBRL
Worth naming first, because every standardised feed in this comparison is built on top of it and it costs nothing.
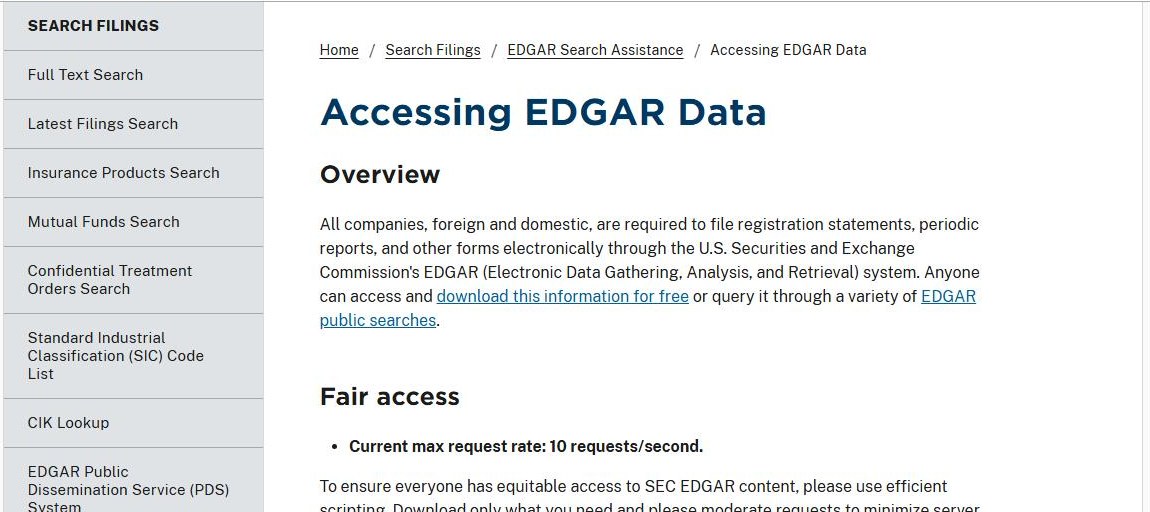
Since the XBRL mandate, issuers tag their statements, and the SEC publishes those tags through its own endpoints: company facts, company concept and frames, drawn from 10-Q, 10-K, 8-K, 20-F, 40-F and 6-K and their variants. No key is required, and the fair-access ceiling is the usual 10 requests a second per IP.
What arrives is the issuer's own tagging, which is exactly the strength and exactly the difficulty. Nothing has been renamed or reconciled, so 2 companies reporting the same concept under different tags stay different, and the mapping work is yours. That mapping is precisely what the paid options in this list are selling.
If you need what a company actually tagged, with no interpretation between you and the filing, this is the source of record and everything else is a convenience layer over it.
sec-api.io
A converter rather than a curated dataset, and that framing explains both what it is excellent at and what it leaves to you.
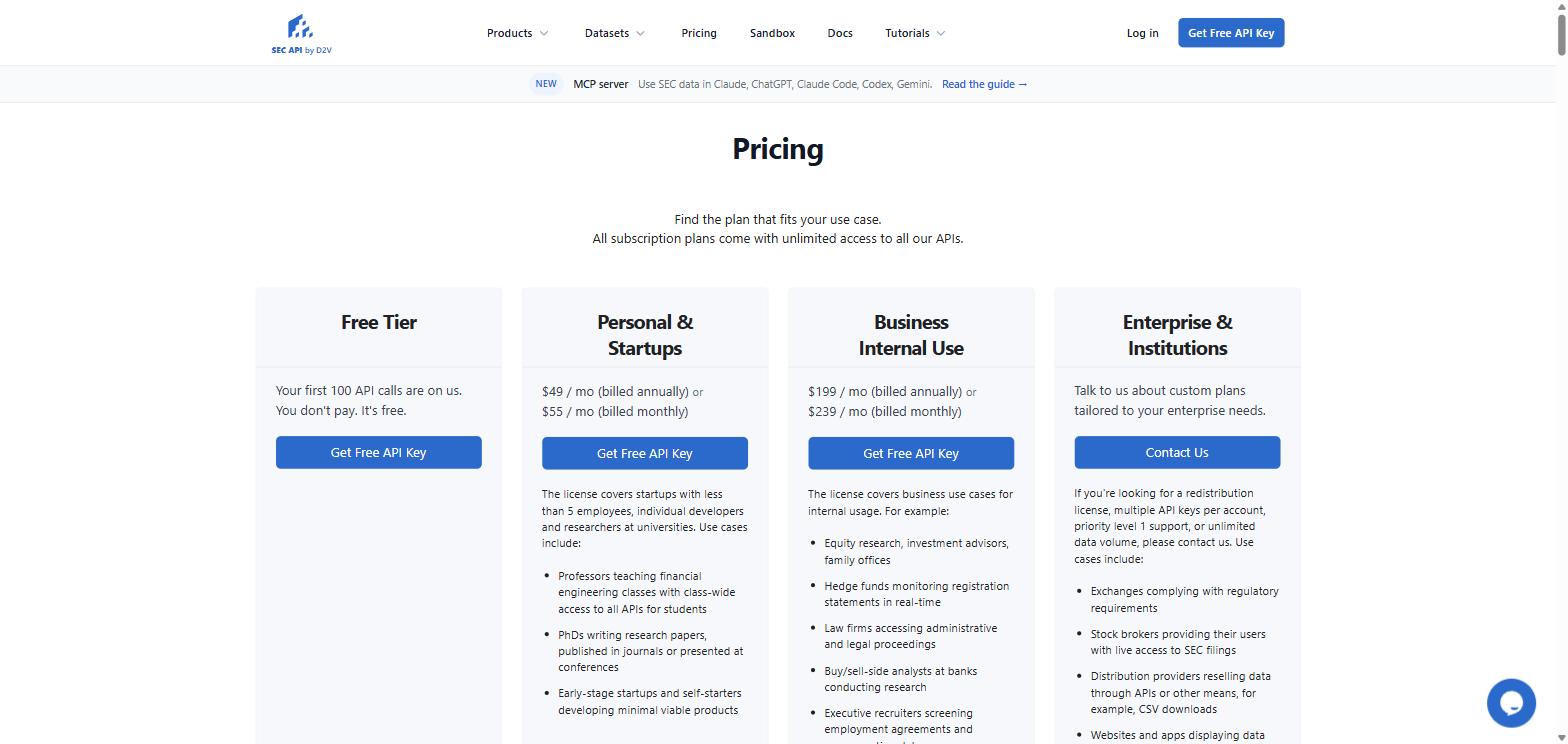
- XBRL turned into standardised JSON, covering income statements, balance sheets, cash flow statements and statements of shareholder equity.
- US GAAP names normalised, so you are not matching strings against every issuer's house style.
- Segment data included, breaking revenue and expense down by product, geography and business segment, which is unusual to get without a separate product.
- Wide form coverage, including 10-K, 10-Q, S-1, 8-K, 20-F, 40-F and investment company filings.
- XBRL from 2005 to present for any XBRL-friendly filing, covering active and inactive filers, with new filings converted within 300 milliseconds of publication.
Inactive filers plus 300 millisecond conversion is a strong pairing. It means a historical panel keeps the companies that later disappeared, and a live pipeline sees the numbers essentially as they land.
Financial Modeling Prep
FMP is the low-friction entry point in this comparison, and its statement coverage sits alongside prices, filings and ownership on the same key.
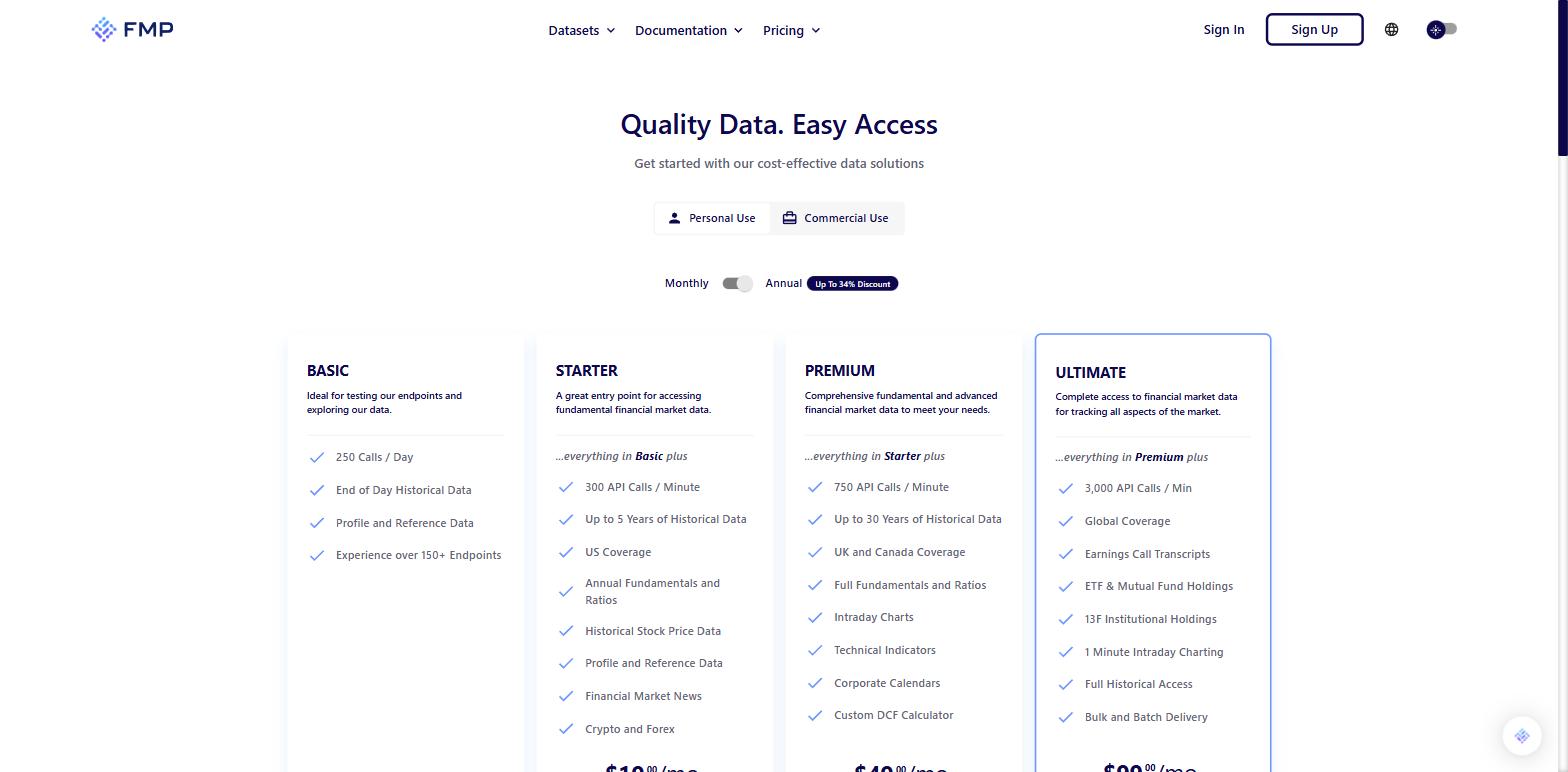
- Standardised income statement, balance sheet and cash flow endpoints, plus as-reported variants for cross-checking.
- History scales with the plan, 5 years at $19 a month and 30 years at $49.
- A free tier allowing 250 calls a day, which is enough to decide whether the schema fits before you pay anything.
- Bandwidth ceilings on a trailing 30 days, from 500 MB free up to 150 GB, which is the limit bulk statement pulls actually run into.
Read the history column rather than the call column when you pick a tier here. Five years is one full cycle at best, and for anything measuring performance across a downturn that is the constraint that will bite first.
Intrinio
Intrinio structures its plans around what you are permitted to do rather than which datasets you receive, which makes the licensing question unusually easy to settle early.
- US fundamentals sourced directly from SEC filings, sitting alongside prices, ownership and corporate actions on the same platform.
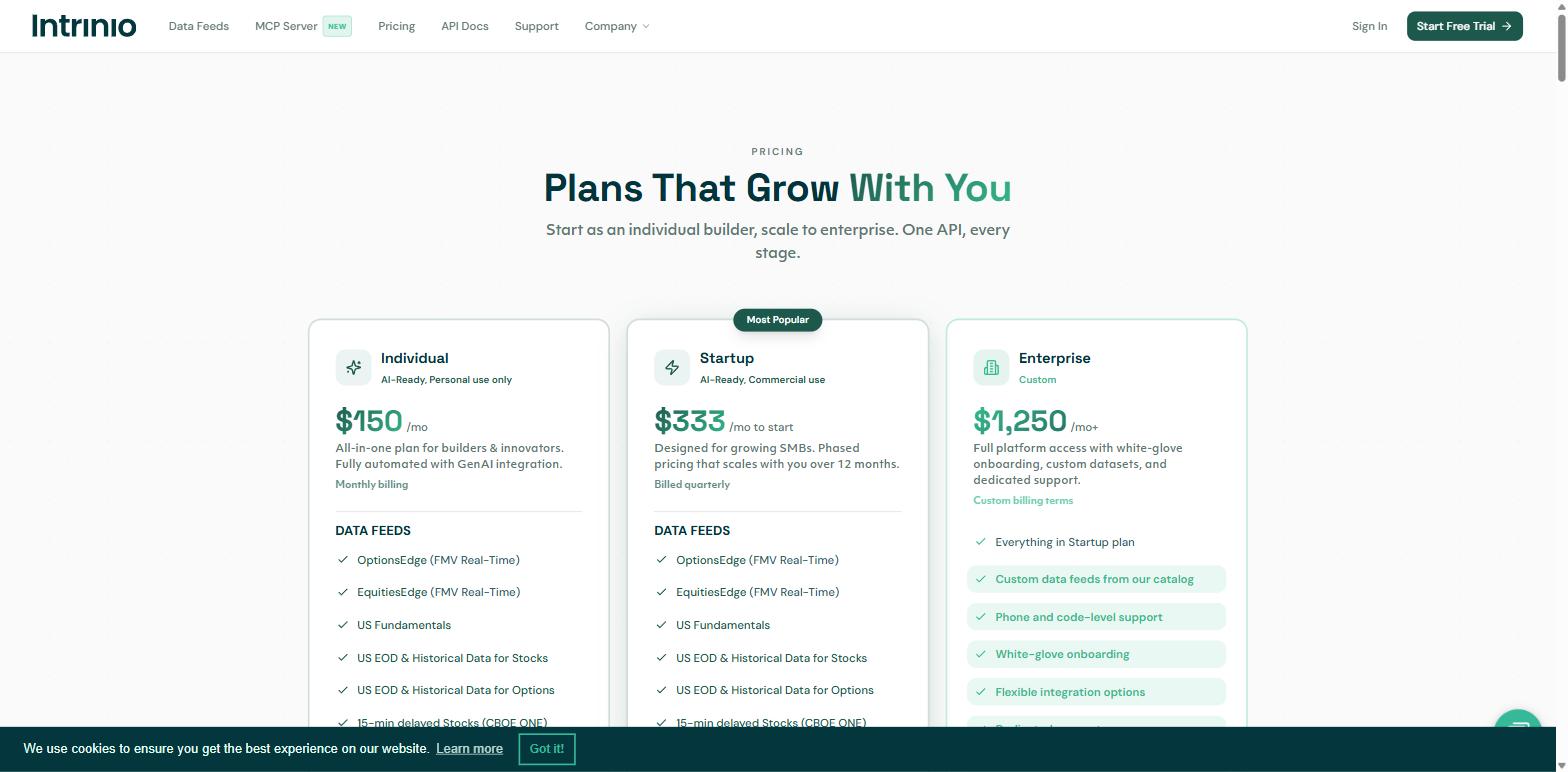
- Individual at $150 a month, personal use only, one seat, with no redistribution or display rights.
- Startup from $333 a month billed quarterly, carrying commercial use and display rights on a business-wide licence.
- Enterprise from $1,250 a month, with custom feeds, an SLA and an account manager.
- Delivery through API, CSV, Snowflake or S3, which matters if your team works in a warehouse rather than against REST.
If you already know you will be displaying these numbers to your own users, the licence tier is the real price here and it is worth pricing against that from the start rather than against the entry figure.
EODHD
EODHD sells fundamentals as a discrete product rather than a tier of a bundle, which makes the pricing unusually easy to reason about, and it has the longest history in this comparison.
- The Fundamentals Data Feed is $59.99 a month, with 100,000 API calls a day.
- US companies from 1985, non-US from 2000, and minor companies around 6 years.
- Insider transactions and earnings per share are included in the same feed.
- Licensing needs attention. Paid plans are sold for personal use, and commercial applications are licensed separately.
For long histories at a predictable monthly price this is the strongest value in the group. Settle the licence before you build if the output is going into a product.
Business Quant
The 2 problems described at the top of this article are the ones our API was designed around: that no single template describes every industry, and that a flat list of rows cannot safely be added up.
- 4 industry templates, so a bank is described with a bank's line items.
- 5 statement views, the 3 statements plus Ratios and Growth, precomputed.
- Annual, Quarter and TTM, with trailing-twelve-month aggregates computed rather than assembled from 4 quarterly pulls.
- Every row carries its type and order, so the statement rebuilds as presented.
- Every value returns twice, a full-precision
rawnumber for calculation and a compactfmtstring for display, alongside both the reported date and a normalised date. - Parsed from 5 filing types: 10-K, 10-Q, 20-F, 40-F and 6-K, so foreign private issuers are covered rather than silently dropped.
- Earnings releases parsed within 10 to 15 minutes, weeks before the 10-Q.
- 20+ years of history, free to use, with commercial distribution on enterprise.
Templates, statement views and a sample response are in the Financial Statements API documentation.
2 limits worth stating. Coverage is US-listed companies, which does include foreign private issuers filing with the SEC, but a company listed only in Frankfurt or Tokyo that files nothing here is absent entirely. And there is no as-filed view, so when you want the company's own labels back rather than a mapped schema, this is not where you get them.
Working with statements in the Business Quant API
| What you want | How you get it |
|---|---|
| A bank described like a bank | The capital_markets template, named in metadata |
| Margins and returns without the arithmetic | statement=Ratios |
| Growth rates precomputed | statement=Growth |
| Rolling twelve-month figures | frequency=TTM |
| To sum rows without double counting | Filter itemtype to lineitem |
| To rebuild the statement layout | The 4 ordering keys on every section |
| Numbers for maths and for display | raw and fmt on every value |
| ADRs and foreign filers included | 20-F, 40-F and 6-K are parsed |
| Results on announcement day | 8-K and 6-K earnings releases, within 10 to 15 minutes |
Which one I would build on
If your universe is US-listed and you need statements you can compare across companies without writing a mapping layer, start with Business Quant.
The case rests on 3 specifics you can check in an afternoon. Banks, REITs and utilities get their own templates rather than a generic one with empty fields, and the response tells you which was applied. Every row is flagged as a component or a subtotal, so the most common quiet error in this dataset is a filter rather than a bug you find months later. And earnings releases are parsed, so the numbers arrive on results day rather than at the next filing.
Run this test, because it separates the providers faster than any feature table. Pull the income statement for a commercial bank and a REIT. Look at what lands in gross profit and whether funds from operations exists at all. Then pull a company that reported last week and check whether its figures are there yet.
Those 2 pulls are the whole comparison in miniature. A provider that hands a bank the same template as a software company has made a decision on your behalf, and you will not find out which decision until a ratio comes back wrong.
For the filings underneath these numbers, see the SEC filings API comparison. For how statements sit alongside prices, ownership and macro in a full stack, the EOD stock data API comparison covers it.
How this comparison was made
One test decided the roster: financial statement data returned through a documented API. Providers were not excluded for carrying fundamentals alongside other datasets, or for appearing in other comparisons on this site, because most of them sell overlapping buckets and holding one back to keep rosters tidy would leave visible holes.
Prices, limits and coverage figures were read off each vendor's own published material on 13 August 2026, not from other roundups, and screenshots are dated where they appear. Where a vendor does not publish a figure, the table says so rather than carrying an estimate.
Every provider here is described from its own published material rather than characterised, and Business Quant appears in roster order rather than at the top. Business Quant, which publishes this page, makes one of the 10 products compared here.
Image credits. Header photograph by m. on Unsplash, used under the Unsplash License. Diagrams are Business Quant originals.
Frequently asked questions
Is there a free financial statements API?
Business Quant is free to use for normalised statements across 20+ years, with commercial distribution on the enterprise plan. SimFin publishes a free tier covering 5,000 US stocks with 5 years of history. Beyond those, statements usually sit on a paid tier because normalising them is the expensive part of the business.
What does standardized mean for financial statements?
That a filer's own labels have been mapped onto a common schema, so one company calling something "net revenues" and another calling it "total sales" both land in the same field. Without it you cannot compare 2 companies without writing a mapping by hand, and that mapping breaks whenever a filer restructures its statement.
How quickly do financial statements appear after a filing?
Business Quant publishes within 10 to 15 minutes of a filing being published on EDGAR, and parses the results tables out of 8-K and 6-K earnings releases as well, which typically land weeks before the 10-Q itself. Most providers work on the filing rather than the release, so they are a reporting cycle behind on the first print.
Do these APIs cover foreign companies?
Depends on the filing types parsed. A provider that reads only 10-K and 10-Q silently drops every foreign private issuer, because those file 20-F, 40-F and 6-K instead. If your universe includes ADRs, check which forms a provider parses rather than assuming ticker coverage implies statement coverage.