11 Best Seeking Alpha Alternatives for 2027
Seeking Alpha Premium renews at $299 a year. 11 alternatives compared on price, statement data, estimates, ownership, export and API access.


Seeking Alpha Premium renews at $299 a year, and its contributor articles, Quant Ratings and stock and ETF screeners all sit behind that paywall. A free Basic account gets breaking news and one Premium article.
Below are 11 Seeking Alpha alternatives for researching US stocks, from rating and picks services to data platforms. We compare them on price, statement data, estimates, ownership, data export and API access.
What Seeking Alpha Premium sells
Seeking Alpha's plans page splits Premium into 2 halves. The first is opinion: in-depth analysis from independent contributors, Quant Ratings from Strong Buy to Strong Sell, rankings of top stocks and ETFs, an AI research assistant and AI summaries of earnings calls. That is Seeking Alpha's own product, and nothing on this list reproduces it exactly. The second is tools: stock and ETF screeners, plus portfolio health and alert tools. Those screens run on statements, estimates and growth figures that other sites publish too.
So the useful question is whether you are paying $299 a year for the opinions or for the data. If it is the opinions, you want another source of calls: Morningstar's analysts, Motley Fool's picks, the Zacks Rank or WallStreetZen's grades. If it is the data, you can pay much less for more of it, and in some cases nothing. Seeking Alpha's $4.95 first month is a cheap way to find out which half you actually use.
How to choose a Seeking Alpha alternative
Four questions settle it.
- Opinions or data? A rating or pick you act on, or numbers you analyse yourself.
- Depth of data. Statements, estimates, segments and ownership, and how far back they go.
- Data out. Spreadsheet export or an API on the plan you would buy.
- Price. The cost of the first plan that covers what you need.
If you mainly want help with the analysis itself, our AI stock analysis tools comparison covers the assistants that read filings for you.
The 11 Seeking Alpha alternatives at a glance
- Koyfin
- MarketBeat
- Morningstar
- Motley Fool
- Simply Wall St
- Stock Analysis
- Stock Rover
- WallStreetZen
- Yahoo Finance
- Zacks
- Business Quant
| Platform | Best for | Plans from |
|---|---|---|
| Koyfin | Dashboards and charting | $39/mo |
| MarketBeat | Analyst ratings and price targets | $20.75/mo |
| Morningstar | Analyst fair values and moat ratings | $20.75/mo |
| Motley Fool | Monthly stock picks | $199/yr |
| Simply Wall St | Visual company reports | $10.95/mo |
| Stock Analysis | Low-cost data and long history | $6.58/mo |
| Stock Rover | Deep screening and scoring | $24/mo |
| WallStreetZen | Quant grades for beginners | $19.50/mo |
| Yahoo Finance | News, quotes and free fundamentals | $7.95/mo |
| Zacks | The Zacks Rank and earnings estimates | $249/yr |
| Business Quant | Statements, estimates, segments and ownership with export and API access | $29/mo |
Rows are alphabetical, Business Quant last. "Plans from" is the cheapest paid plan's lowest advertised monthly price on 16 October 2026, or its yearly price where only that is advertised. For comparison, Seeking Alpha Premium renews at $299 a year.
Seeking Alpha alternatives reviewed
Koyfin
Koyfin is a market terminal for individual investors and advisers, built around dashboards, charts and watchlists. A company's statements, estimates and filings sit one click from its chart.
- Best for dashboards, charting and comparing a stock with the market.
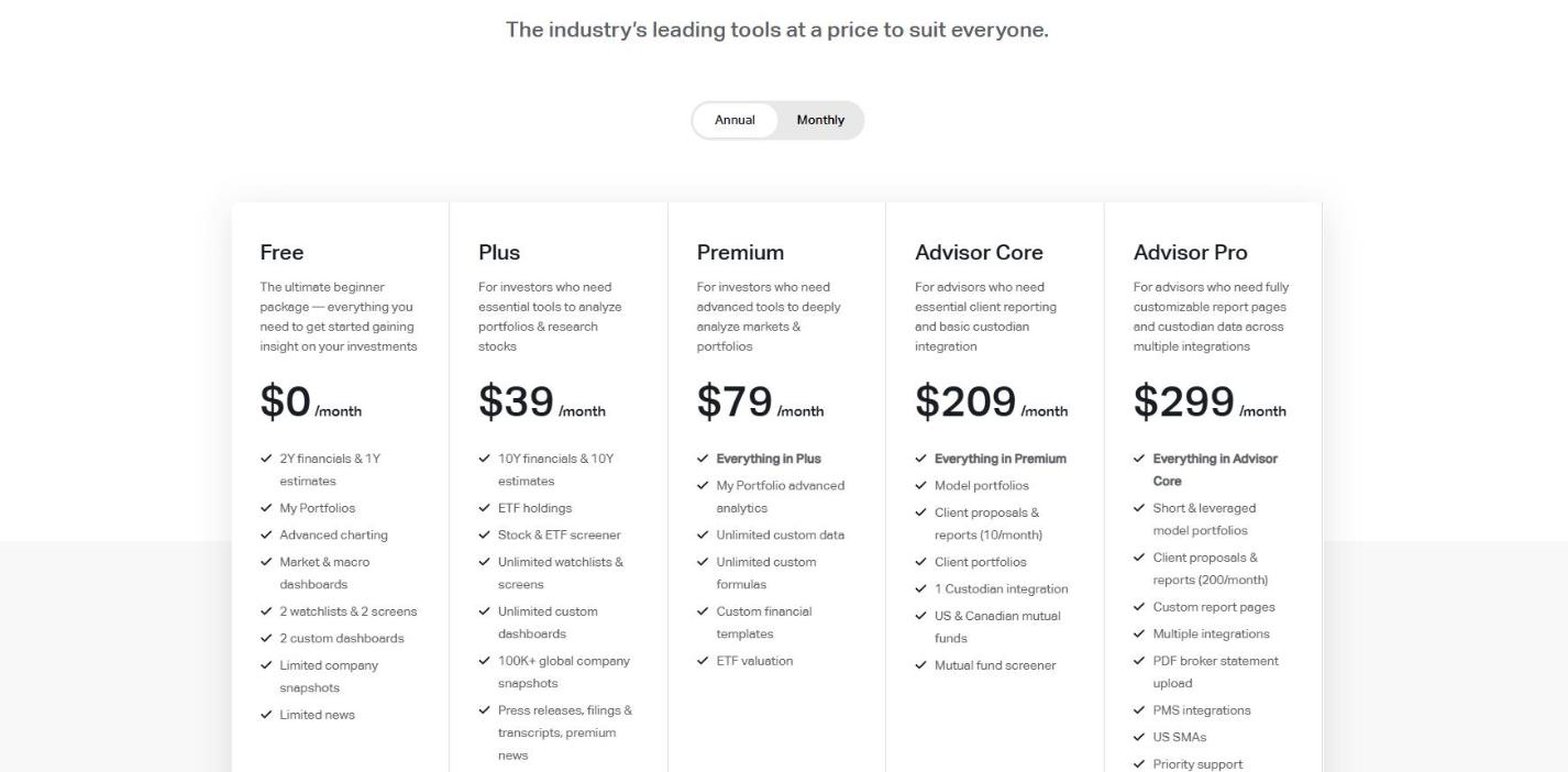
- Free plan with 2 years of financials, 1 year of estimates and 2 screens.
- Plus from $39 a month, with 10 years of financials and estimates.
- Filings, transcripts and premium news from Plus.
- Premium $79, with custom formulas and financial templates.
Koyfin is the closest thing here to a professional workstation. Its free plan is a working account rather than a trial, and its paid plans cover Seeking Alpha's data side with 10 years of history, filings, transcripts and news, alongside a World Economics dashboard for the macro backdrop.
Where it falls short: Koyfin's own help page says its data vendor, Capital IQ, does not allow equity financials, valuation, estimates or growth rates to be exported, so the numbers stay on screen. It has no segment or KPI data, no API, and no contributor articles or ratings of its own.
MarketBeat
MarketBeat is a financial news and data site built around what Wall Street analysts say: consensus ratings, price targets, and upgrades and downgrades.
- Best for analyst ratings, price targets and upgrades.
- Free account with ratings, estimates, insider trades and a screener.
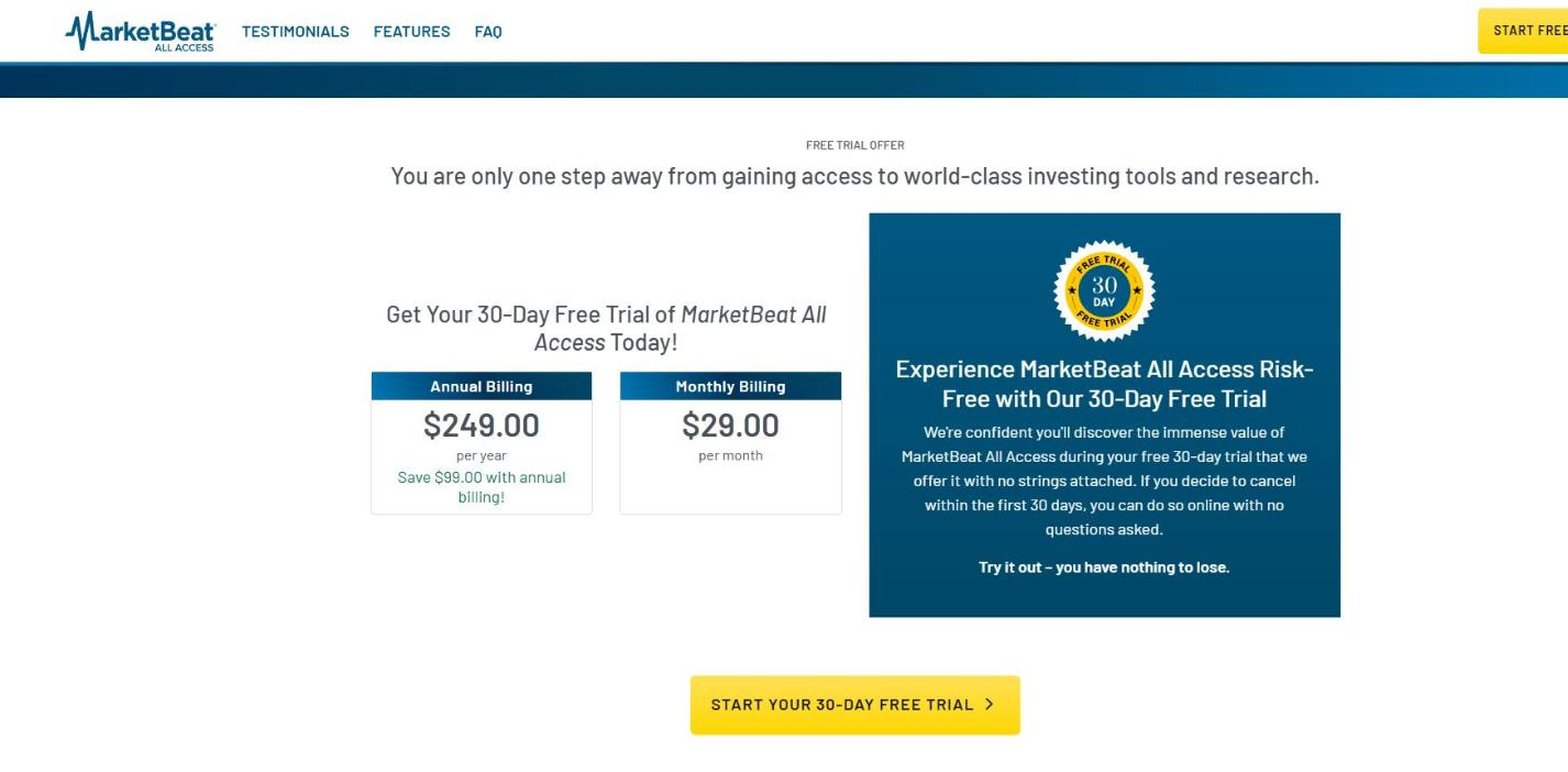
- All Access from $20.75 a month, or $29 billed monthly.
- 30-day free trial.
- Excel and CSV export on All Access.
- Insider trades, institutional ownership and SEC filings on each stock.
If what you valued in Seeking Alpha was a quick read on what analysts think, MarketBeat gives you that without paying. Each stock also has full statements, which use bank line items for a bank, and a table of its 13F holders.
Where it falls short: export and the market-wide insider and institutional buying lists need All Access. There is no segment or KPI data, and no API.
Morningstar
Morningstar is the research firm behind the star ratings and economic moat ratings most investors already know. Morningstar Investor is its subscription: its own analysts' fair value estimates and moat ratings, plus a screener and portfolio tools.
- Best for analyst fair values and moat ratings.
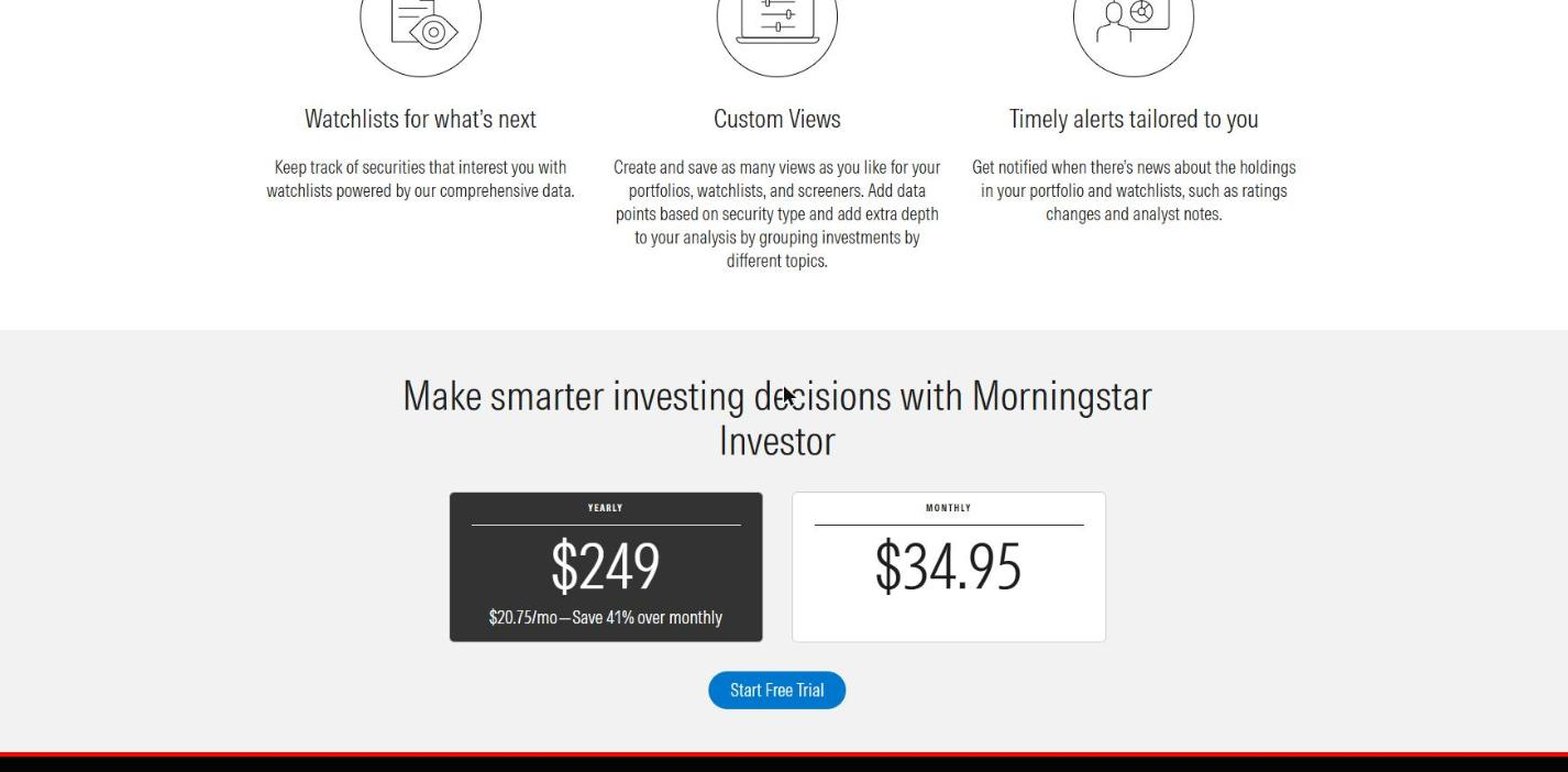
- Investor from $20.75 a month, or $34.95 billed monthly.
- Free trial before the first charge.
- Screener with more than 200 data points.
- Statements and fund and institutional holders on each stock.
Of everything here, Morningstar is the most direct swap for Seeking Alpha's opinion half, with one difference in kind: the view comes from Morningstar's own analysts rather than a community of contributors, so you get one consistent method instead of many voices.
Where it falls short: the ratings stay locked until you subscribe, we found no segment data or consensus estimates on its stock pages, and Investor documents no way to download statements. Its API and MCP server are sold only to enterprise customers.
Motley Fool
Motley Fool is a stock-picking service with over half a million premium members. Stock Advisor sends a small number of recommendations a month and argues for owning many stocks for a long time: its own page says to buy 50 stocks and hold them for at least 5 years.
- Best for a short list of long-term stock picks.
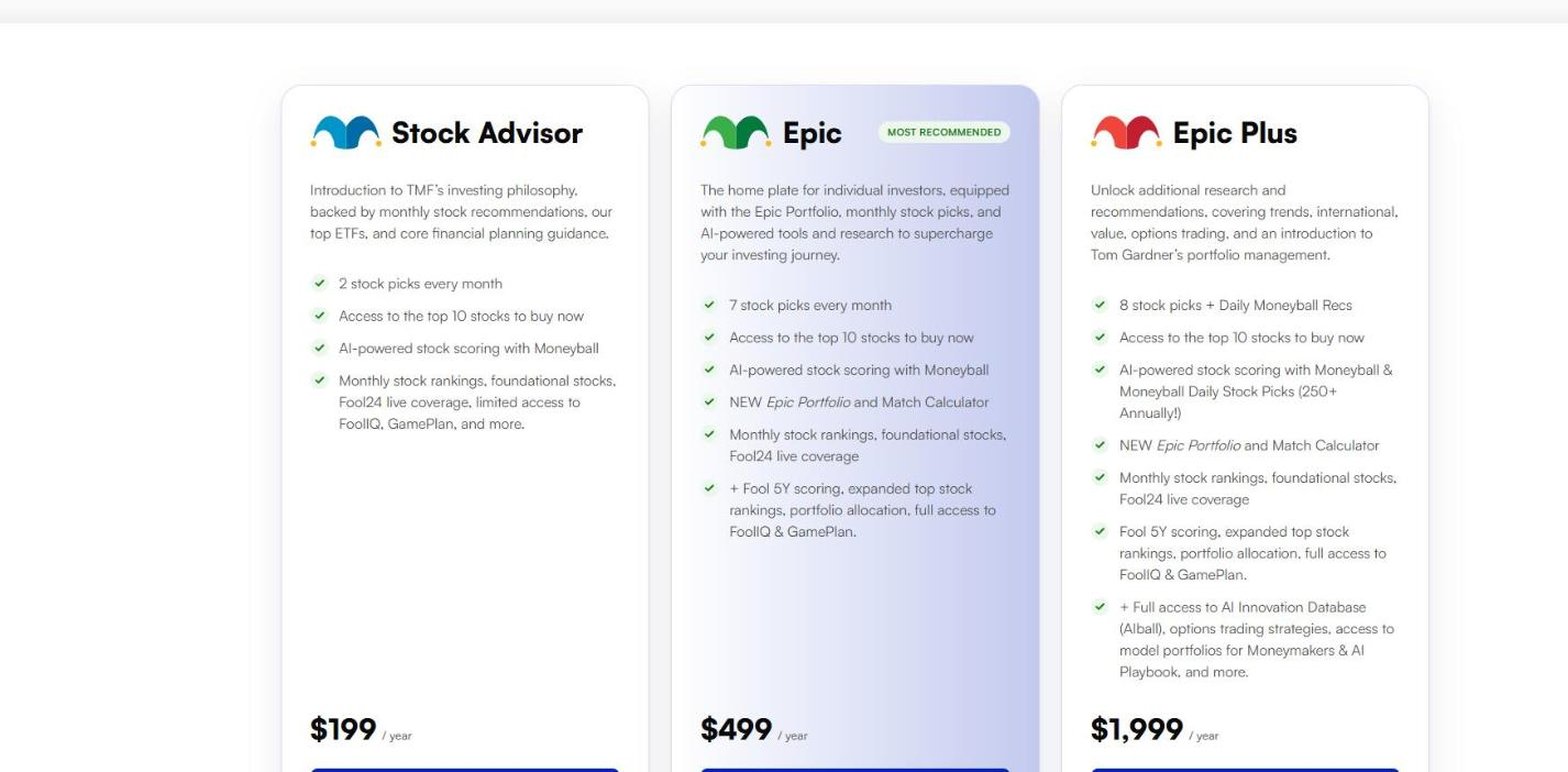
- Stock Advisor $199 a year, a promotional price for new members.
- 2 stock picks a month and the top 10 stocks to buy now.
- Moneyball scoring and monthly stock rankings.
- Epic $499 a year, with 7 picks a month.
Motley Fool answers a different need from Seeking Alpha: instead of a library of arguments about every stock, you get a few conclusions and a reason to hold them. Its quote pages also carry income statement, balance sheet and cash flow tabs.
Where it falls short: the $199 renews at the current list price after the third year, according to the page's own footnote. Stock Advisor lists no screener, its quote pages show no consensus estimates or ownership data, and there is no export or API.
Simply Wall St
Simply Wall St turns each company into a visual report, led by a Snowflake chart that scores value, future growth, past performance, financial health and dividends. Paid plans add an AI assistant.
- Best for visual, plain-language company reports.
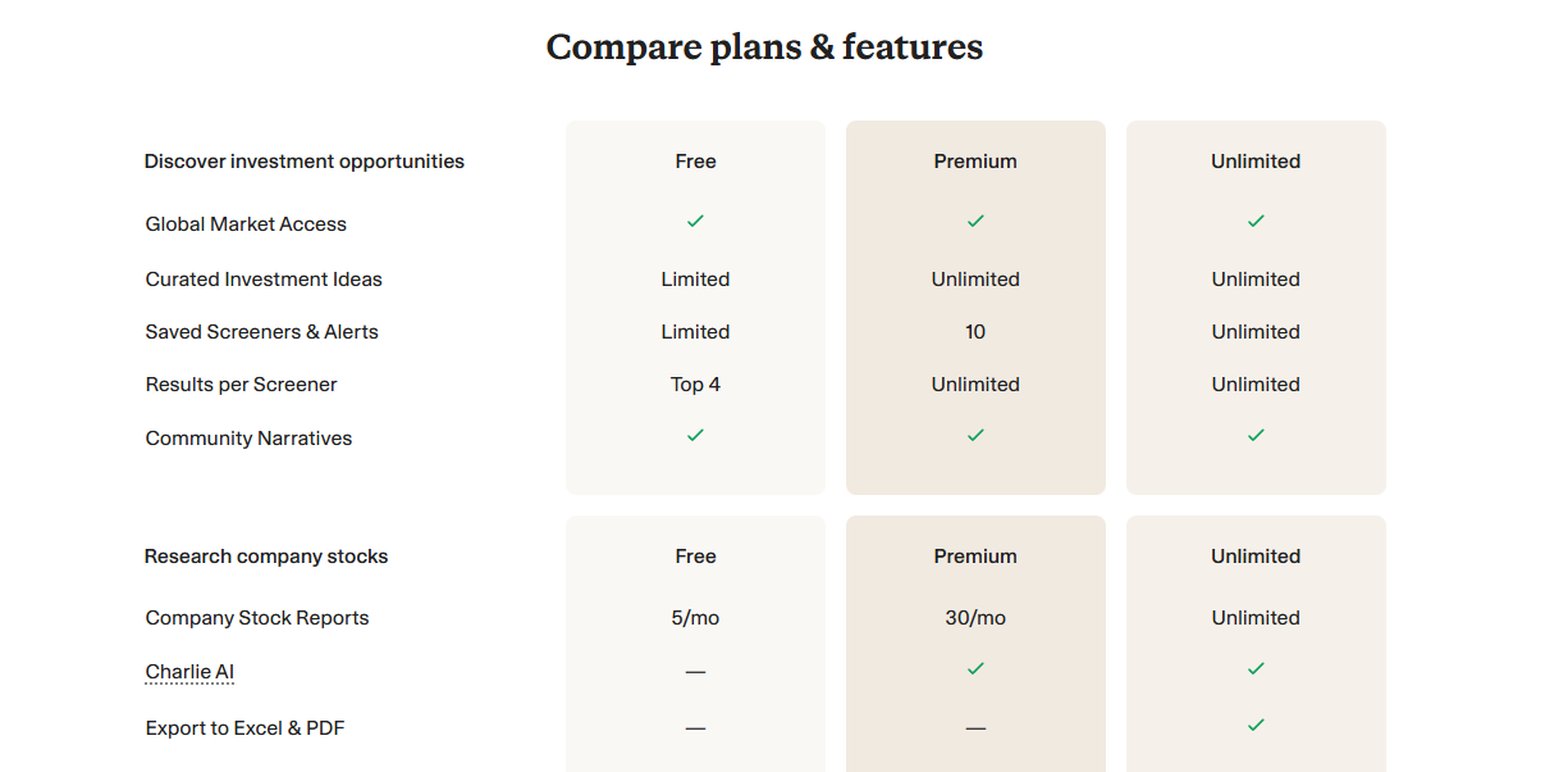
- Free plan with 5 company reports a month.
- Premium from $10.95 a month, with 30 reports and 10 screeners.
- Analyst forecasts and ownership on each company.
- Export to Excel and PDF on Unlimited only.
Simply Wall St suits an investor who finds pages of numbers hard going. Each report reads top to bottom as pictures and short verdicts. The plans limit how many companies you open, not how much you see in each, so it works best for someone following a handful of stocks.
Where it falls short: export starts on the Unlimited plan, a bank is shown with a generic gross-profit template, and there is no multi-year segment data, KPI data, filing list or API.
Stock Analysis
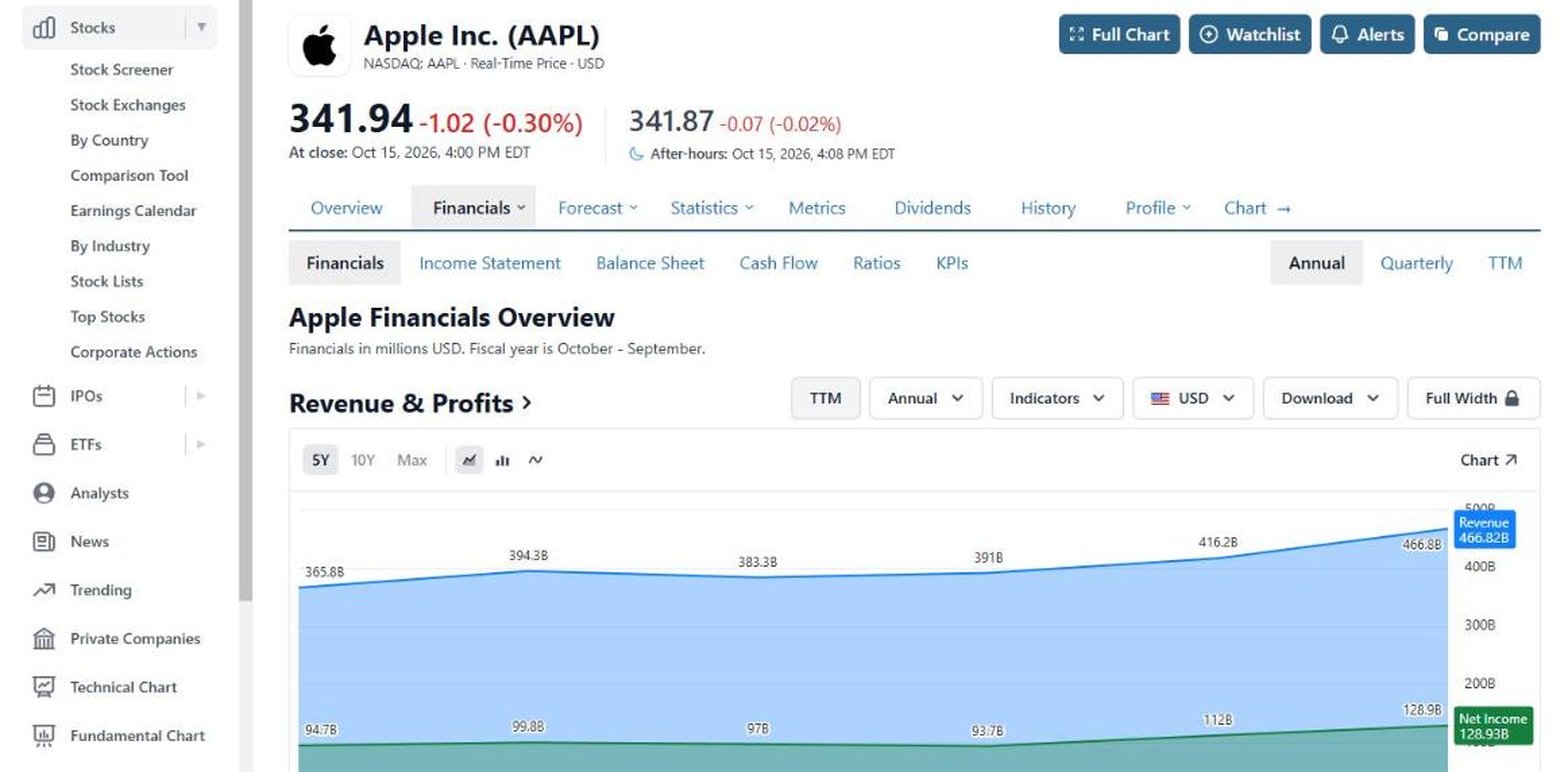
Stock Analysis is a stock data site with a free account and a low-cost Pro plan. Each stock has tabs for statements, analyst forecasts, statistics and company metrics.
- Best for low-cost data and long statement history.
- Free account with statements, analyst forecasts and a screener.
- Pro from $6.58 a month, or $9.99 billed monthly.
- 10 to 40 years of financial history on Pro.
- One download a day to Excel, CSV or Google Sheets on Pro.
- 60-day money-back guarantee.
For a reader who only used Seeking Alpha for numbers, Stock Analysis is the cheapest swap here. Its statements use bank line items for banks, its metrics tab carries segment revenue and company-specific numbers, and Pro adds saved screeners and business metrics for 50,000+ stocks.
Where it falls short: it publishes no ratings or written analysis of its own, and there is no ownership data, filing list, API or MCP server.
Stock Rover
Stock Rover is a research and portfolio platform for investors who like to work in tables, and its own comparison page ranks first for this search. Each plan buys a stated number of metrics, years of fundamentals and screens.
- Best for deep screening, scores and fair values.
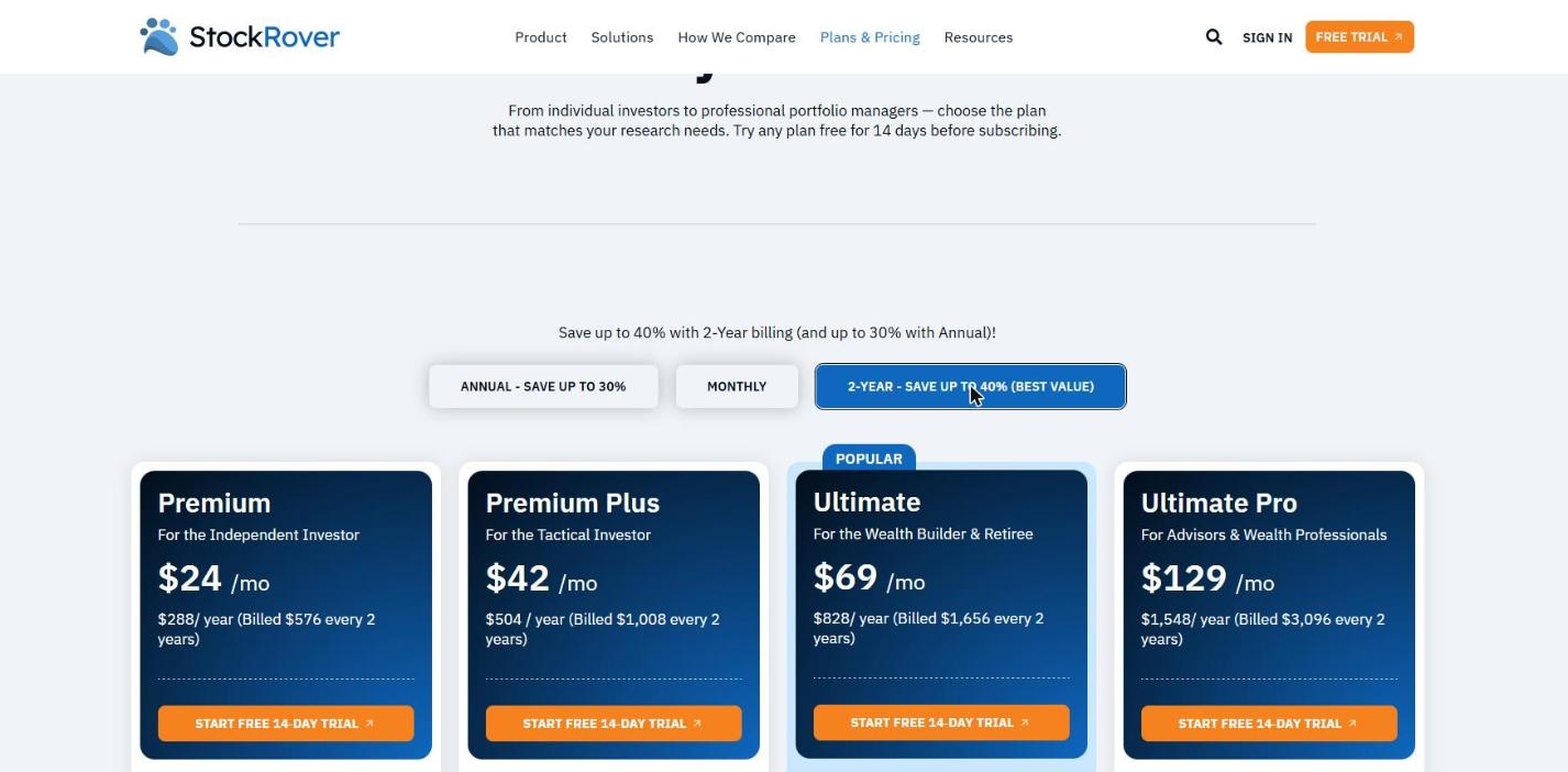
- Premium from $24 a month on 2-year billing.
- 300+ screening metrics and 5-year fundamentals on Premium.
- Data export from the first paid plan.
- Premium Plus $42, with 10-year fundamentals and unlimited fair values.
- 14-day free trial on every plan.
Stock Rover replaces Seeking Alpha's screeners more than its articles. Premium Plus adds equation-based and historical screening, and coverage runs to 8,500+ stocks, 7,000+ ETFs and 40,000+ funds.
Where it falls short: Premium caps you at 20 stock scores, 15 screeners, 250 rows and 5 years of fundamentals. There is no segment or KPI data, no filing list and no API.
WallStreetZen
WallStreetZen is a research site built around one quant model, Zen Ratings, which grades stocks from A to F on 115 factors. Like Seeking Alpha's Quant Ratings, it is a model's grade rather than a writer's view.
- Best for quant grades and top-analyst tracking.
- Free account with a screener and analyst forecasts.
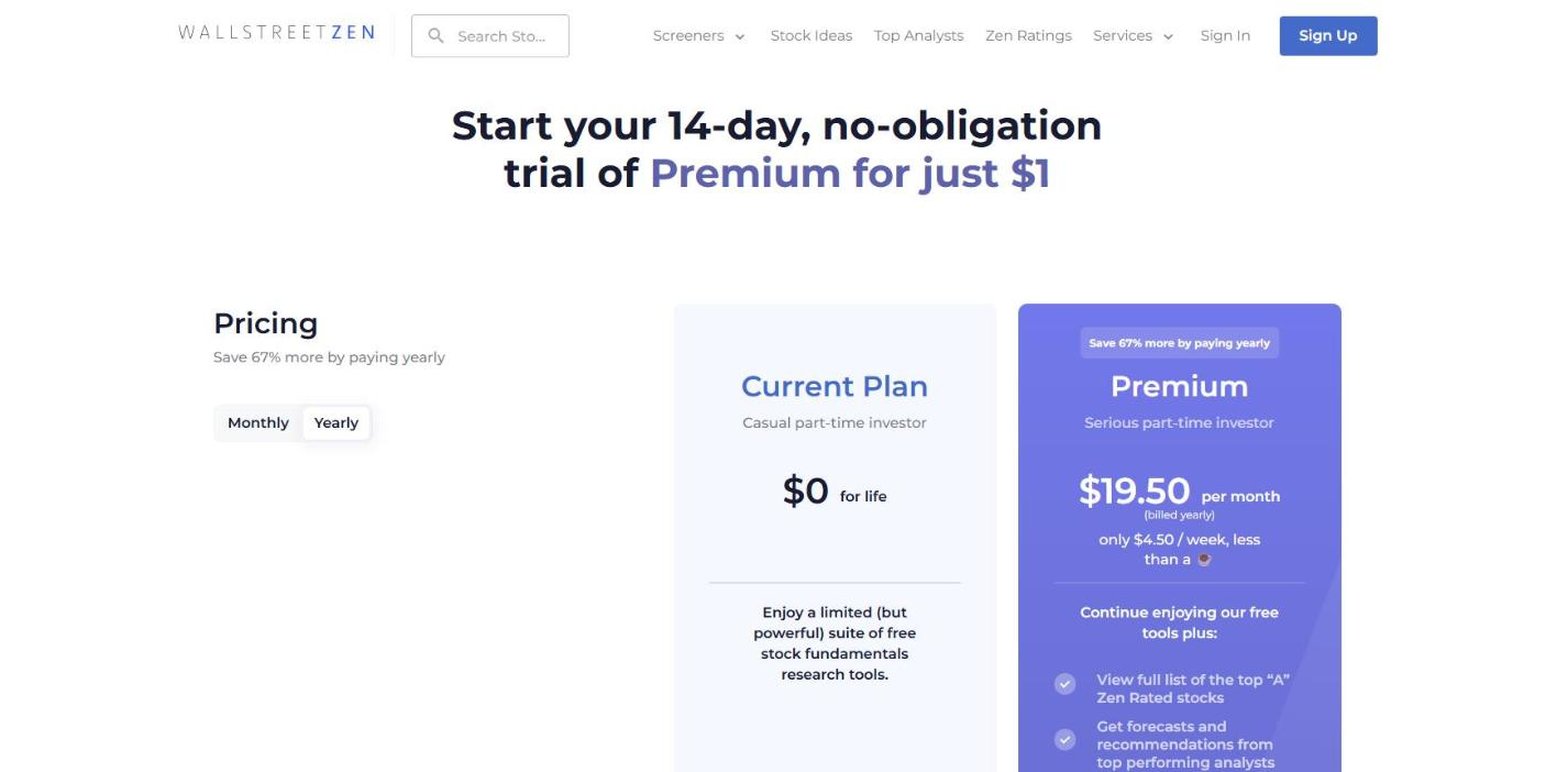
- Premium from $19.50 a month.
- $1 trial for 14 days and a 90-day money-back guarantee.
- Advanced screener and screener export on Premium.
- Insider activity and institutional holders on each stock.
WallStreetZen says only 231 of the 5,300+ US stocks it covers are A-rated, and that A-rated stocks averaged 28.50% a year since 2006 by its own count. Premium also opens its Top Analysts database, which tracks 4,000+ analysts.
Where it falls short: stock pages show summary financials rather than full statements, so there is no segment, KPI or filing data to dig into, and there is no API.
Yahoo Finance
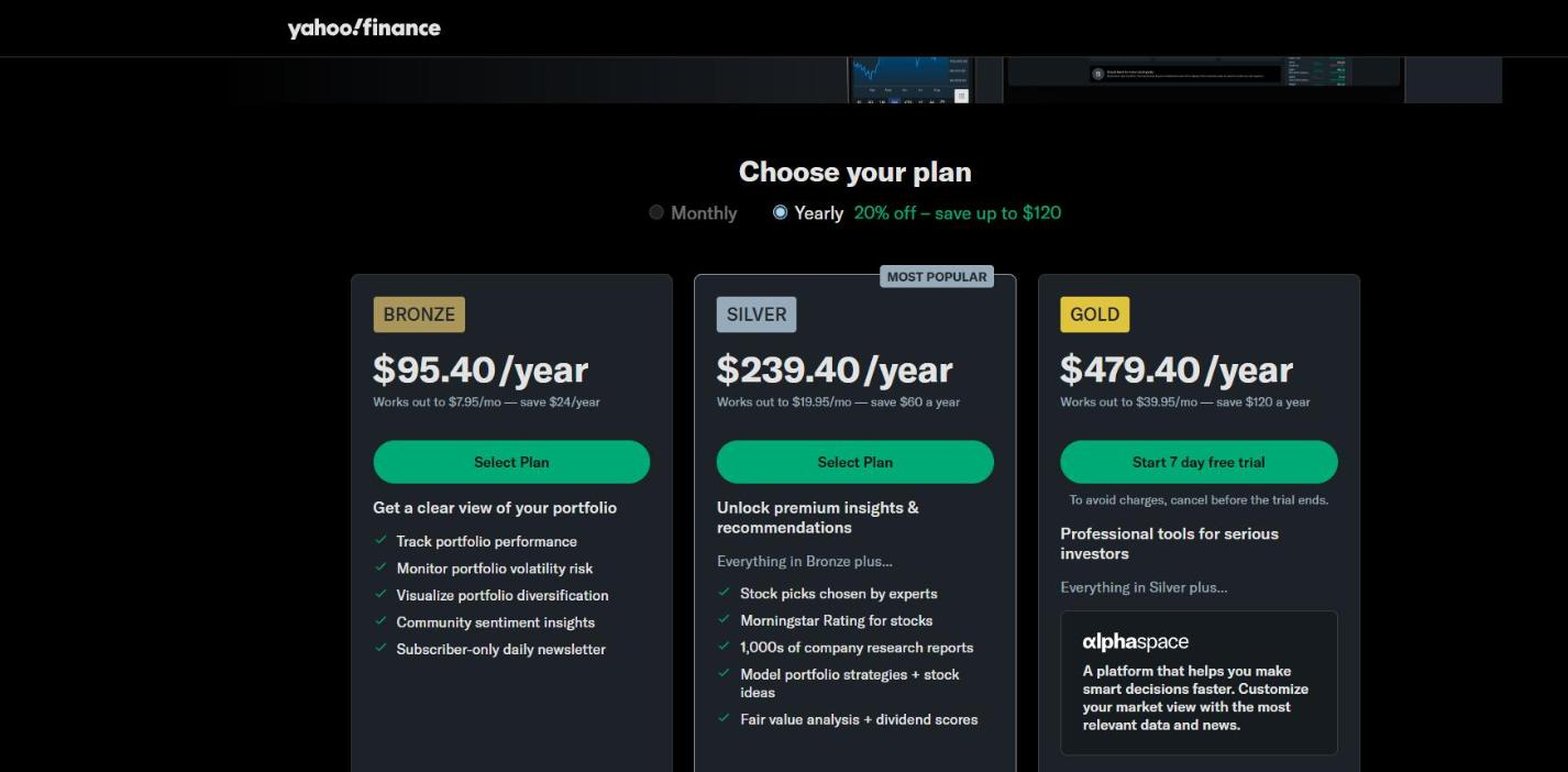
Yahoo Finance is a free quote and news site. Its paid plans add portfolio tools, third-party research and very long statement history.
- Best for news, quotes and free fundamentals.
- Free statements, analyst estimates, holders and a screener.
- Bronze from $7.95 a month, for portfolio analytics.
- Silver $19.95, with stock picks, research reports and fair values.
- Gold $39.95, with ~40 years of statements and CSV download.
Without paying, Meta's Yahoo page showed revenue estimates from 48 analysts for the current quarter, its top institutional holders as of 30 June 2026 and an insider transactions tab. That covers much of what a casual Seeking Alpha reader looks at.
Where it falls short: the ratings on Silver are Morningstar's and the research reports come from other firms. Export sits on Gold, so taking the data into a spreadsheet costs $39.95 a month rather than $7.95, and there is no segment data, filing list or public API.
Zacks
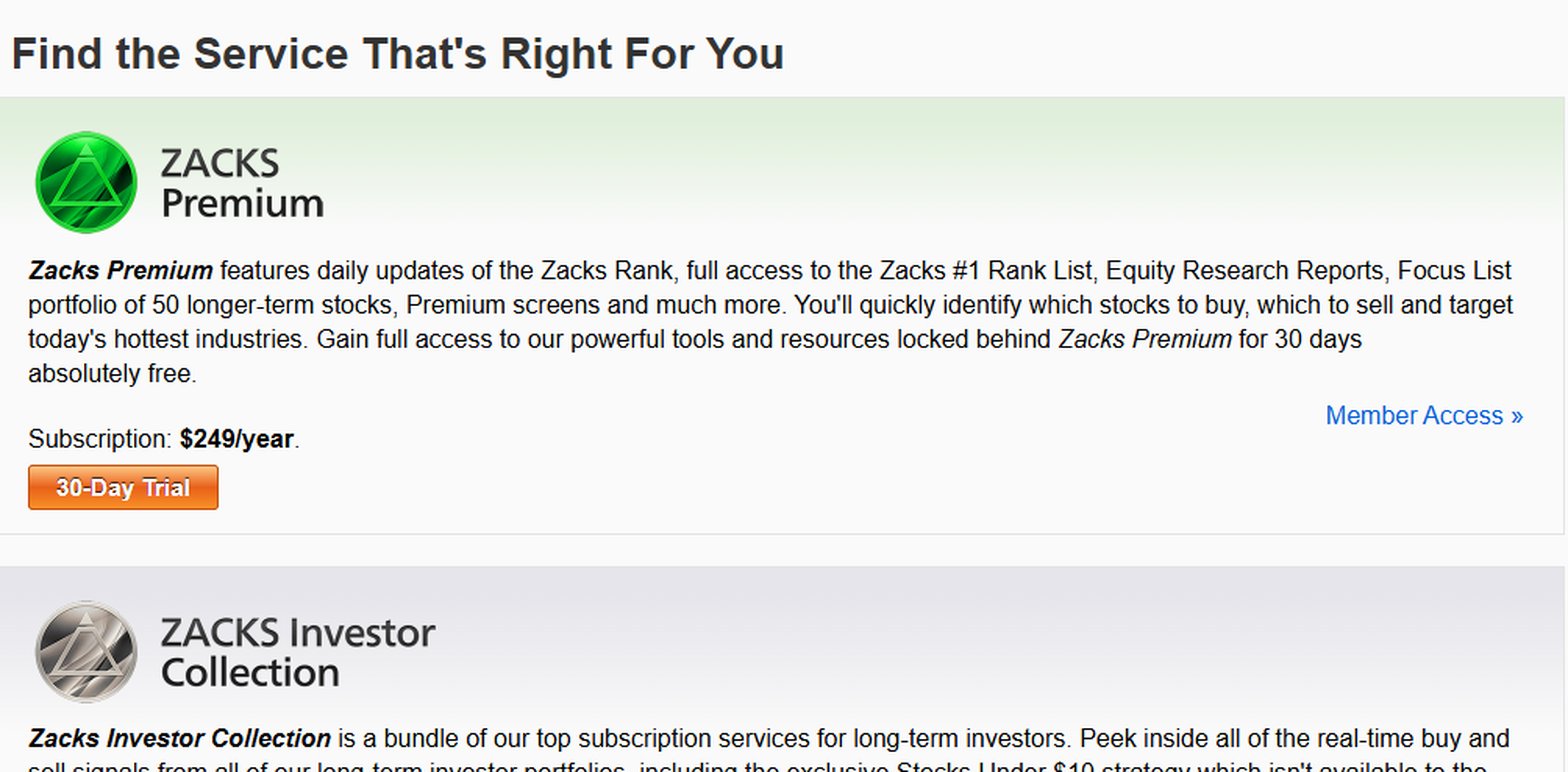
Zacks is a research firm known for the Zacks Rank, a 1-to-5 rating driven by changes in analysts' earnings estimates.
- Best for the Zacks Rank and earnings estimates.
- Free statements, consensus estimates and a stock screener.
- Zacks Premium $249 a year, with a 30-day trial.
- Zacks #1 Rank List and equity research reports on Premium.
- Focus List of 50 longer-term stocks and Premium screens.
Zacks is a natural fit for a Seeking Alpha reader who leaned on Quant Ratings: the Zacks Rank is another model-driven call, and it costs $50 a year less. Its free pages carry a full consensus estimate table and an insider transactions page for each stock.
Where it falls short: its statements use one generic template for every company, so a bank shows sales and gross profit rather than interest income. No export is described on the pages we read, and there is no segment or KPI data or API.
Business Quant
Business Quant is ours. We sell no ratings or picks. We publish the numbers a rating is built from, for every US-listed stock, one page per company.
- Best for statements, estimates, segments and ownership with export and API access.
- Free to use, 5 years and 20 quarters, no card.
- Pro from $29 a month, full history, export and API access.
List of features
- Financial statements: annual, quarterly and TTM
- 4 standardised statement templates: general, real estate, utilities and capital markets
- Financial results from 10-K, 10-Q, 8-K, 20-F, 40-F and 6-K filings
- Ratios and growth metrics
- History page for every line item
- CSV and XLSX download
- Segment financials
- KPI and operating data
- Analyst estimates
- Bull and bear investment thesis
- Dividends
- BQ-MICS industry classification: 11 sectors, 71 industry groups, 288 industries
- Industry financials
- Peers
- Stock screener
- Time series tables
- Advanced charting
- Institutional ownership and insider trades
- 18 million+ SEC filings since 1993
- Economic data
- Portfolio tracker
- API access
- MCP server
- Results within 10 to 15 minutes of release
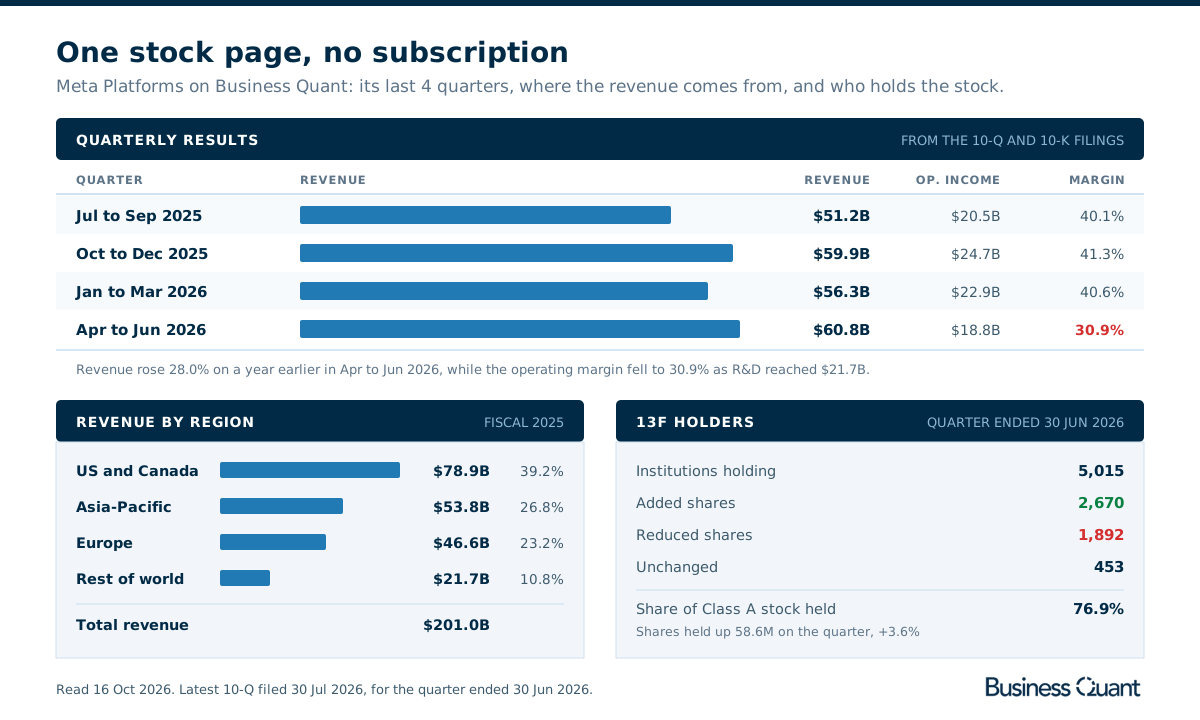
Every stock page carries the same tabs, from an overview with a bull and bear investment thesis to statements, estimates, segments, ownership and filings. The figure above is one of those pages: in its June 2026 quarter, Meta's revenue rose 28% on a year earlier while its operating margin fell to 30.9%. Statements are standardised on one of 4 templates, so a bank shows bank line items rather than a retailer's.
We take results from 10-K, 10-Q, 20-F and 40-F filings, and also from the 8-K and 6-K filings that carry earnings releases, so a new quarter appears within 10 to 15 minutes of the release. The screener filters more than 700 metrics and runs without an account, and Pro adds the full statement history, company KPIs such as subscribers and deliveries, longer segment history, CSV and XLSX downloads and our API. If you would rather ask questions than click, the MCP server brings the same data into Claude and ChatGPT.
Seeking Alpha alternatives feature by feature
| Platform | Spreadsheet export |
Industry‑specific statements |
Segment financials |
Company KPIs |
Analyst estimates |
Insider & Inst. Ownership |
SEC filings |
Economic data |
API access |
MCP server |
Plans from |
|---|---|---|---|---|---|---|---|---|---|---|---|
| Business Quant | ✓ | ✓ | ✓ | ✓ | ✓ | ✓ | ✓ | ✓ | ✓ | ✓ | $29/mo |
| Koyfin | ✗ | ✓ | ✗ | ✗ | ✓ | ✓ | ✓ | ✓ | ✗ | ✗ | $39/mo |
| MarketBeat | ✓ | ✓ | ✗ | ✗ | ✓ | ✓ | ✓ | ✗ | ✗ | ✗ | $20.75/mo |
| Stock Analysis | ✓ | ✓ | ✓ | ✓ | ✓ | ✗ | ✗ | ✗ | ✗ | ✗ | $6.58/mo |
| Stock Rover | ✓ | ✗ | ✗ | ✗ | ✓ | ✓ | ✗ | ✗ | ✗ | ✗ | $24/mo |
| WallStreetZen | ✓ | ✗ | ✗ | ✗ | ✓ | ✓ | ✗ | ✗ | ✗ | ✗ | $19.50/mo |
| Yahoo Finance | ✗ | ✓ | ✗ | ✗ | ✓ | ✓ | ✗ | ✗ | ✗ | ✗ | $7.95/mo |
| Morningstar | ✗ | ✓ | ✗ | ✗ | ✗ | ✓ | ✗ | ✗ | ✗ | ✗ | $20.75/mo |
| Simply Wall St | ✗ | ✗ | ✗ | ✗ | ✓ | ✓ | ✗ | ✗ | ✗ | ✗ | $10.95/mo |
| Zacks | ✗ | ✗ | ✗ | ✗ | ✓ | ✓ | ✗ | ✗ | ✗ | ✗ | $249/yr |
| Motley Fool | ✗ | ✗ | ✗ | ✗ | ✗ | ✗ | ✗ | ✗ | ✗ | ✗ | $199/yr |
Sorted by ticks, ties broken alphabetically. A tick means the platform's own pages or help centre document the feature on a self-serve plan; a cross means we found no such documentation. "Spreadsheet export" refers to the cheapest paid plan. "Industry-specific statements" means a bank, for example, is shown with bank line items such as net interest income and loan-loss provisions rather than a generic template; we checked JPMorgan's income statement on each site. "Segment financials" means revenue by segment, product or geography over several years. "Company KPIs" means operating metrics such as subscribers or deliveries. "Analyst estimates" means consensus revenue or earnings forecasts. "Insider & Inst. Ownership" covers insider trades or holdings and institutional holders. "SEC filings" means a company's filing list. "Economic data" means macro series such as GDP, inflation and interest rates, not only an economic calendar. "API access" and "MCP server" mean a self-serve API and an AI-assistant connector; Morningstar sells both only to enterprise customers.
Business Quant is the only product here that ticks every column. Koyfin, MarketBeat and Stock Analysis come next with 5 each: Koyfin for its filings and economic data, MarketBeat for its ownership and filing pages, and Stock Analysis for segments and KPIs. Motley Fool ticks none, because it sells picks rather than data. A cross shows what a product was built for, not how good it is.
If screening is the part you care most about, our stock screener comparison goes deeper on filters, saved screens and export, and our stock analysis websites guide compares the data-led research sites.
Which Seeking Alpha alternative is right for you?
- You want dashboards and global charts: Koyfin.
- You want to know what Wall Street analysts think, without paying: MarketBeat.
- You want analyst opinions from one consistent method: Morningstar Investor.
- You want a few long-term picks: Motley Fool Stock Advisor.
- You want visual reports on a handful of stocks: Simply Wall St.
- You want long history for a few dollars a month: Stock Analysis Pro.
- You want deep screening and fair values: Stock Rover.
- You want a quant grade like Quant Ratings: WallStreetZen Premium or Zacks Premium.
- You want news and free fundamentals in one place: Yahoo Finance.
- You want the numbers behind the ratings, with segments, ownership, export and an API: Business Quant.
Where I would go instead
If what you will miss is reading other investors argue about a stock, nothing here replaces that, and a subscription built on opinions is the right purchase. But if you mostly opened Seeking Alpha to check a company's numbers, I would move that work to Business Quant.
The data half of that $299 is free here. The statements, consensus estimates, revenue by segment and region, 13F holders and insider trades are on every US-listed stock's page, free to use with no card, and the screener runs without an account. New results arrive within 10 to 15 minutes of a company's release. Pro, from $29 a month, adds the full statement history, KPIs, longer segment history, export and our API.
A test you can run tonight: take the last Seeking Alpha article you paid to read, pick the 3 numbers its argument rests on, and find each one on the company's free Business Quant page. Meta's margin falling to 30.9% while revenue grew 28% is exactly that sort of number. If all 3 are there, the article was worth reading, but the data never needed a subscription.
How this comparison was made
To make the list, a platform had to let an individual research individual US-listed stocks, through per-stock financial data, a rating, ranking, picks or written analysis, or a stock screener, at a price published on its own site or at no cost, without a sales call. 11 platforms met that bar on the date checked.
Every price, plan limit and feature was read on the vendor's own pricing, plan, help or stock pages on 16 October 2026, and the screenshots were taken there. Prices are each platform's lowest advertised monthly price on that date, or the yearly price where only a yearly price is advertised. Where a page showed a local currency, the US dollar price is the one the vendor publishes for the US. The Business Quant illustration was read from our own data on the same day.
The list, the summary table and the reviews run alphabetically, with Business Quant last, and the feature table is sorted by the number of ticks, with ties broken alphabetically. We make Business Quant, one of the 11 products compared here. For the same market from the data side, our stock research tools comparison looks at where each platform's numbers come from.
Image credits. Header photograph by Jens Lelie on Unsplash, used under the Unsplash License. Vendor screenshots were captured on 16 October 2026 from each provider's own pricing, plan or stock pages and are reproduced for comparison. The Meta illustration is our own, built from our data.
Frequently asked questions
Is there a free alternative to Seeking Alpha?
Yes, for the data side of it. Business Quant is free to use with no card and shows 5 years of financial statements, analyst estimates, 13F holders, insider trades and a stock screener with more than 700 metrics on every US-listed stock. Yahoo Finance, Zacks, MarketBeat and Stock Analysis also show statements, consensus estimates and a screener without payment. What none of them gives away is Seeking Alpha's own product: its contributor articles and Quant Ratings.
Is there a free version of Seeking Alpha?
Seeking Alpha Basic is a free account with breaking news, one free Premium article, portfolios, price alerts and watchlists. The in-depth articles, Quant Ratings, AI research tools and the stock and ETF screeners come with Premium, which costs $4.95 for the first month and renews at $299 a year.
Is there anything better than Seeking Alpha?
It depends on which part you use. For opinions and picks, Morningstar Investor adds analyst fair values and competitive advantage ratings for $249 a year, and Motley Fool Stock Advisor sends 2 picks a month for $199 a year. For the numbers, Business Quant shows statements, estimates, segments and ownership for every US-listed stock, free to use, with full history, export and API access on Pro from $29 a month.
Who are Seeking Alpha's main competitors?
For ratings and picks: Morningstar, Motley Fool, Zacks, WallStreetZen and MarketBeat. For research data and screening: Business Quant, Stock Analysis, Koyfin, Stock Rover, Simply Wall St and Yahoo Finance. The first group sells a call on a stock; the second sells the data you would make the call from.
Seeking Alpha Premium vs Morningstar: which is cheaper?
Morningstar Investor is $249 a year, or $34.95 billed monthly, against $299 a year for Seeking Alpha Premium. Morningstar centres on its own analysts' fair value estimates and moat ratings; Seeking Alpha centres on contributor articles and Quant Ratings.
Seeking Alpha Premium vs Motley Fool: what is the difference?
Motley Fool Stock Advisor is a picks service: 2 stock recommendations a month, a top 10 list and Moneyball scoring for $199 a year, a promotional price for new members. Seeking Alpha Premium is a research library: contributor articles, Quant Ratings and screeners, for $299 a year.