7 Macroeconomic Data Providers Compared
Coverage is the easy part to sell and the wrong thing to buy on. Revision history, distribution rights and where the calendar sits matter more, and they are buried in the tiers.

Every macro vendor leads with a coverage number. 20 million indicators. 305 million time series. Millions across 200 countries. Those figures are real, and they are close to useless for choosing between them, because no team works with millions of series. A macro dashboard runs on 20 to 40. A country model runs on a few hundred.
What you are actually buying sits further down the page, and sometimes it is not on the page at all.
- Coverage shape, not coverage size. Depth on the economies you care about beats breadth across ones you do not, and a catalogue you cannot search is a catalogue you do not have.
- Revision history. Macro data is revised, often substantially. Whether a vendor stores what a series looked like before the revision decides whether you can backtest honestly.
- Distribution rights. Internal analysis and putting a chart in your own product are different licences almost everywhere. This is the most common renewal surprise in the category.
- Where the calendar sits. Knowing when a figure prints next is operationally more useful than another 100,000 historical series, and at least one vendor here puts it on its top tier only.
Every provider below sells macro data commercially with an API you can license. Public institutions publishing at no charge are covered separately in the free economic data comparison.
Read the licence before you read the price
This market prices on 3 axes at once: how much data you take, how many people touch it, and what you are permitted to do with it. Two vendors quoting the same headline number can be a factor apart once the third axis is settled, so it pays to know which one you need before the first call.
Non-display and internal use is the cheapest tier everywhere. You may analyse the data, build models on it and show results to colleagues. You may not put the series in front of your own customers.
Display rights let a chart of the vendor's data appear in your product. Almost every vendor treats this as a separate, higher tier, and several do not publish what it costs.
Redistribution lets your customers pull the underlying numbers out. It is the most expensive right and the one most often discovered late, usually when a customer asks for a CSV export and legal says no.
The practical advice is dull and worth following: work out which of those 3 you need before you shortlist, because it reorders the shortlist. A cheap plan you cannot ship on is not cheap.
Why revision history decides your backtest
Of the 4 things a licence buys, revision history is the one people underweight until it costs them, so it is worth being concrete about what it is.
Macroeconomic series are estimates, and estimates get revised. US GDP is published as an advance estimate, then a second estimate, then a third, then revised again in annual and comprehensive benchmark revisions years later. Payrolls are revised for 2 months after first print, and then again in an annual benchmark. Revisions are not small: a quarter that first printed as growth can end up as a contraction.
Which means a database holding only the current value of every series is a record of what we believe now, not of what was known then. Backtest a signal against that and you are handing your model information it could not have had, and the results will look better than reality by a margin you cannot measure after the fact.
Vendors handle this in 3 ways:
- Vintages stored as a first-class dataset. You can ask what the series looked like on any past date. Macrobond does this from 2018, and the free ALFRED archive does it for FRED series.
- Revision flags without full vintages. You are told a value changed but cannot reconstruct the prior view. Useful for alerting, not sufficient for backtesting.
- Current values only. The most common case, including ours. Fine for dashboards and current-state analysis, wrong for anything that simulates a past decision.
The practical rule: if your work involves acting on a signal at a point in time, revision history is not a nice-to-have and it should decide your shortlist before price does. If your work is describing the present, it does not matter at all and you should not pay for it.
The shortlist in one table
| Provider | Coverage | Revision history | Calendar in API | Published entry |
|---|---|---|---|---|
| Trading Economics | 20M series, 196 countries | Not published | Enterprise only | $149/mo |
| Macrobond | 305M series, 2,200 sources | Since 2018 | Platform feature | On contact |
| CEIC | Millions, 200+ countries | Not published | Not published | On contact |
| Haver Analytics | 250+ databases, global | As-reported archive | Not published | On contact |
| Oxford Economics | 200+ countries, 70 years | Not published | Not published | On contact |
| Nasdaq Data Link | Marketplace, varies | By dataset | No | $0 |
| Business Quant | 177 US indicators | No | Every indicator | $0 |
Scroll the table sideways to see every column. Trading Economics and Nasdaq Data Link figures are from their published pricing and documentation; Macrobond and CEIC do not publish rates.
Vendor by vendor
Trading Economics
Trading Economics has the broadest catalogue you can buy without a sales call: 20 million indicators across 196 countries, alongside markets, company financials and its own forecasts, delivered as JSON, CSV or HTML with an Excel add-in on top.
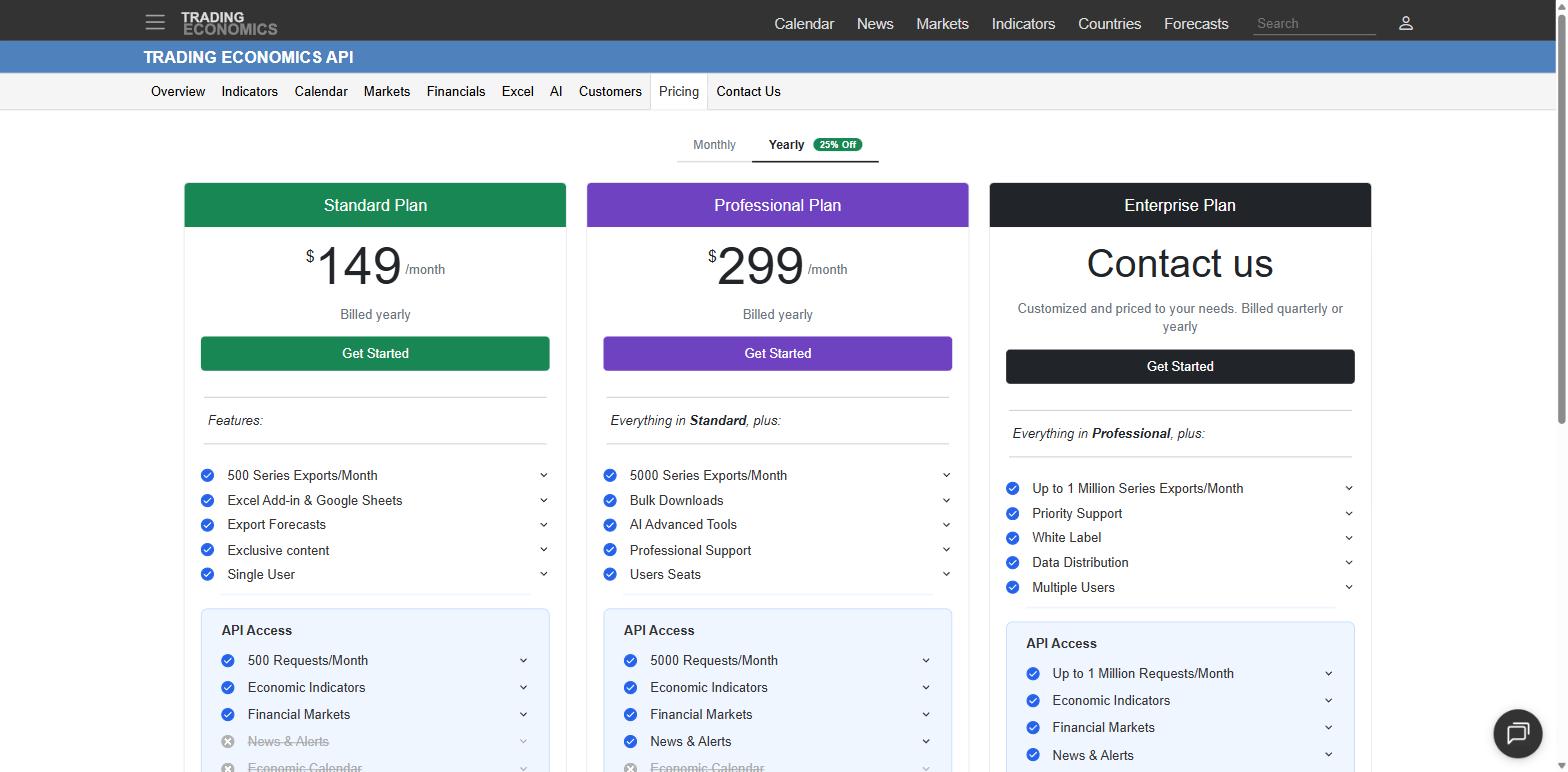
- Standard is $149 a month billed yearly: 500 series exports a month, the Excel and Google Sheets add-ins, forecasts, and a single user.
- Professional is $299 a month billed yearly: 5,000 series exports, bulk downloads, multiple seats and news alerts.
- Enterprise is priced on contact and reaches up to one million requests a month, with white labelling and data distribution rights.
- The trial is capped at 100,000 data points and 100 requests.
Two numbers deserve more attention than the coverage figure. The first is the API allowance on Standard: 500 requests a month, which is about 16 a day. That is a research licence with an API attached rather than a feed.
The second is where the economic calendar sits. Trading Economics runs one of the best-known calendars in the industry, and in the API access panel it is struck through on both Standard and Professional. Live streaming sits the same way. If the release schedule is why you are shopping, your tier is Enterprise and your price is a conversation, not $149.
Macrobond
Macrobond is the analyst desktop of this group, used by more than 900 financial and research institutions. The scale is the headline: 305 million time series drawn from over 2,200 national and international sources, which makes it the largest catalogue on this page by a wide margin.
- Revision history since 2018, stored rather than reconstructed.
- A Python Data API is published and maintained on GitHub, covering both the Web and Client APIs, so it is not a desktop-only product.
- Lite, Pro and Enterprise tiers, with pricing disclosed on contact rather than published.
- The platform is the product. Charting, analysis and presentation are built in, which is what the seat price covers.
The trade-off is shape. This is bought as a seat-based research platform, and if your use case is a handful of series feeding a service rather than analysts working in an application, you are paying for a great deal you will not open.
CEIC
CEIC is the reference for country-level depth, particularly across emerging markets where a global aggregator thins out. It carries millions of macroeconomic time series across 200-plus countries, with the granular national statistics that are hard to assemble any other way.
- A macroeconomic data API exposing the full analytical and time series content, including every metadata item and time point value.
- Modules for R, Python and EViews, which tells you who it is built for: economists working in their own tools.
- Emerging market granularity is the differentiator, down to provincial and sector detail in several economies.
- Pricing on contact, as with Macrobond.
The trade-off is the same institutional shape, plus a discovery problem. Millions of series across 200 countries is a search task before it is a data task, and the metadata and query tooling is doing as much work as the coverage.
Haver Analytics
Haver is the name you find behind a lot of professional macro work without ever seeing it, because it sits inside research departments rather than on marketing pages.
- 250+ databases, OECD, IMF and World Bank alongside country-sourced detail.
- As-reported history, kept as the data stood at a given date.
- RESTful API access through HaverView, reaching the full set of updating and archive databases, alongside the DLX software most of their users work in.
- Pricing is not published, so this is a sales conversation rather than a signup.
The as-reported archive is the reason economists pay for this. If your work involves asking what the data said at the moment a decision was taken, rather than what it says now, that archive is the product and very few vendors keep one properly.
Oxford Economics
Oxford Economics sells the forecast as much as the history, which makes it a different purchase from a pure time-series vendor.
- Hundreds of indicators across 200+ countries, from GDP to labour and trade.
- 70 years of data, with history reaching back to 1980 and baseline projections running to 2050, refreshed monthly.
- A REST API for a custom selection or the whole databank.
- Economist support included for subscribers, which is part of what you are buying at this end of the market.
- Pricing is not published.
Forecasts to 2050 across 200 countries is a genuinely different proposition from a historical series. If your models need a forward path rather than only a back history, that is the gap this fills, and it is worth separating that requirement from the data question before you shop.
Nasdaq Data Link
Nasdaq Data Link is structured differently from everything else here: a marketplace where free and open datasets from central banks, governments and multinational organisations sit next to premium datasets you license individually, all behind one key and one query pattern.
- The free tier allows 50,000 API calls a day, which is generous, with a concurrency limit of one so calls queue rather than run in parallel.
- Premium raises that to 720,000 calls a day and unlocks full database bulk downloads.
- Granular limits are published: 300 calls per 10 seconds and 2,000 per 10 minutes, so bursty jobs need pacing regardless of tier.
- Licensing is per dataset, which is a real advantage when you need one premium series and nothing else.
The trade-off is coherence. Because the catalogue is assembled from many publishers, update cadence, history depth and quality vary between datasets rather than being a property of the platform. Evaluate the specific dataset, not the marketplace.
Business Quant
Our own API is the narrowest product on this page and priced accordingly. It carries 177 US indicators across 13 categories rather than a catalogue, on the view that a curated set described properly beats a search problem for most people who need US macro.
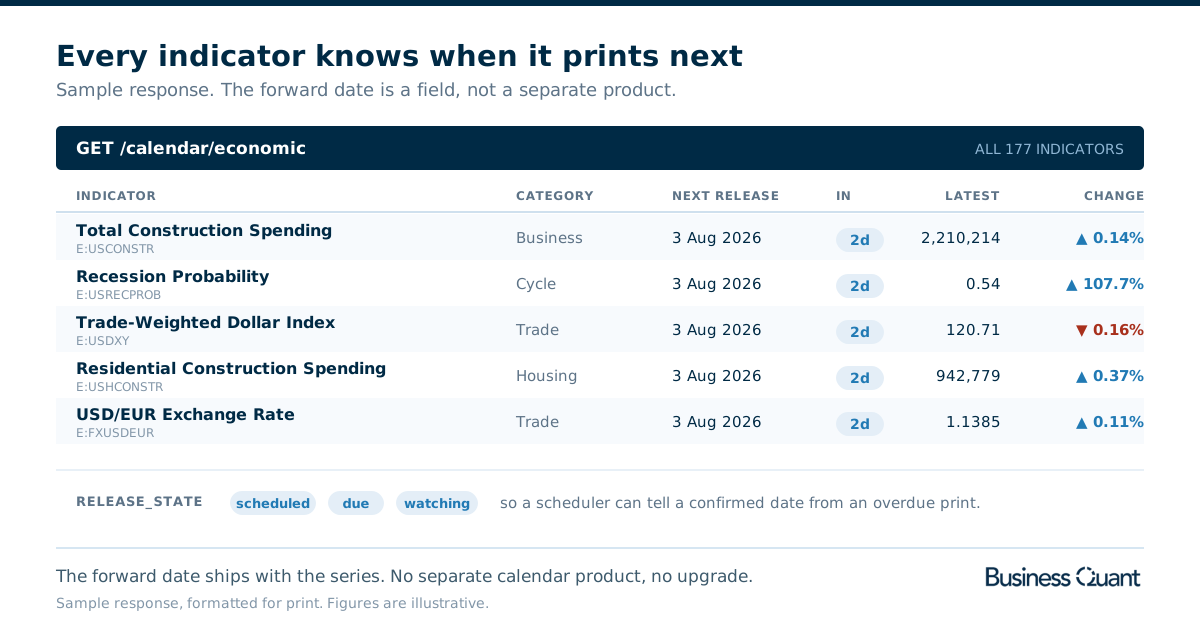
- The release calendar on every indicator, with the next date and its state.
- 4 transformation modes computed server side, so rebasing several series onto a comparable axis is a parameter rather than code you maintain.
- Metered by the minute on paid plans: 75 calls a minute on Pro at $29 a month billed annually. Set that against 500 requests a month on a $149 plan and the difference in intent is clear.
- First-party collection, parsed from source rather than resold.
- Free to use for research and development, with commercial distribution available on the enterprise plan.
- The same key covers statements, filings, ownership and segments.
The indicator list, the data series and the release calendar are documented in the Economic Indicators List API, the Economic Data API and the Economic Calendar API.
The honest boundary is coverage. This is 177 US indicators, not 196 countries, and there is no revision history. If you need Brazilian provincial statistics or a vintage of GDP as first reported, the vendors above are built for that and this is not.
How Business Quant answers each buying concern
| Buying concern | How it is handled |
|---|---|
| Cost of entry | Free to use, no card |
| Request ceiling | 30 calls a day free; 75 to 900 a minute on paid plans, Pro to Enterprise |
| Release scheduling | Included on every indicator |
| Commercial distribution | Enterprise plan |
| Data provenance | Collected and parsed first-party |
| Seat licensing | Not seat-based |
| Other datasets | Same key, shared identifiers |
| Coverage | 177 US indicators, 13 categories |
What I would do with a budget
If your macro requirement is US and your constraint is engineering time rather than country coverage, start with Business Quant, and start before you take a sales call.
The case is specific. The release calendar is included rather than reserved for a top tier, which is the single most operationally useful thing in this category. Transformations happen server side, so 3 series on one comparable axis is a parameter. There are no seats to count. And the evaluation costs nothing, so the comparison against a $149 or $299 plan is one you can run rather than model.
Here is the test I would run, because it takes about 15 minutes and it settles the question. Pull the calendar endpoint and list everything printing in the next 7 days. Take 3 of those indicators, pull their full history, and rebase them onto one axis. Then price what the same 2 calls would cost on a plan that meters requests monthly and puts the calendar behind Enterprise.
Most people who think they need a global catalogue discover they needed about 30 US series and a reliable sense of when each one updates. If that describes you, the thing you were about to buy is already sitting in front of you, and the 15 minutes above will prove it either way.
For the public and open sources underneath much of this market, see the free economic data API comparison. For how macro sits alongside fundamentals and filings in one stack, the financial statements API comparison covers it.
How this comparison was made
One test decided the roster: macro data sold commercially, with an API and a licence you can buy. Public institutions publishing their own statistics at no charge were sent to the sibling comparison instead. Everything that failed it was left out, however well known.
Prices, limits and coverage figures were read off each vendor's own published material on 13 August 2026, not from other roundups, and screenshots are dated where they appear. Where a vendor does not publish a figure, the table says so rather than carrying an estimate.
Every provider here is described from its own published material rather than characterised, and Business Quant appears in roster order rather than at the top. Business Quant, which publishes this page, makes one of the 7 products compared here, and its plan prices and limits were read from its own pricing page on 3 October 2026.
Image credits. Header photograph by Luke Chesser on Unsplash, used under the Unsplash License. The Trading Economics screenshot was captured on 13 August 2026 from its own pricing page and is reproduced for comparison. Diagrams are Business Quant originals.
Frequently asked questions
What does a paid macro data licence actually buy?
Four things, in roughly this order of importance: coverage outside the US at depth, revision history as a queryable dataset rather than a footnote, the right to redistribute or display the data in your own product, and support with an SLA attached. If none of those apply to you, the public sources will serve.
Is macroeconomic data free?
The underlying statistics usually are, because governments publish them. What vendors sell is the work around them: harmonising definitions across countries, tracking revisions, mapping thousands of sources into one schema, and granting you rights to redistribute. Business Quant is free to use for its own US indicator set.
How many economic indicators do I actually need?
Far fewer than any vendor will sell you. A macro dashboard is usually built on 20 to 40 series, and a country model on a few hundred. Coverage counts in the millions describe a catalogue, not a working set, so weigh how easily you can find the right series over how many exist.
Can I redistribute economic data in my product?
Not by default on most commercial licences. Internal use and display or redistribution are priced separately almost everywhere, and this is the single most common surprise at renewal. Settle it before you build, because retrofitting a licence is harder than choosing a vendor.