8 Best Company KPI Data Sources for 2027
Revenue tells you how big a company is. Which of these 8 sources shows you the deliveries, subscribers and stores behind it, and for how many years?


Company KPIs are the operating figures a company reports alongside its financial statements, such as vehicles delivered, paid subscribers, store counts and transaction volume. KPI data sources collect them from earnings releases and filings into series you can look up company by company, usually next to revenue split by segment and region.
Below are 8 sources of company KPI data, from the free primary source to institutional datasets. We compare them on segment revenue, KPI history, price, export, API access and MCP servers.
Why KPIs are harder to collect than revenue
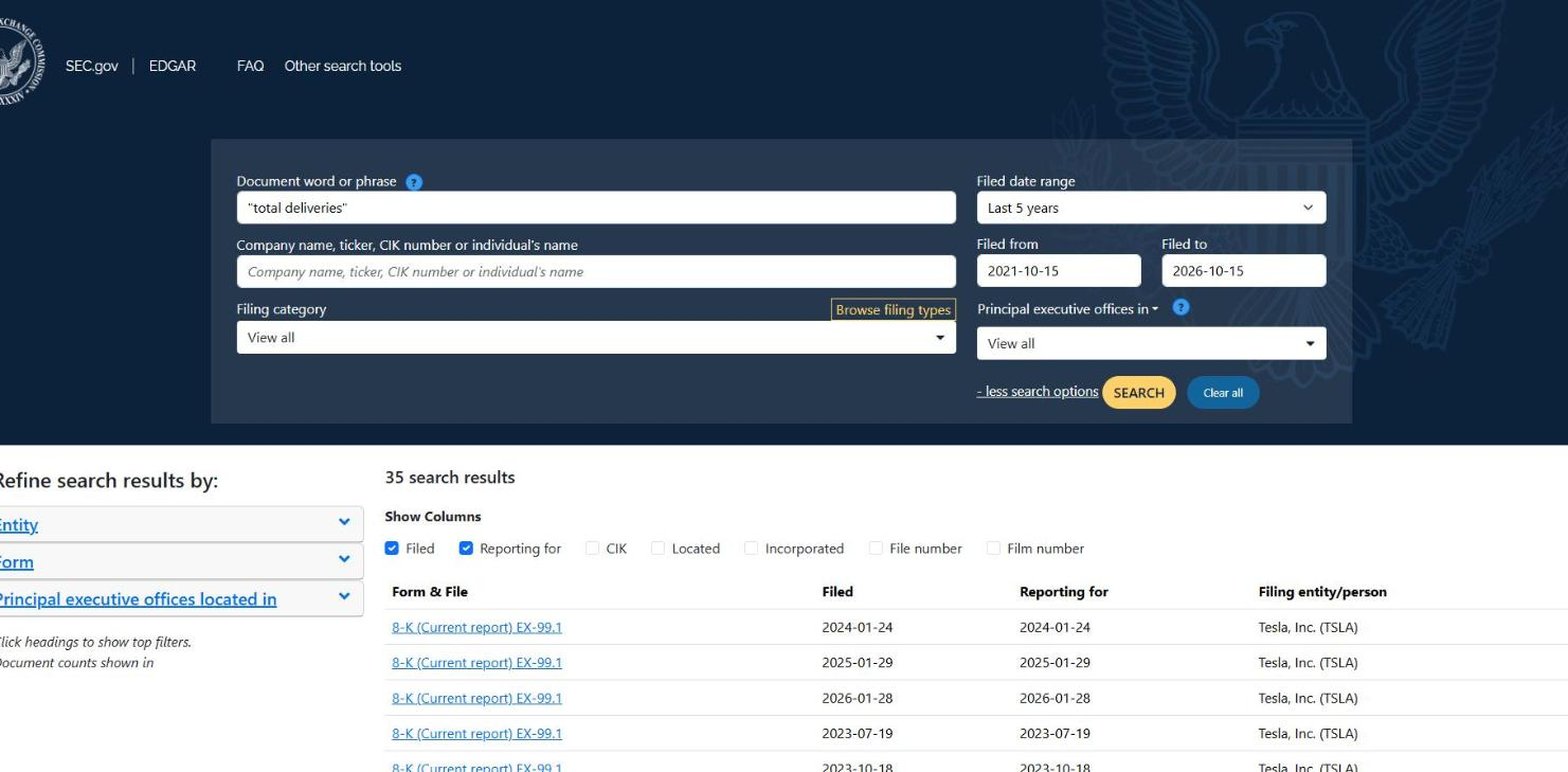
A company's income statement follows an accounting standard; its operating metrics do not. Management chooses them, and most first appear in a press release or a shareholder letter rather than in a table of the 10-K. Search Tesla's filings on SEC EDGAR for the phrase "total deliveries" over the last 5 years and 35 documents come back, nearly all of them the press-release exhibit attached to an 8-K.
Metrics also start, stop and change. Tesla's cumulative paid robotaxi miles have a history that begins in 2025, so no source has more than a few quarters of it, and a company that redefines a metric breaks the series unless someone notes the change. A KPI source reads those releases every quarter, keeps the definitions straight and lines the figures up into a series you can chart.
Segment revenue is the other half. Companies report it in a standard note, and it tells you which part of the business the KPIs are driving. Our introduction to segment financials and KPI data walks through examples from Apple, AT&T and Tesla.
How to choose a KPI data source
- The KPIs themselves. Whether it carries the metric your company actually reports.
- History. How many quarters back each series runs, free and paid.
- Segment revenue alongside. The dollars next to the activity that produced them.
- Export. Whether the series can leave the site, and on which plan.
- Price you can see. A published plan, or a sales call.
- API and MCP access. Whether a program or an AI assistant can pull the data for you.
For the statements behind the KPIs, our financial statements websites guide compares where to read them.
The 8 KPI data sources at a glance
| Platform | Best for | Plans from |
|---|---|---|
| Daloopa | Source-linked KPIs for Excel models | On request |
| Fiscal.ai | KPIs inside a research terminal | $39/mo |
| LSEG | Global, standardised KPIs for institutions | On request |
| SEC EDGAR | Checking any KPI at the source | $0 |
| Stock Analysis | Long KPI history at a low price | $6.58/mo |
| TipRanks | KPI charts next to analyst ratings | $13.50/mo |
| YCharts | Advisers charting KPIs with other data | On request |
| Business Quant | Company KPIs and segment revenue side by side, with export and API access | $29/mo |
Rows are alphabetical, Business Quant last. "Plans from" is the cheapest paid plan's lowest advertised monthly price on 15 October 2026; "On request" means the vendor publishes no price and asks you to contact sales, and SEC EDGAR has no paid plan.
KPI data sources reviewed
Daloopa
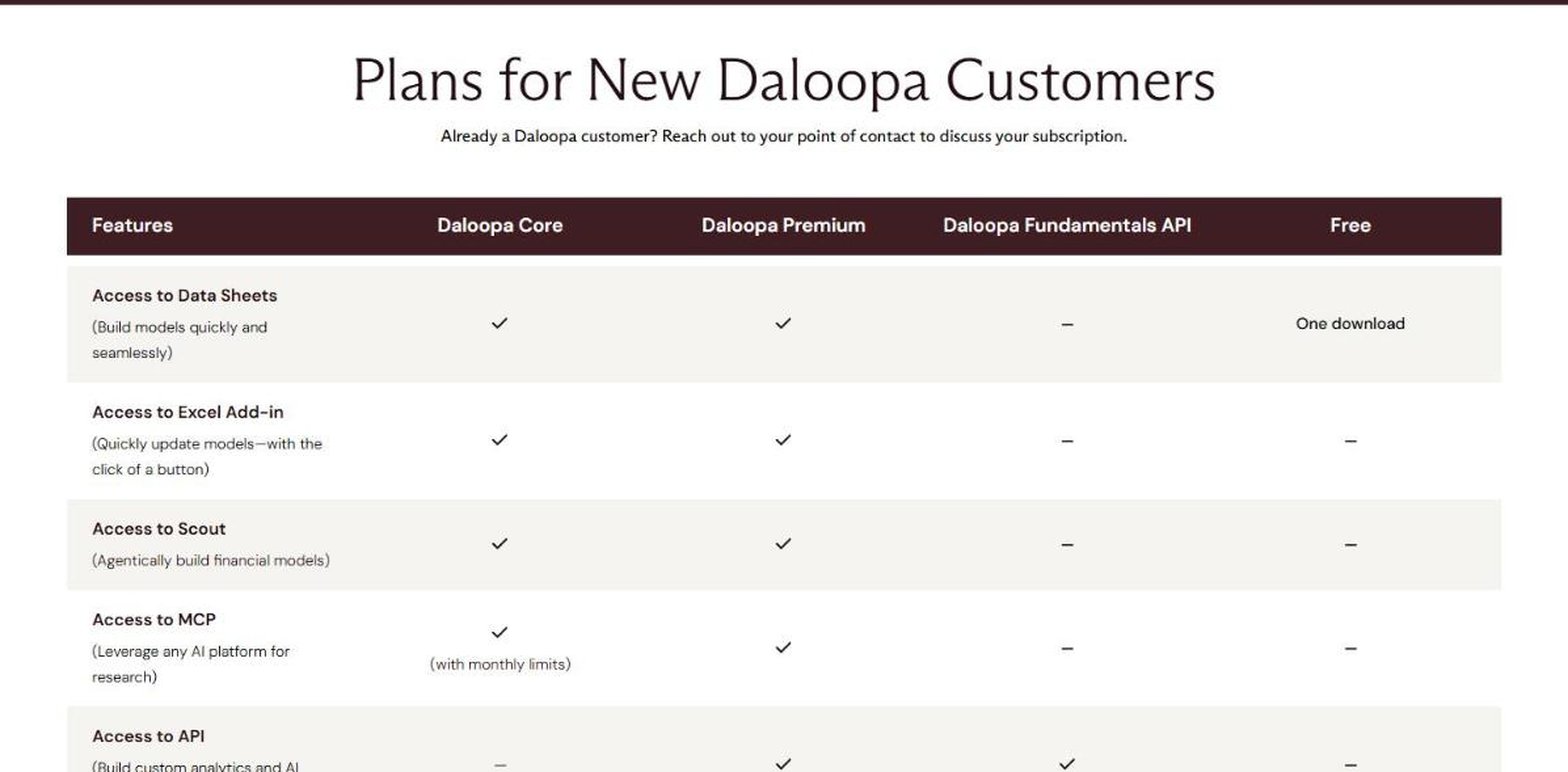
Daloopa is a data service built for analysts who maintain financial models. It extracts figures from company documents and delivers them into spreadsheets, with every number linked back to the page it came from.
- Best for analysts who keep KPIs in Excel models.
- Thousands of KPIs for 6,000+ tickers, with 14 years of history.
- Every data point hyperlinked to its original source.
- Core and Premium, price on request; a free account gets one data sheet download.
- Excel add-in and MCP on Core; API on Premium.
The source link is the point of Daloopa. An analyst updating a model after earnings can click any KPI and land on the line of the release it was taken from, which matters when a company redefines a metric and the series needs a footnote. Industry models aggregate standard figures and KPIs for the main companies in a sector into one downloadable sheet.
Where it falls short: there is no published price, the plans are built around the spreadsheet rather than a web view, and its pages describe KPIs and fundamentals rather than a separate segment revenue view.
Fiscal.ai
Fiscal.ai, formerly FinChat, is a research terminal covering US, Canadian, UK, EU and ADR companies. Company-specific KPIs and segments have their own tab on every covered company.
- Best for KPIs inside a full research terminal.
- Granular KPI data for more than 2,200 companies.
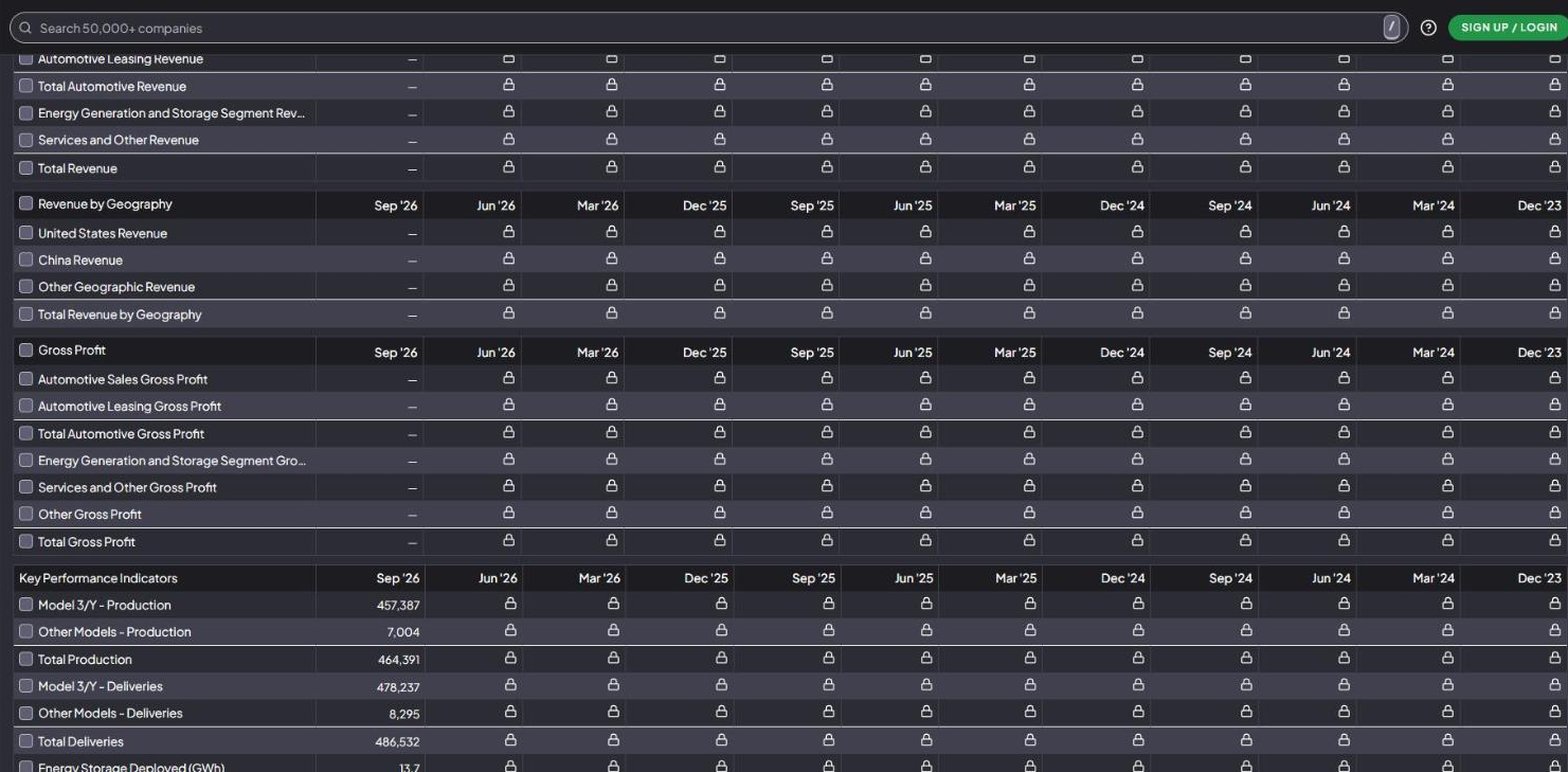
- Pro from $39 a month, with 10 years or 15 quarters of KPIs and a 7-day trial that needs a card.
- Max from $79 a month, with full history and data export.
- US data typically updated 3 to 7 minutes after earnings.
Fiscal.ai's coverage takes in the whole S&P 500, the Nasdaq 100, the TSX 60 and hundreds of large international companies, and the KPI table sits under the same tab as segment revenue, geography and segment gross profit.
Where it falls short: earlier quarters are padlocked without a plan, the full KPI record is on Max rather than Pro, and exporting financial data is a Max feature too.
LSEG
LSEG is the London Stock Exchange Group's data business. Its operating metrics dataset is sold to institutions as part of its company fundamentals, delivered into whatever system the buyer already runs.
- Best for institutions that need global, standardised KPIs.
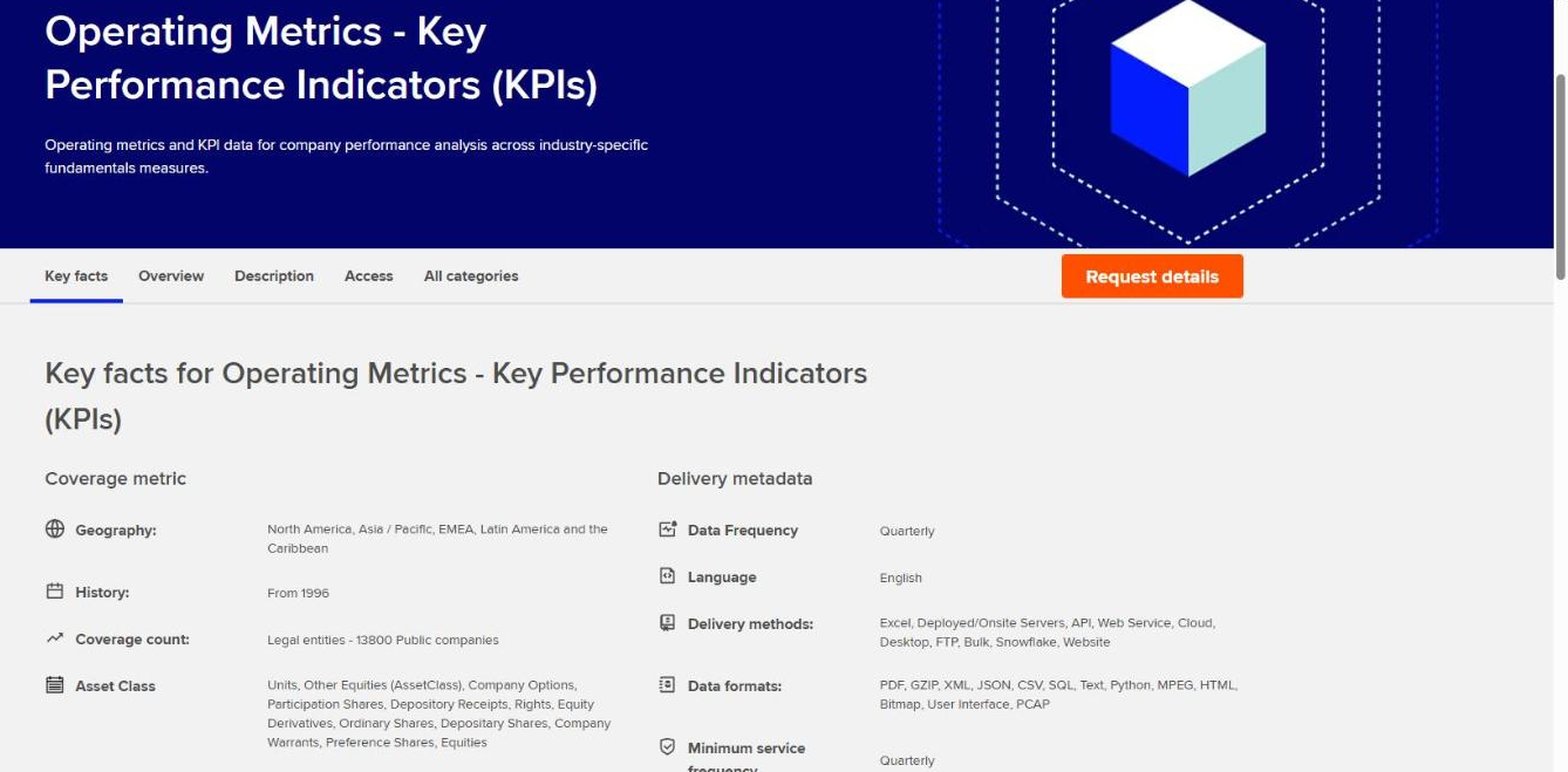
- 13,800 public companies, with history from 1996, updated quarterly.
- 700+ measure types in 22 industry categories.
- Reported and standardised versions of each metric.
- Delivered by Excel, API, cloud, Snowflake and bulk files.
- MCP server that brings LSEG data into AI assistants for existing customers.
LSEG keeps 2 layers: a reported layer that preserves what each company disclosed, and a standardised layer that converts similar metrics into common units so companies can be compared on one basis. It also ties the operating drivers to the statements and segment performance.
Where it falls short: it is sold the way institutional data is sold, through a conversation about packages, with no list price and delivery into a data platform rather than a web page an individual opens.
SEC EDGAR
SEC EDGAR is the Securities and Exchange Commission's filing system, and the place every other source on this list ultimately reads from. Every 10-K, 10-Q and 8-K a US-listed company files is there, including the earnings releases where most KPIs first appear.
- Best for checking any KPI at the source.
- No cost and no account.
- Full-text search of filings since 2001.
- Segment notes in every 10-K and 10-Q, and earnings releases as 8-K exhibit 99.1.
For a single number, EDGAR is the place to check: search the phrase, open the release, and read the figure in the company's own words with its own definition. Full-text search with a company filter finds a KPI across every release that mentions it.
Where it falls short: a KPI in a press release is text and tables in a document, so building 10 years of quarterly deliveries means opening 40 releases and copying 40 numbers, then watching for the quarter where the company changed the definition. There is no KPI series to download.
Stock Analysis
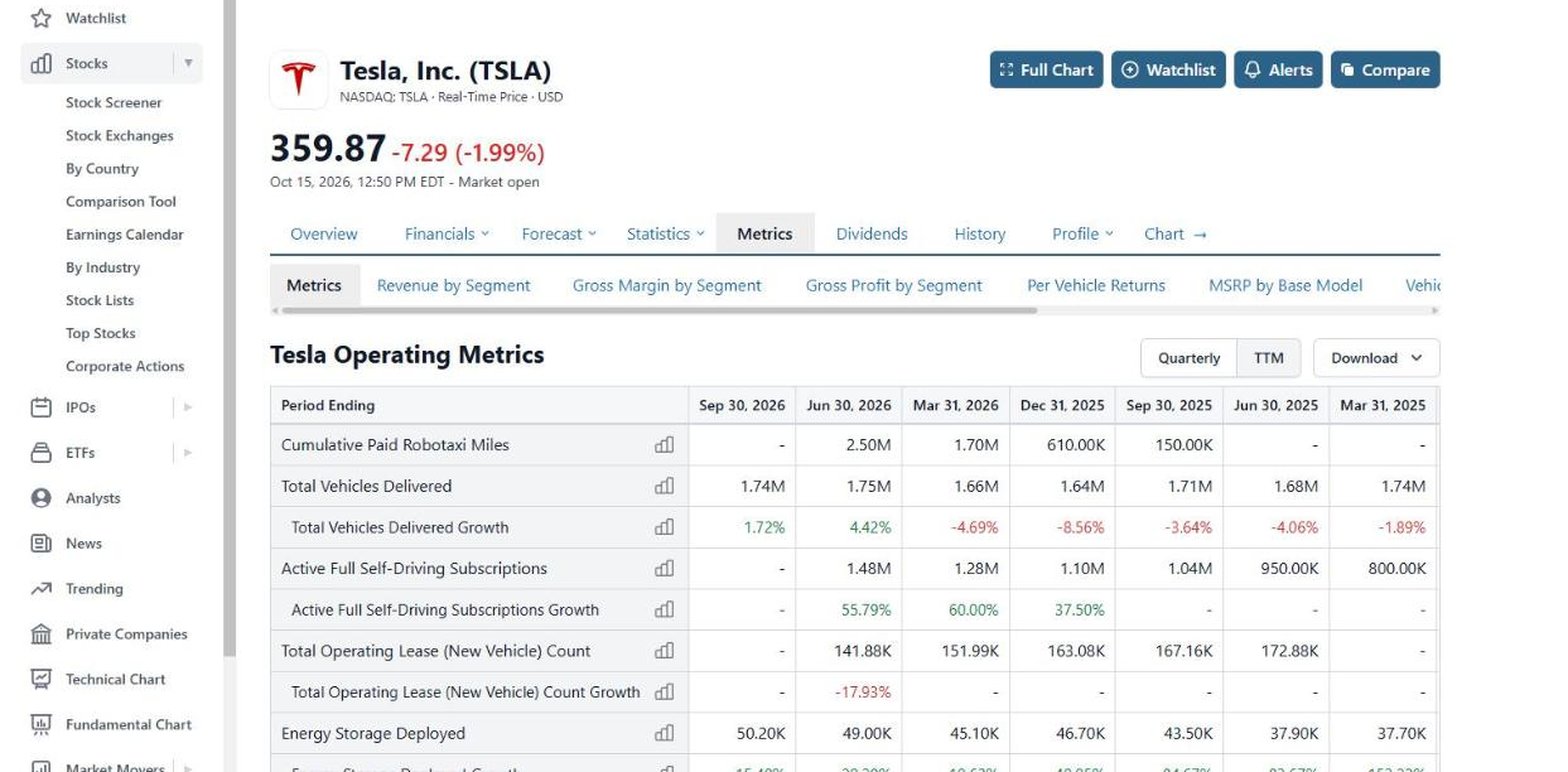
Stock Analysis is a low-cost stock research site whose Metrics tab carries a company's operating metrics next to its segment and geography revenue, with company-specific breakdowns where the company reports them.
- Best for long KPI history at a low price.
- Metrics tab with operating metrics, segments and geography; the latest 8 periods on a free account.
- Pro from $6.58 a month, with the complete history and downloads to Excel, CSV and Google Sheets.
- 60-day money-back guarantee.
On Tesla, the tab runs to sub-tabs for gross margin by segment, per-vehicle returns, MSRP by base model and vehicles delivered, with columns back to 2012. Pro advertises the complete history of business metrics for 50,000+ stocks.
Where it falls short: a free account marks every cell older than the latest 8 periods for an upgrade, and the site does not publish how many companies have KPI series as opposed to statements, so check the companies you follow before you subscribe. Its help centre says there is no API or MCP server.
TipRanks
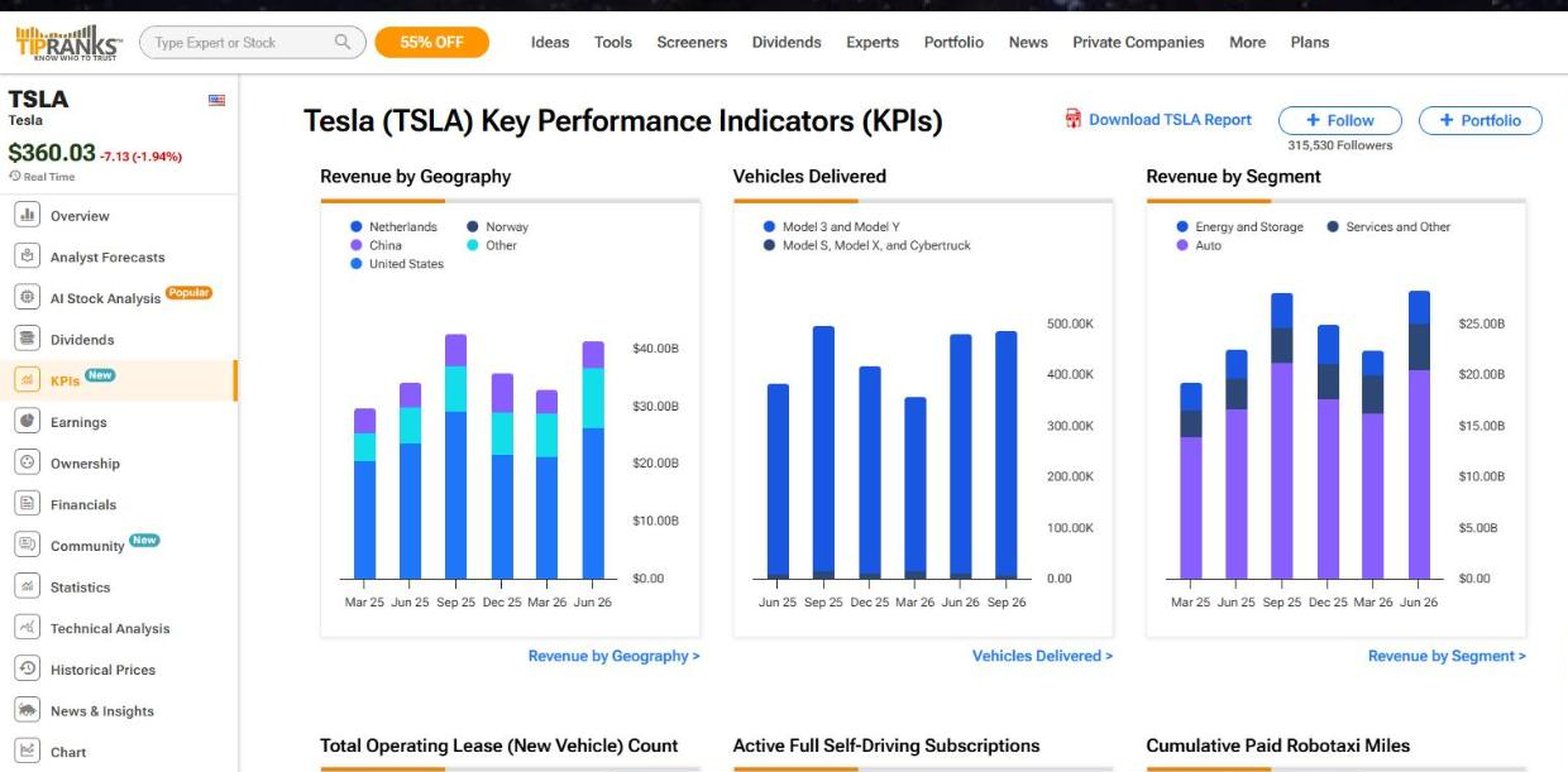
TipRanks is a stock research platform known for ranking analysts and tracking their ratings, and it has added a KPIs tab to its stock pages that shows each metric as a chart.
- Best for KPI charts next to analyst ratings and forecasts.
- KPIs tab on stock pages, with segment and geography charts.
- Premium from $13.50 a month, at a 55% discount on the day; PDF export only.
- Ultimate from $22.50 a month, with CSV export.
- MCP server and API, with a free key to start.
The charts make a company's recent run easy to read at a glance: on Tesla, deliveries, segment revenue, operating leases, self-driving subscriptions and robotaxi miles each get a panel, next to the analyst ratings TipRanks is known for.
Where it falls short: the tab shows 6 quarters per chart, TipRanks does not publish how far back its KPI history runs, and CSV export needs Ultimate rather than Premium. It suits KPIs as context for ratings more than as a dataset to model.
YCharts
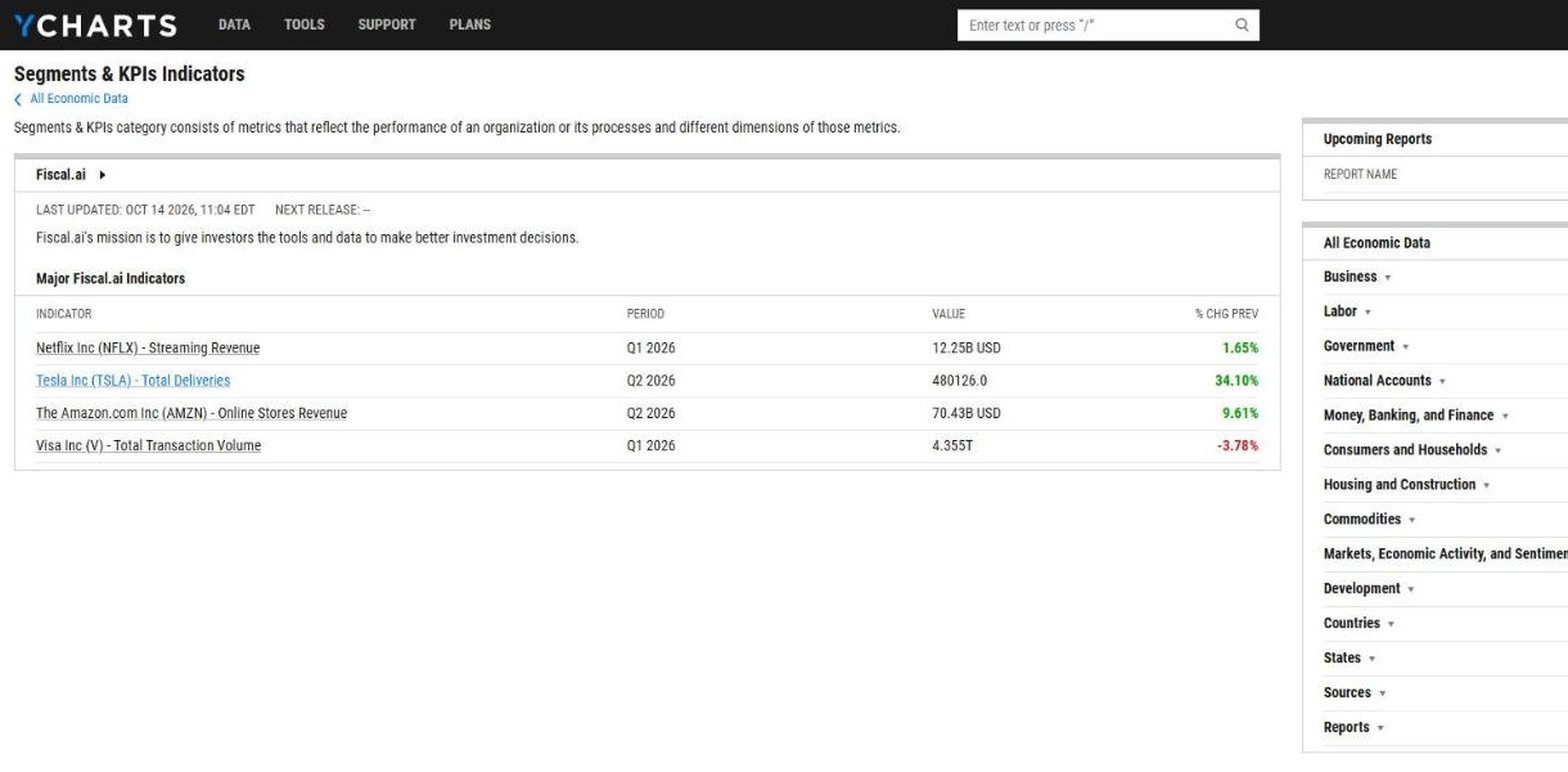
YCharts is a charting and research platform for financial advisers and asset managers, with a Segments & KPIs category among its indicators. The data in that category is supplied by Fiscal.ai.
- Best for advisers who chart KPIs with fund and economic data.
- Segments & KPIs indicators, such as Tesla deliveries and Visa transaction volume.
- 4 plans, from Analyst to Enterprise, priced by phone, with a trial.
- API and MCP server documented for customers.
For an adviser already using YCharts to build client charts, KPI series are one more thing to plot beside fund returns and economic data, without another subscription. The series are the same ones Fiscal.ai collects.
Where it falls short: YCharts publishes neither its prices nor the KPI history it carries, and we found no documented export for the KPI series.
Business Quant
Business Quant is ours. Company KPIs and segment revenue are among our core datasets: each company's operating metrics sit on its own stock page, next to its statements and revenue breakdown.
- Best for company KPIs and segment revenue side by side, with export and API access.
- Free to use, with 4 years of segment data, no card.
- Pro from $29 a month, full history, export and API access.
List of features
- Operating Metrics & KPIs: 20,000+ metrics for about 1,700 companies, up to 40 quarters on Pro
- Bar, line, stacked bar and stacked area charts of each KPI, with chart download
- Non-GAAP measures such as adjusted EBITDA
- Segment financials by segment, product and geography, up to 15 years on Pro
- Financial statements in industry-specific layouts
- Analyst estimates
- Institutional ownership and insider trades
- 18 million+ SEC filings since 1993
- Stock screener with more than 700 metrics
- Economic data
- CSV and XLSX download
- API access
- MCP server
- KPI coverage requests for up to 5 new US-listed companies a month, on Max
The Operating Metrics & KPIs page is the centre of it: pick a company and a category, and the lines the company reports are charted period by period, and both the data and the chart can be downloaded. The metrics are the ones management uses, such as Tesla's vehicle deliveries by model, Starbucks store openings and AT&T's churn rate and mobile subscribers.
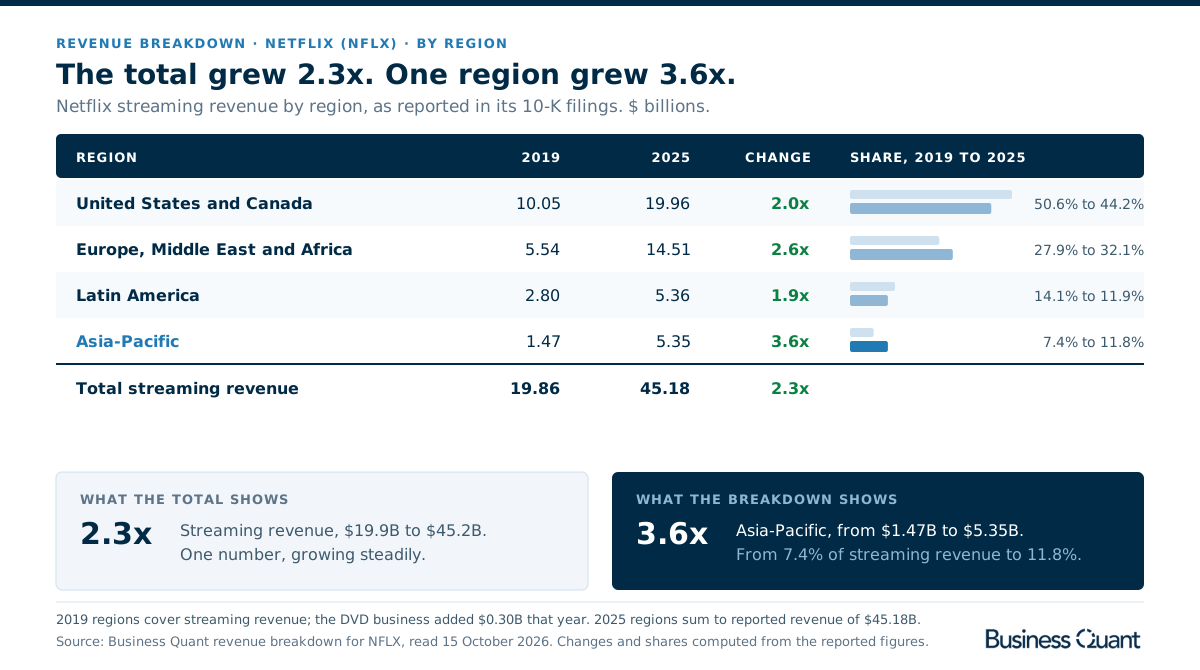
Segment revenue lives on each company's revenue breakdown tab, split by business, product and geography, and the figure above shows why it belongs next to the KPIs. Netflix's streaming revenue grew 2.3 times between 2019 and 2025, but the breakdown shows Asia-Pacific growing 3.6 times, from 7.4% of streaming revenue to 11.8%, while Latin America's share fell. The 4 regions sum exactly to Netflix's $45.18 billion of reported 2025 revenue.
KPI data sources feature by feature
| Platform | Segment revenue |
10 years of KPIs |
Published price |
Spreadsheet export |
API access |
MCP server |
Plans from |
|---|---|---|---|---|---|---|---|
| Business Quant | ✓ | ✓ | ✓ | ✓ | ✓ | ✓ | $29/mo |
| Fiscal.ai | ✓ | ✓ | ✓ | ✗ | ✓ | ✓ | $39/mo |
| LSEG | ✓ | ✓ | ✗ | ✓ | ✓ | ✓ | On request |
| Daloopa | ✗ | ✓ | ✗ | ✓ | ✓ | ✓ | On request |
| SEC EDGAR | ✓ | ✓ | ✓ | ✗ | ✓ | ✗ | $0 |
| Stock Analysis | ✓ | ✓ | ✓ | ✓ | ✗ | ✗ | $6.58/mo |
| TipRanks | ✓ | ✗ | ✓ | ✗ | ✓ | ✓ | $13.50/mo |
| YCharts | ✓ | ✗ | ✗ | ✗ | ✓ | ✓ | On request |
Sorted by ticks, ties broken alphabetically. A tick means the platform's own pricing, plan, help, product or company pages document the feature, or its company pages showed it when we tested them; a cross means we found no such documentation. "Segment revenue" means revenue by segment, product or geography beside the KPIs. "10 years of KPIs" means a plan advertises or shows at least 10 years or 40 quarters of KPI history; for SEC EDGAR it counts the earnings releases filed since 2001. "Published price" counts a free source. "Spreadsheet export" means data can be downloaded to a spreadsheet file on the cheapest paid plan; for SEC EDGAR it means a KPI series rather than the filing itself. "API access" and "MCP server" mean the vendor documents a data API and a connector for AI assistants.
Business Quant is the only source here that ticks every column. Fiscal.ai and LSEG come closest with 5 each: Fiscal.ai keeps export for its Max plan, and LSEG sells through a sales conversation with no list price. Daloopa, SEC EDGAR, Stock Analysis and TipRanks follow with 4, each missing something different: Daloopa a segment view and a price, EDGAR a KPI series to download and an MCP server, Stock Analysis an API and an MCP server, and TipRanks long KPI history and export on its cheaper plan. YCharts ticks 3. A cross shows what a product was built for, not how good it is.
What about Koyfin and TIKR?
Both come up when people look for this data and neither made the list. Koyfin is strong on statements and charts, but we found no segment or KPI view documented on its own pages. TIKR carries a segments tab, but no operating KPI dataset is documented.
Which KPI data source is right for you?
- You maintain Excel models and want every number linked to its source: Daloopa.
- You want KPIs inside a full research terminal: Fiscal.ai.
- You run an institutional data desk: LSEG.
- You want to check one figure in the company's own words: SEC EDGAR.
- You want long KPI history at the lowest price: Stock Analysis.
- You want KPI charts beside analyst ratings: TipRanks.
- You chart KPIs for clients with fund data: YCharts.
- You want company KPIs beside segment revenue and statements, with export and an API: Business Quant.
Our stock analysis websites comparison looks at the wider research sites, and the financial statements guides explain the lines a KPI usually drives.
Where I would start tracking KPIs
If you run an institutional data desk, you already know whether you need a global standardised feed. For an investor or analyst following a list of US companies, I would start with Business Quant.
When revenue rises, the question is why. On Business Quant the answer sits in one place: the KPIs management reports are charted for about 1,700 companies with up to 40 quarters of history, and the revenue breakdown beside them shows which segment and which region the growth came from, as Netflix's Asia-Pacific numbers do above. Segment revenue for the latest 4 years costs nothing. The KPIs and the full history are paid features, and Pro, with export and API access, is from $29 a month. If a company you follow is missing, Max lets you request 5 new companies a month.
A 10-minute test you can run anywhere: pick one company you own and one KPI it reports every quarter. Find the latest figure in the company's own earnings release, then check it on each source you are considering, and count how many quarters back each one goes. The match tells you whether the source reads the filings carefully; the count tells you what the subscription is really selling.
How this comparison was made
To make the list, a source had to provide company-specific operating KPIs, such as deliveries, subscribers, store counts or transaction volume, for US-listed public companies as data you can look up company by company, confirmed on the vendor's own pages. Segment revenue alone was not enough, and a price on request did not rule a source out. 8 sources met that bar.
Every price, plan limit, coverage figure and history figure was read on the vendor's own pricing, plan, help, product or company pages on 15 October 2026 and screenshotted there; API and MCP documentation was checked on the vendors' own pages on 16 October 2026. Prices are each platform's lowest advertised monthly price in US dollars on that date. The figures in our illustration were read from our revenue breakdown the same day and checked against Netflix's reported revenue.
The list, the summary table and the reviews run alphabetically, with Business Quant last, and the feature table is sorted by the number of ticks, with ties broken alphabetically. We make Business Quant, one of the 8 products compared here.
Image credits. Header photograph by Olga Subach on Unsplash, used under the Unsplash License. Vendor screenshots were captured on 15 October 2026 from each provider's own pricing, plan, data catalogue or company pages and are reproduced for comparison. The Netflix illustration is our own, built from our revenue breakdown data.
Frequently asked questions
Where can I find KPI data for public companies?
The original source is the company itself: KPIs such as deliveries, subscribers or store counts are reported in quarterly earnings releases, shareholder letters and the MD&A section of 10-K and 10-Q filings, all on SEC EDGAR. Data platforms collect those figures into time series. Business Quant carries company KPIs for about 1,700 companies, Fiscal.ai for more than 2,200, Daloopa for 6,000+ tickers and LSEG for 13,800 public companies, while Stock Analysis, TipRanks and YCharts show KPIs on their company pages.
Is there a free source of company KPI data?
Yes, with limits. SEC EDGAR is free and holds every reported figure, but you assemble the series yourself. Stock Analysis shows the latest 8 periods of a company's operating metrics on a free account, and Fiscal.ai shows the latest quarter of its Segments & KPIs tab without an account. Business Quant is free to use, with revenue by segment, product and geography for the latest 4 fiscal years; its company KPIs, with up to 40 quarters of history, are on Pro from $29 a month.
What is the difference between KPI data and segment data?
Segment data splits a financial line, usually revenue or operating income, by business, product or region, and it comes from the segment note a US company must include in its 10-K and 10-Q. KPI data is the operating activity behind those dollars: vehicles delivered, paid memberships, stores opened, transaction volume. KPIs are chosen by each company, so they differ from company to company and can change over time.
Do companies have to report KPIs?
Not a fixed list. US rules require segment reporting, but which operating metrics a company publishes is its own choice. The SEC's 2020 guidance on key performance indicators in MD&A asks a company that uses a metric to define it clearly and explain how it is calculated, and to say so when it changes the definition. That is why a KPI series can start, stop or be redefined from one year to the next.
How far back does company KPI data go?
It depends on the source and the plan. LSEG's KPI dataset starts in 1996 and Daloopa advertises 14 years of history. Business Quant Pro carries up to 40 quarters of KPIs and up to 15 years of segment data. Fiscal.ai Pro includes 10 years or 15 quarters of KPIs, with full history on Max, and Stock Analysis lists Tesla's operating metrics back to 2012, with the older years on Pro.
Can I download company KPI data to Excel?
On most paid plans. Business Quant Pro exports data in CSV and XLSX. Stock Analysis Pro allows downloads to Excel, CSV and Google Sheets, Daloopa delivers data sheets in Excel with an add-in, and LSEG delivers its dataset by Excel, API and cloud. Fiscal.ai keeps financial data export for its Max plan, and TipRanks puts CSV export on Ultimate.