9 Best Free Economic Data APIs
Every one of these costs nothing. What separates them is the ceiling: the key you need, the calls you get, and the series that quietly are not there.

Macro data is unusual in financial data: the best sources are public institutions that publish their own statistics at no charge, and they are not crippled samples designed to sell you an upgrade. A central bank research department publishes its series because that is the job.
So the interesting question is not cost. It is where each option stops, and they stop in different places. Here is what actually separates them.
- The key requirement. Some want registration, some want nothing. It sounds trivial until you are shipping a client-side tool or a notebook someone else will run.
- The published ceiling. These range from 120 requests a minute down to 30 calls a day, so the ceiling decides what a free key can actually run.
- What the response leaves you to do. Some return a raw observation array and nothing else. Others carry units, frequency, direction and the next release date, which is the difference between plotting a series and describing it.
- Coverage shape. Breadth across 200 countries and depth on one economy are different products, and the second is not a worse version of the first.
Every source below is free to use and has a documented public API returning macro time series. Platforms whose macro data sits behind a paid tier are covered separately in the comparison of commercial macro providers.
What free actually costs you
The bill is not the only price. Three things are worth checking before you commit to any source on this page, and none of them appear on a pricing page because there is no pricing page.
Licensing is not uniform. US federal statistical output is generally not subject to copyright, which is why FRED and the BLS are so widely embedded. That is a statement about US government work, not about open data in general. An aggregator that mirrors a European or commercial series is passing along someone else's terms, and those terms travel with the data.
Nobody owes you an SLA. A free public API can change its response shape, deprecate an endpoint or go down during a government shutdown, and you have no contractual recourse. That is a fair trade at zero cost, but it should shape how you cache.
Metadata is where free sources differ most. Getting the numbers is easy. Knowing that a series is seasonally adjusted, quoted in millions of dollars at an annual rate, published monthly, and due to update next Tuesday is what makes it usable without a human in the loop. Several entries below hand you observations and nothing else.
The part nobody warns you about: finding the series
With commercial vendors you pay for a search interface. With free sources you get an identifier scheme, and getting from "I want average hourly earnings" to the string that returns it is most of the work on day 1.
The schemes differ enough to be worth knowing in advance.
- Mnemonics. FRED uses short human-ish codes like
UNRATEandCPIAUCSL. Readable once you know them, and unguessable before that, because the naming has accreted over decades rather than being designed. - Structured codes. The BLS builds identifiers out of positional segments encoding survey, area, industry and data type. Once you understand the grammar you can construct a series ID without searching, which is genuinely powerful. Until then it is opaque.
- Dimensional addressing. The IMF and DBnomics address a series as a set of dimensions: provider, dataset, country, indicator, frequency. Precise and consistent, and it means discovery is a separate query from retrieval.
- Plain codes with aliases. Business Quant uses readable codes like
E:USWAGEand attaches search aliases, so wages, hourly pay and AHE all resolve to the same series.
This matters more than it used to, because a lot of macro pulling now happens inside an agent rather than a notebook. If a model has to guess a mnemonic, it will guess wrong and return a plausible series that is not the one you asked for. Whichever source you choose, resolve the codes you need once, then hold them somewhere stable.
The 9 sources compared
- FRED
- World Bank Indicators
- IMF Data
- Bureau of Labor Statistics
- Bureau of Economic Analysis
- Eurostat
- DBnomics
- EconDB
- Business Quant
| Source | Key needed | Published ceiling | Coverage | Release calendar |
|---|---|---|---|---|
| FRED | Yes, free | 120 req/min | US plus international | Release dates only |
| World Bank | No | Not published | ~200 economies | No |
| IMF Data | No | Not published | Global, by dataset | No |
| BLS | Yes for v2 | 500 queries/day | US labour and prices | Schedule published separately |
| BEA | Yes, free | Not published | US national accounts | No |
| Eurostat | No | Not published | European Union | No |
| DBnomics | No | Not published | Aggregated, very broad | No |
| EconDB | For some endpoints | Not published | Global plus logistics | No |
| Business Quant | Yes, free | 30 calls/day | 177 US indicators | On every indicator |
Scroll the table sideways to see every column.
Source by source
FRED
The Federal Reserve Bank of St. Louis runs the database that most macro work quietly depends on. It aggregates series from federal statistical agencies, central banks and research institutions into one place with one access pattern, and it has been doing so long enough that a large share of published macro charts trace back to it.
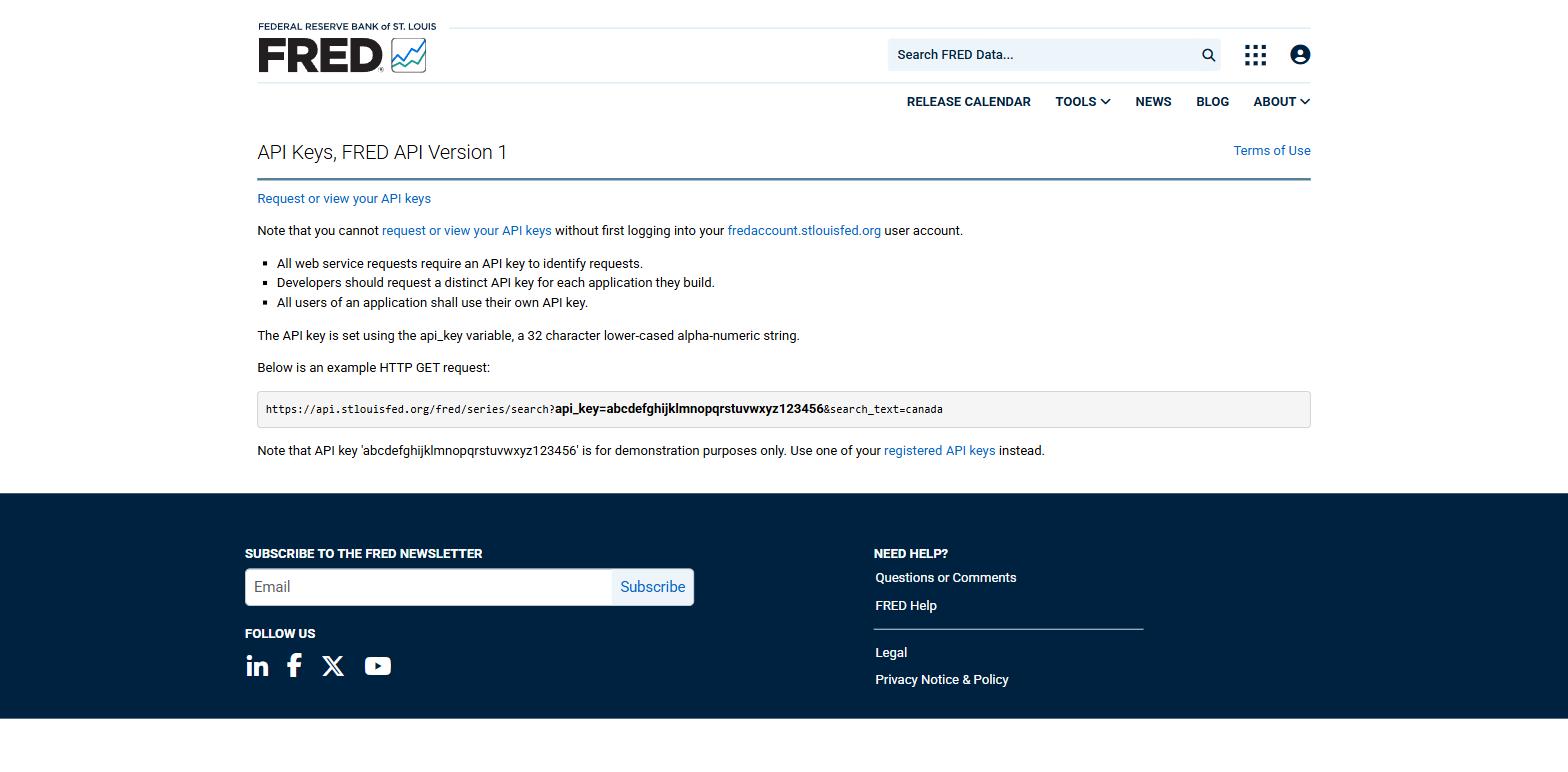
- An API key is required, raising the ceiling from 30 requests a minute to 120.
- There is one tier. No paid plans, no enterprise SKU.
- Exceeding the limit returns HTTP 429, so back off rather than retry blindly.
- ALFRED is the companion archive, and it is the reason serious researchers use FRED: it stores vintages, so you can ask what a series looked like before it was revised.
Where it stops is scheduling and shape. FRED publishes release information, but working out when a specific series next updates means joining series to releases to release dates yourself. If your application needs to say "GDP prints in 4 days", you are building that.
World Bank Indicators
The World Bank's Indicators API is the cross-country workhorse. It carries the World Development Indicators and related collections across roughly 200 economies, and it is the natural source when your question is comparative rather than deep: how does this country's labour force participation compare to its neighbours over 20 years.
- No API key at all. You can call it from a browser, a notebook or a static site without registering anything.
- JSON or XML, with a straightforward path structure for country and indicator codes.
- No published rate limit, which is convenient and also means you should be considerate rather than assume you can hammer it.
Where it stops is frequency. Development indicators are largely annual, occasionally quarterly. This is the right source for structural comparison and the wrong one for anything tracking a business cycle month to month.
IMF Data
The IMF publishes several of the datasets that underpin international macro: International Financial Statistics, Balance of Payments, Government Finance Statistics and Direction of Trade. If you need a country's external position or fiscal accounts on a consistent international definition, this is the primary source rather than a mirror of one.
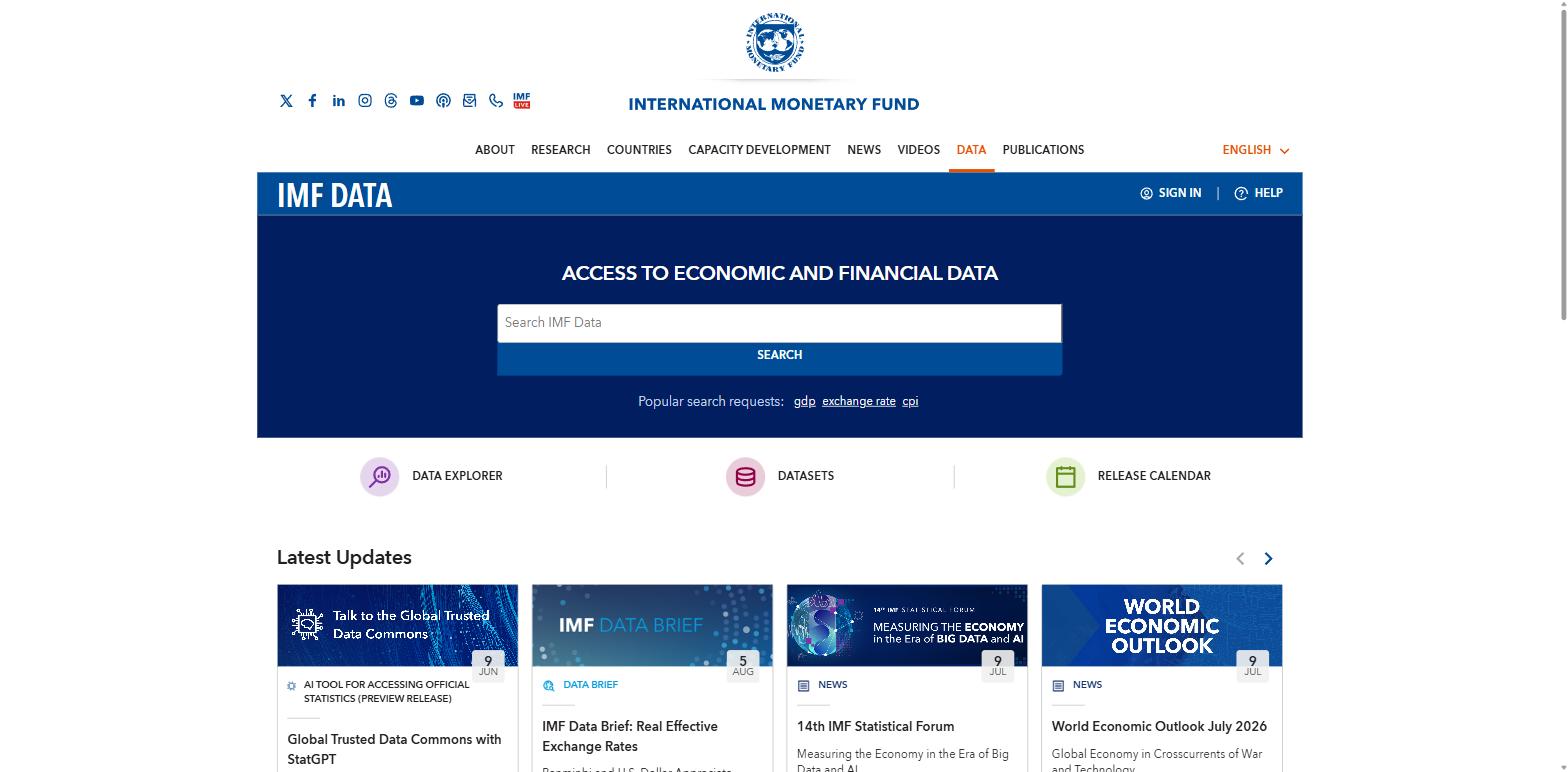
- No API key required.
- Organised by dataset rather than as one flat catalogue, so you query IFS or BOP specifically.
- Definitions are harmonised across countries, which is the entire value and the reason it is worth the query structure.
Where it stops is ergonomics. The dataset-first structure and the dimension codes are a step up in difficulty from a flat series catalogue, and discovery is harder than lookup. Budget an afternoon to find what you need the first time.
Bureau of Labor Statistics
The BLS is where US inflation and employment numbers originate. CPI, the employment situation, average hourly earnings, producer prices and job openings are all published here first, and everything downstream is a copy with a delay.
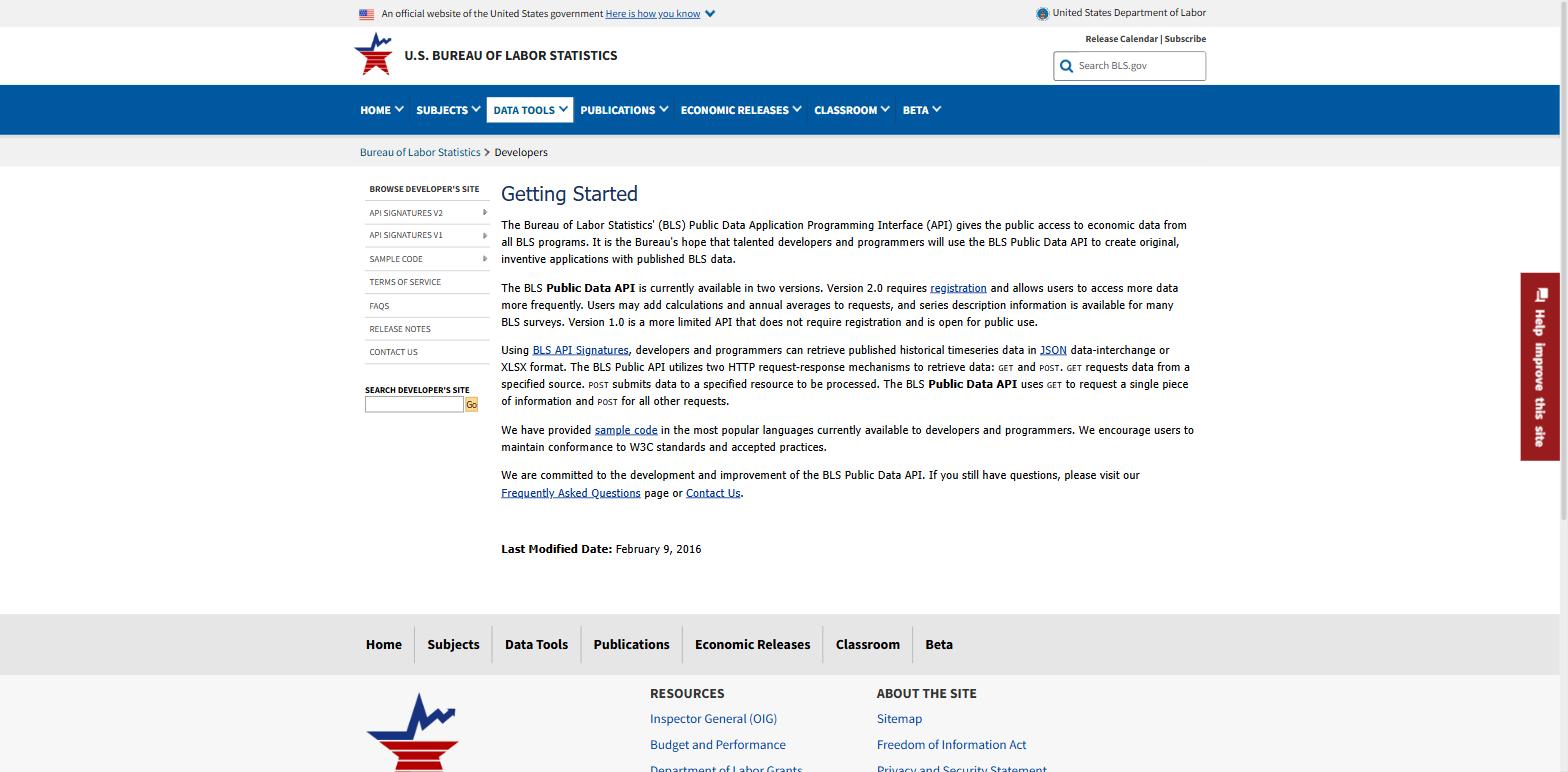
- Version 2 needs a free registration and allows 500 queries a day, up to 50 series per query and 20 years of history per request.
- Version 1 needs no key but drops to 25 series and 10 years, and is best treated as a way to try before registering.
- The release schedule is published, though as a separate calendar rather than as a field on the series.
Where it stops is scope, deliberately. This is US labour and price statistics, not a general macro database, and the series identifiers are structured codes rather than friendly names. Knowing which code you want is most of the work.
Bureau of Economic Analysis
If FRED is where most people read US macro, the BEA is where a large part of it is produced. GDP comes from here before it appears anywhere else.
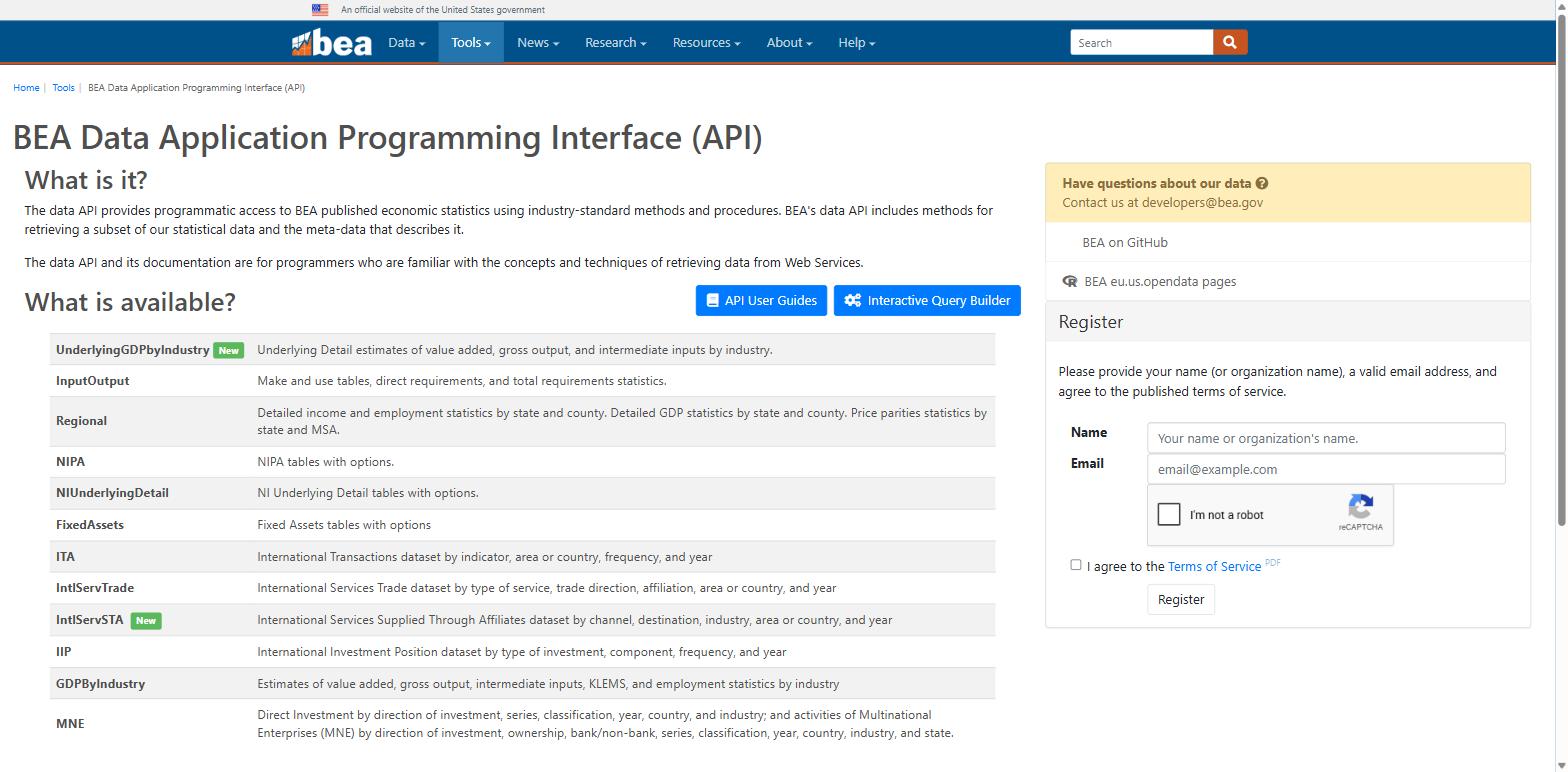
- The national accounts at source. NIPA tables, GDP by industry, and the input-output tables, which is the underlying detail rather than a headline series.
- Regional data covering income, employment and GDP down to state and county level, which is hard to assemble from anywhere else at no cost.
- International accounts across trade and investment, direct investment and multinational enterprise statistics.
- Fixed assets tables, for capital stock and depreciation work.
- A free key, obtained by registering with your name, organisation and email and accepting the published terms.
No rate limit is published, so treat throughput as undefined and cache accordingly. The reason to come here rather than pull the same aggregate from an aggregator is the table structure: BEA gives you the full cross-tabulated detail underneath a headline number, which is what you need when the question is which component moved rather than whether the total did.
Eurostat
The European Union's statistical office, and the counterpart to the BEA if your work crosses the Atlantic.
- Harmonised statistics across member states, which is the real value here.
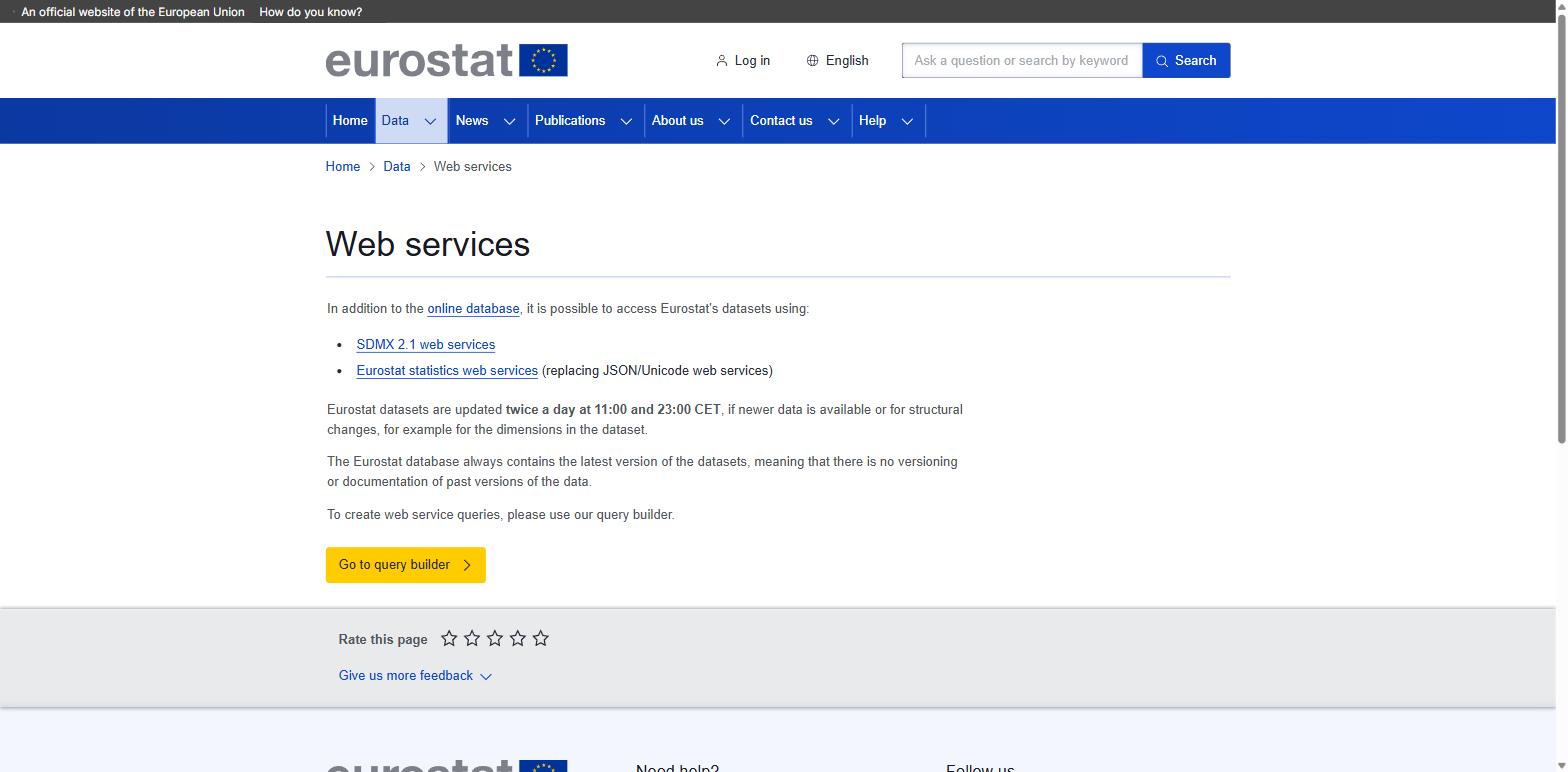
- SDMX 2.1 web services alongside a JSON service, so you can work in whichever shape suits your pipeline.
- Updated twice daily, at 11:00 and 23:00 CET.
- A query builder for constructing requests before you write code, which softens the discovery problem described earlier.
Key requirements and rate limits are not stated on the web services page, so confirm both before you build anything that depends on sustained throughput. For euro-area inflation, unemployment and national accounts on a consistent basis, this is the primary source rather than a mirror of one.
DBnomics
DBnomics solves a different problem: it puts one API in front of dozens of publishers, including the ECB, Eurostat, the IMF, the OECD, the World Bank and many national statistical offices. Rather than learning 6 query languages, you learn one and address everything as provider, dataset and series.
- No key, no registration, and an openly documented structure.
- Enormous breadth through aggregation, particularly for European series that are otherwise scattered.
- Provider, dataset and series is a consistent addressing scheme across everything it carries.
Where it stops is the licence question. You are pulling someone else's series through a convenient front door, and the original publisher terms still apply to what you do next. For internal analysis that rarely matters. For anything you redistribute, trace the series back to its source before you ship.
EconDB
EconDB carries global macroeconomic and financial series with a genuinely unusual sideline: shipping indicators and grocery prices, assembled from sources most macro databases do not touch. For anyone working on supply chains or the food component of inflation, that is a real edge.
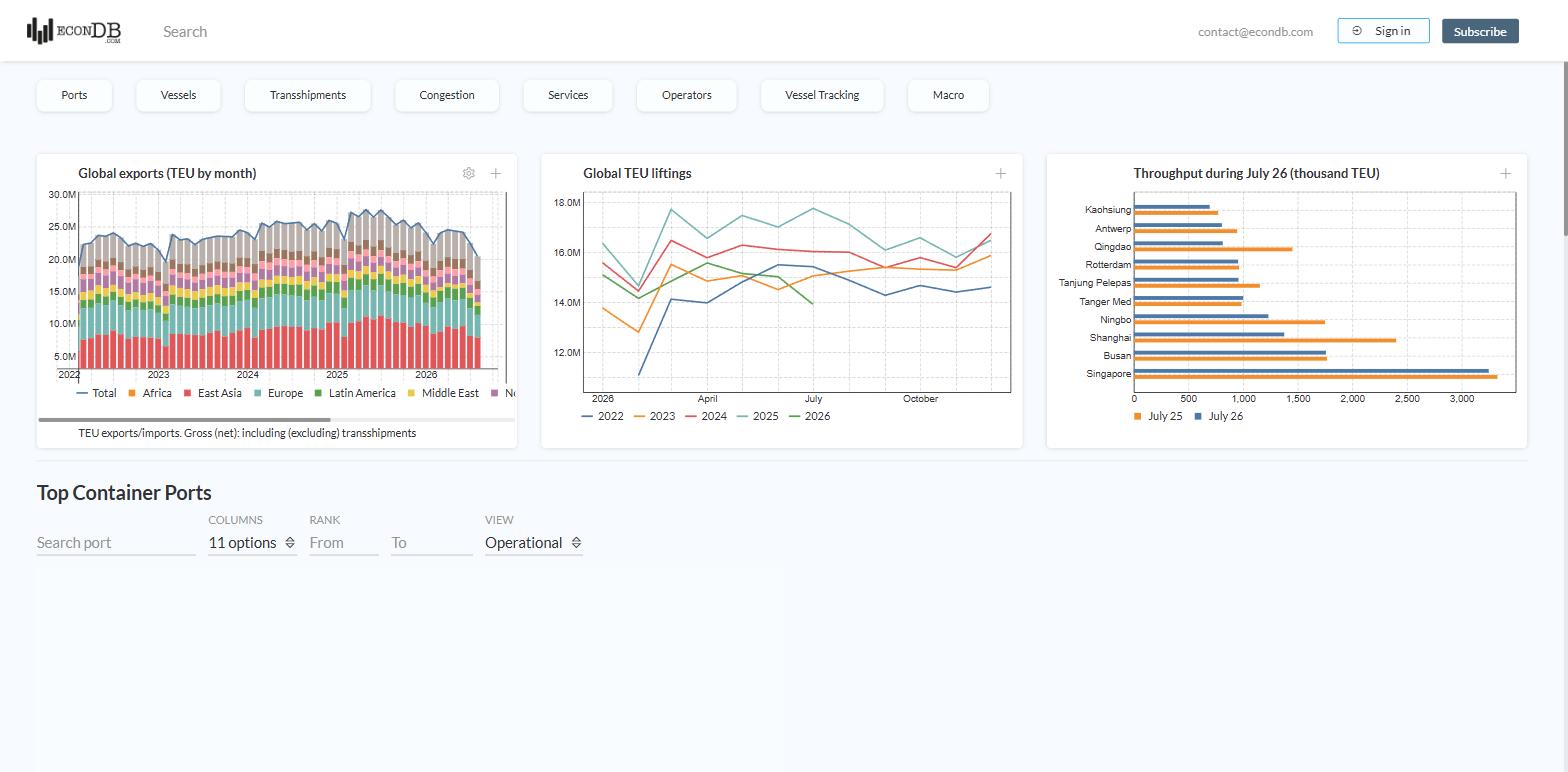
- A free public API covering GDP, CPI, unemployment, rates and exchange rates across many countries.
- Alternative series including shipping and grocery prices, which is the reason to look here rather than at a government source.
- A Python package is published for it, so the common path is one install rather than hand-rolled requests.
Where it stops is transparency about limits. Rate limits and the boundary between the free surface and paid access are not laid out the way the government sources lay theirs out, so confirm before you build a dependency on it.
Business Quant
Our own API takes the opposite approach to breadth. Rather than mirroring everything, it carries 177 US indicators across 13 categories: Business, Consumer, Credit, Cycle, Fiscal, Growth, Housing, Inflation, Labor, Markets, Money, Rates and Trade. The bet is that most people needing US macro need a curated set described properly, not a search problem over hundreds of thousands of series.
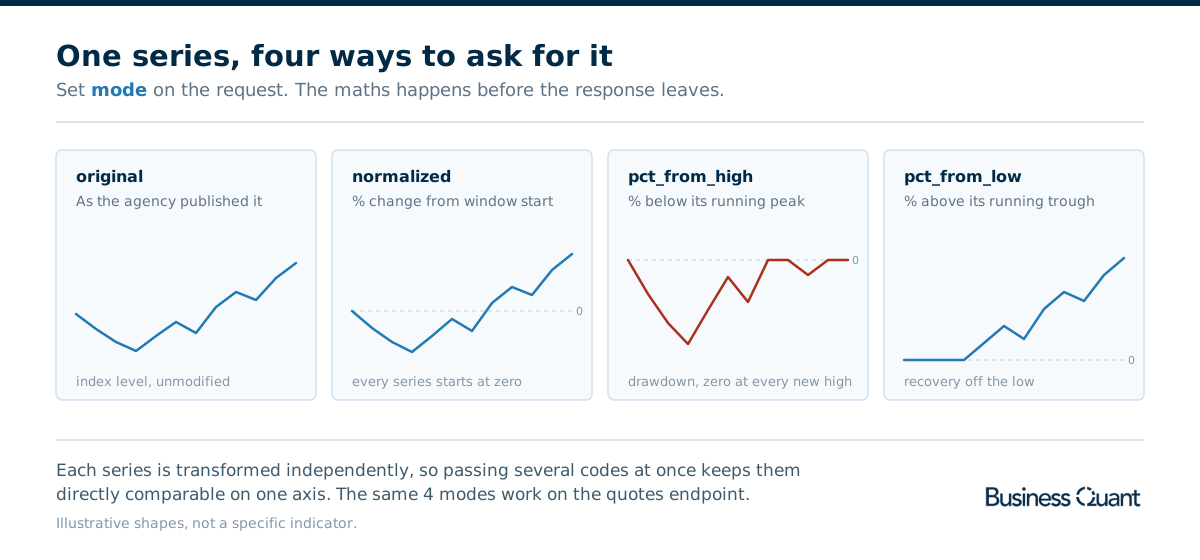
- 4 transformation modes computed for you: raw, rebased, drawdown and recovery.
- Every indicator carries its next release date, with days remaining and a state.
- Search aliases on every series, so wages finds Average Hourly Earnings.
- Descriptive metadata: category, frequency, seasonal adjustment, display unit, decimal precision, a direction flag for whether higher is better, and related series.
- 30 API calls a day on the free key, 75 a minute on Pro and up to 900 a minute on Enterprise, and
period=maxreturns an entire history in one response rather than paginating. - The same 4 modes work on the quotes endpoint, so overlaying a macro series on an equity price is one API rather than 2 and a join.
The indicator list, the transformation modes and the calendar are documented in the Economic Indicators List API, the Economic Data API and the Economic Calendar API.
Where it stops is the map. This is 177 US indicators. It is not 800,000 series, it is not 196 countries, and if your work is cross-country comparison then the World Bank or DBnomics is the better tool and this is not close.
What you can pull from the Business Quant API
| What you want | How you get it |
|---|---|
| The full indicator catalogue | GET /economic/list, unpaginated |
| Several series on one comparable axis | mode=normalized with multiple codes |
| How far a series is off its peak | mode=pct_from_high |
| Entire history in one response | period=max |
| What prints next, and when | GET /calendar/economic |
| To resolve a human phrase to a code | The aliases on each indicator |
| Macro overlaid on an equity chart | The same 4 modes on the quotes endpoint |
| A full catalogue pull | A paid plan: 75 calls a minute on Pro, up to 900 on Enterprise |
If I were choosing today
If your work is US macro and you want the series described well enough to use without a lookup table beside you, start with Business Quant, and start today.
The argument is narrow and checkable. You get 177 indicators chosen because people actually use them, each carrying its unit, frequency, seasonal adjustment and next release date. You get 4 transformations computed before the response leaves, so comparing 3 series does not mean writing the rebasing yourself. You get aliases, so a question phrased in English resolves to a code. And the key costs nothing and needs no card: 30 calls a day is enough to test all of that, and Pro lifts the ceiling to 75 calls a minute.
Try it on the thing that usually costs an afternoon: pick 3 indicators from different categories, pull them with mode=normalized and period=max, and plot them on one axis. If that takes more than 10 minutes, the API has failed and you have lost an afternoon's worth of nothing.
Then check the calendar endpoint and see what is due this week. That is the piece most free sources leave you to assemble, and it is the reason a dashboard built on this stays useful after you stop watching it.
For the paid side of this market, and the cases where coverage or redistribution rights genuinely justify a licence, see the commercial macro provider comparison. For how macro sits alongside fundamentals in a full stack, the financial statements API comparison covers that ground.
How this comparison was made
One test decided the roster: usable at no cost, with a documented public API returning macroeconomic time series. Platforms whose macro data sits behind a paid tier were sent to the sibling comparison instead. Everything that failed it was left out, however well known.
Prices, limits and coverage figures were read off each vendor's own published material on 13 August 2026, not from other roundups, and screenshots are dated where they appear. Where a vendor does not publish a figure, the table says so rather than carrying an estimate.
Every source here is described from its own published material rather than characterised, and Business Quant appears in roster order rather than at the top. Business Quant, which publishes this page, runs one of the 9 sources compared here, and its plan limits were read from its own pricing page on 3 October 2026.
Image credits. Header photograph by Markus Spiske on Unsplash, used under the Unsplash License. Diagrams are Business Quant originals.
Frequently asked questions
Is there a genuinely free economic data API?
Several, and unusually for this industry they are free in the plain sense rather than as a trial. FRED, the World Bank, the IMF and the BLS are all public institutions publishing their own statistics at no charge. Business Quant is free to use for its 177 US indicators. What varies is the key requirement, the call ceiling and how much work you do after the response arrives.
Can I use free economic data in a commercial product?
Usually yes for the government sources, because US federal statistics are generally not subject to copyright, but read each terms of use rather than assuming. Aggregators are the ones to check carefully: redistributing a series you pulled from an aggregator can be governed by the original publisher terms rather than the aggregator.
Why would I pay when FRED exists?
Most people should not. Pay when you need something FRED does not do: forward release scheduling, non-US coverage at depth, revision history as a first-class dataset, or redistribution rights. Those are covered in the sibling comparison of commercial macro providers.
How current is economic data from these APIs?
As current as the agency that publishes it, which is the real constraint. Monthly indicators land 2 to 6 weeks after the period they describe, and quarterly figures later still. No API changes that, so the useful question is whether a provider tells you when the next print is due.