Top 12 Stock Research Tools Compared
12 tools will show you the same company's financials. How many of them actually own the numbers?

Think about the last research tool you paid for. You compared the screenshots, the screener, the metric count and the monthly price. What you almost certainly did not compare is where any of the numbers came from.
12 platforms here, all sold to people researching public companies in a browser. This compares what each one costs, what the cheapest plan actually unlocks, and whether you can get the data out of the page and into your own work. Business Quant makes one of the 12.
That last question turns out to be the one that separates them, and it is not a technical decision.
Who owns the numbers
You do not have to take anybody's word for who supplies whom, because most of these companies publish it themselves, in a help article or a copyright line at the foot of the page.
Koyfin puts it most directly: it buys its data and holds licence agreements with over a dozen vendors, with global equity fundamentals, consensus estimates and valuation sourced from S&P Capital IQ and fund data from Morningstar. TIKR names the same wholesaler, calling S&P Global Capital IQ the gold standard for financial data and framing the whole product as a way to put that dataset in front of individuals. Simply Wall St carries an S&P Global Market Intelligence copyright notice in its own page footer. Stockopedia's footer credits LSEG, Smart Insider and S&P Global Market Intelligence together.
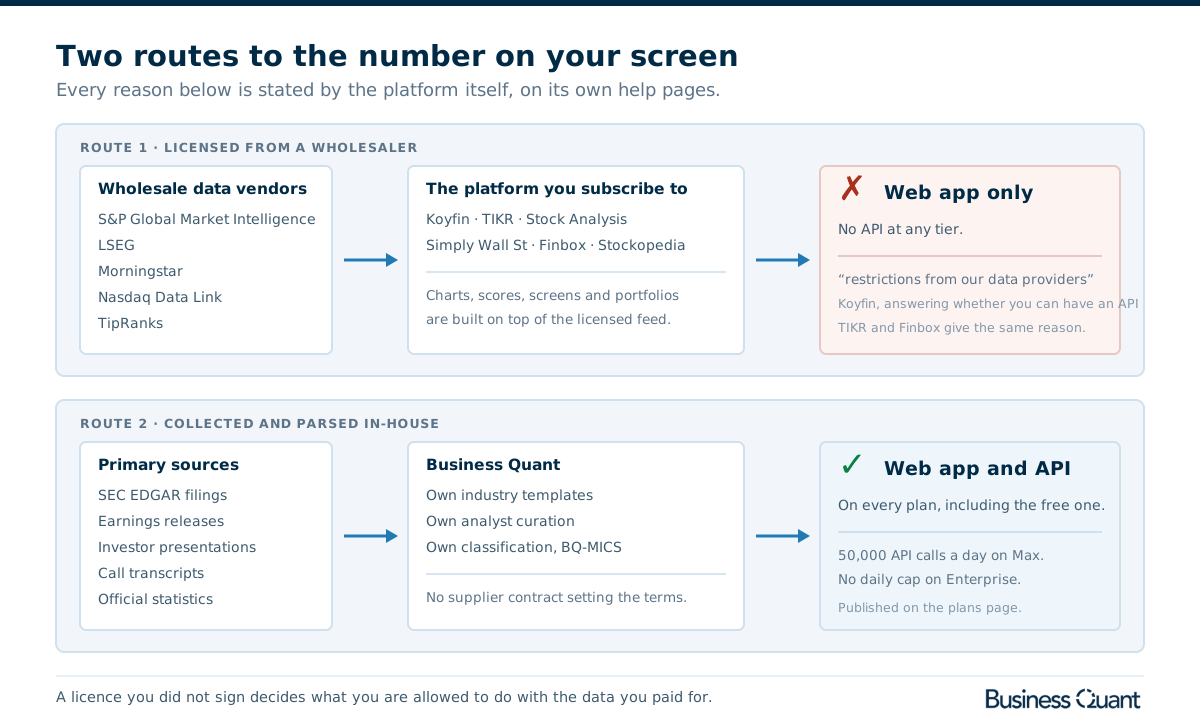
Stock Analysis publishes the most complete breakdown of the lot, and it repays a careful read. Fundamentals come from S&P Global Market Intelligence and from Fiscal.ai. Prices come from CBOE, with Nasdaq UTP behind the delayed consensus figures. ETF holdings come from Finnhub. Corporate actions arrive through Nasdaq Data Link. Transcripts come via Quartr. Individual analyst records come from TipRanks. That is 7 suppliers behind 1 clean interface, and the company is candid enough to name every one.
Nothing has gone wrong here. Licensing a professional feed is a completely rational thing to do: building a filings pipeline is expensive, slow and unglamorous, and a small team that wanted to ship a beautiful research product in 2 years rather than 6 made the correct call. The platforms above are, in the main, very good software. The point is not that buying data is bad. The point is that buying it settles several things you are going to run into later, and none of those things appear on a pricing page.
The licence you never signed
Ask any of these companies for an API and you get an unusually consistent answer, which is the tell that it was never really their decision.
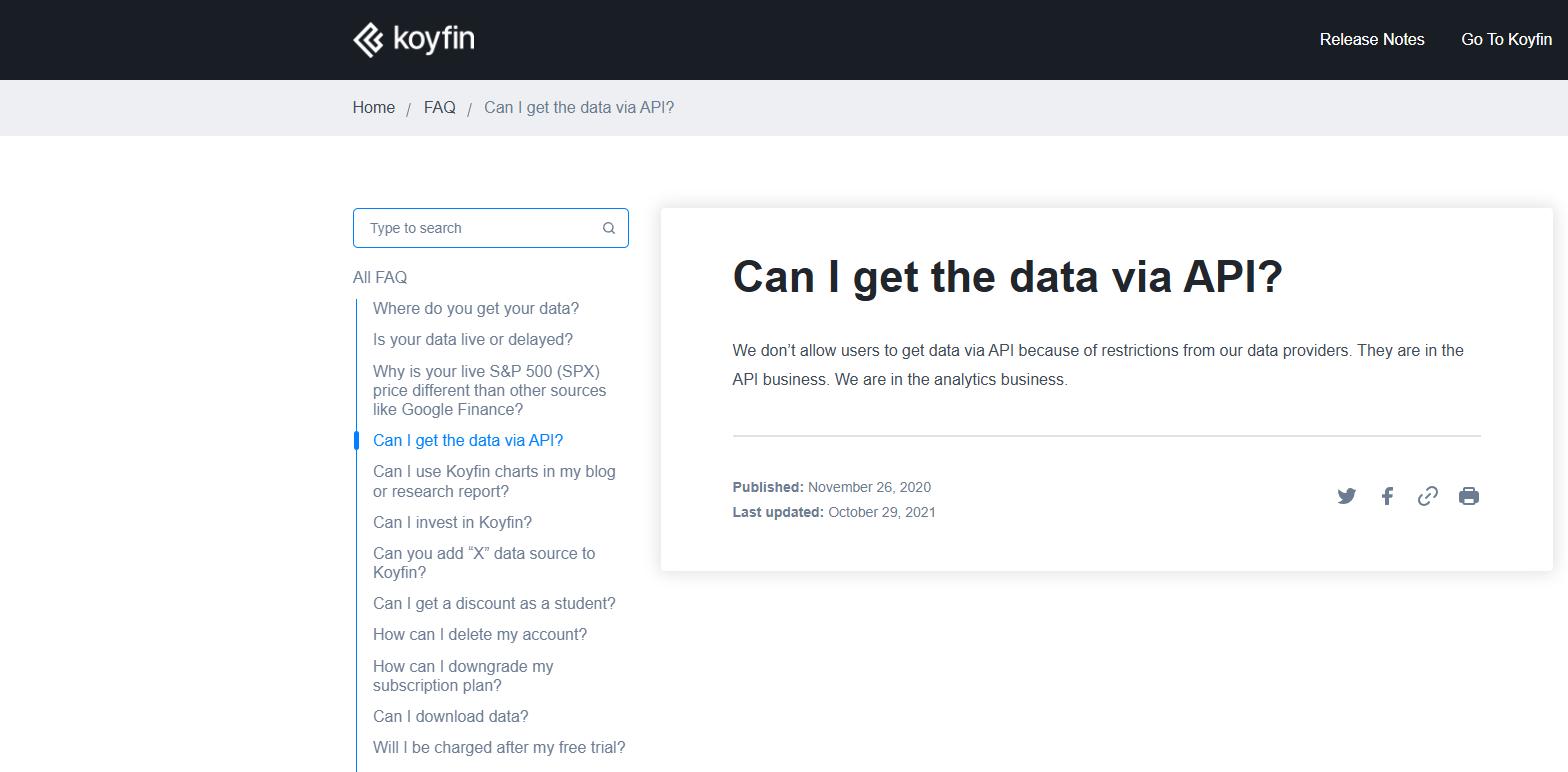
Koyfin says it does not allow API access because of restrictions from its data providers, and adds the sharpest line in this whole category: those providers are in the API business, and Koyfin is in the analytics business. TIKR says it offers neither an API nor an Excel plug-in given its agreements with its various data providers, and warns that programmatic access will close your account. Finbox says its contract with its data provider does not allow it to offer a public API. Stock Analysis is more absolute and does not give a reason: no API, no MCP server, no other interface.
4 companies, 4 help pages, 1 answer. This is what a redistribution clause looks like from the customer's side. The wholesaler sells the platform a licence to display data to a logged-in human, and display is where the licence stops. The moment data leaves the browser in a machine-readable form it is redistribution, which is a different contract at a different price, and it is the contract the wholesaler wants to sell you directly instead.
The same clause reaches further than the API. Stock Analysis notes on its data sources page that S&P does not permit downloads at all, which is why the download button on a page whose figures come from S&P quietly serves you the same line item from a different supplier. Read that twice: the number you look at and the number you export can come from 2 different companies, because of a term in a contract you will never see.
It reaches the clock, too. That same page states that S&P refreshes its financial data within hours of an earnings release, while Fiscal.ai refreshes within minutes. Both suppliers, 1 platform, an order of magnitude between them on the only night of the quarter when speed actually matters. When a platform licenses its numbers, its refresh cadence is a property of the supplier, not of the product, and no amount of good engineering on the platform's side moves it.
So the question worth asking a research tool is not how many ratios it has. It is whether it owns the pipeline that fills them. If you are going to end up wanting the data in a notebook or a spreadsheet, that question decides everything, and the financial statements API comparison covers the same split from the developer's side.
The field on one screen
- Finbox
- Finviz
- Fiscal.ai
- Koyfin
- Seeking Alpha
- Simply Wall St
- Stock Analysis
- Stock Rover
- Stockopedia
- TIKR
- WallStreetZen
- Business Quant
| Platform | Fundamentals come from |
Coverage | Paid from |
|---|---|---|---|
| Finbox | Not published | 130+ exchanges | $10/mo |
| Finviz | Not published | US listings | $24.96/mo |
| Fiscal.ai | Parsed from filings | US, Canada, UK, Europe | Not published |
| Koyfin | S&P Capital IQ, Morningstar | Global | $39/mo |
| Seeking Alpha | Not published | Not published | $299/yr |
| Simply Wall St | S&P Global Market Intelligence | 90+ markets | $10.95/mo |
| Stock Analysis | S&P Global and Fiscal.ai | Global | $6.58/mo |
| Stock Rover | Not published | Not published | $29/mo |
| Stockopedia | LSEG, S&P Global, Smart Insider | Sold by region | $395/yr |
| TIKR | S&P Global Capital IQ | Global | $24.95/mo |
| WallStreetZen | Not published | 5,300+ US stocks | $19.50/mo |
| Business Quant | Parsed from filings | US listings | $29/mo |
Scroll the table sideways for every column. Rows run alphabetically, with Business Quant placed last. "Paid from" is the cheapest paid plan, quoted on annual billing where the vendor quotes it that way. "Not published" means the vendor does not state it on its own site, not that the answer is unknown to them.
Tool by tool
Finbox
The valuation-model tool of the group, built around the idea that a retail investor should be able to run a discounted cash flow the way an analyst does rather than reading somebody else's conclusion. Open any company and you land on a gallery of pre-built models: DCF variants, earnings power value, DuPont analysis, dividend discount, a dozen multiples comparisons, each one updated and each one editable.
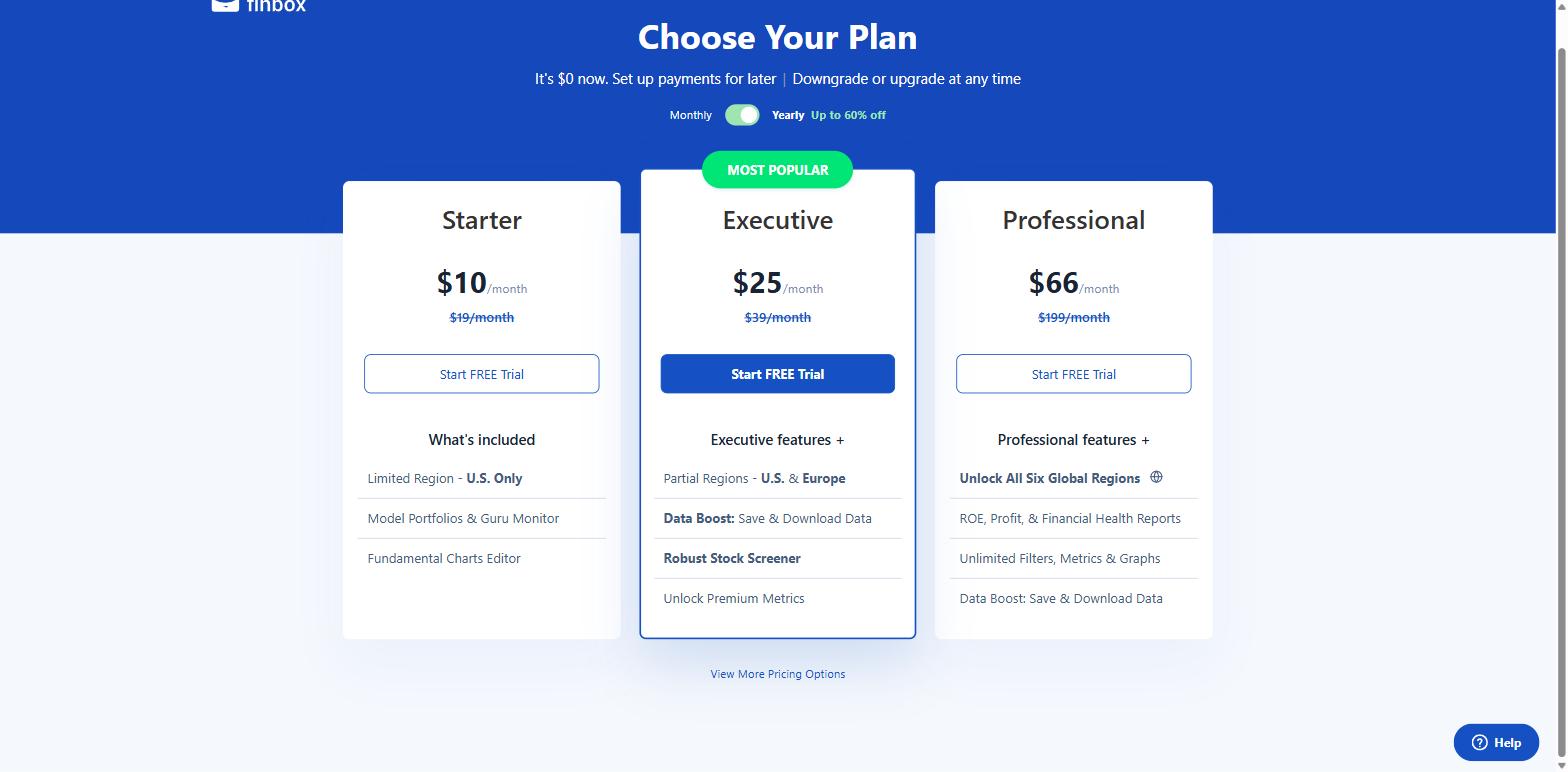
- Starter $10, Executive $25, Professional $66 a month, billed yearly.
- Monthly billing is $19, $39 and $199.
- No free plan. A card-backed trial instead.
- Starter is US only. Executive adds Europe.
- 130+ exchanges unlock on Professional.
- Downloads start at Executive, not Starter.
- No public API, by contract with its data supplier.
The pricing ladder is unusual and worth understanding before you pick a tier, because the thing it gates is geography rather than depth. Every plan gets the models and the charts; what you are actually buying at $25 and $66 is a wider map. If you only follow US names, the $10 plan is the whole product, and that is a genuinely honest way to sell to a beginner.
The gap that will find you is the missing free plan. Every other tool here except Stockopedia lets you live in it for a while before deciding, and Finbox asks for a card up front to look around. Combined with downloads starting a tier above the entry price, it is the platform in this comparison where the cheapest plan is furthest from the full product.
Finviz
The one everybody has used without paying, usually by accident, because a Finviz screener link is what people paste into forum threads. It began as a visual map of the market, the heat map with the red and green tiles, and grew a screener that stayed fast and free for long enough to become a default.
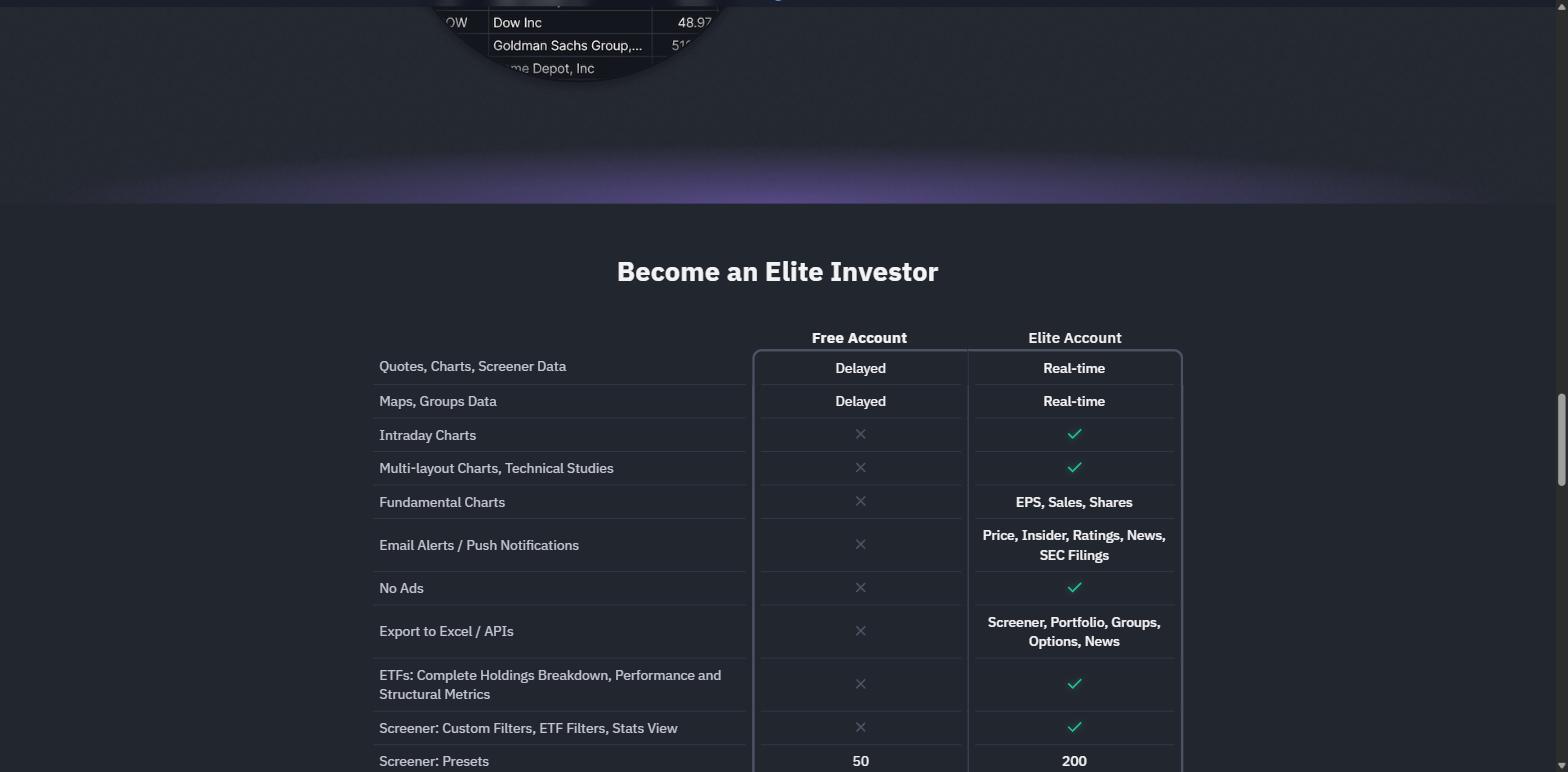
- Free account, with delayed quotes and 3 years of statements.
- Elite $24.96 a month billed annually, $299.50 a year.
- Monthly billing is $39.50.
- Elite adds real-time data, including premarket and after-hours.
- Export and APIs on Elite, across screener, portfolio, groups, options and news.
- 8 years of statements on Elite, up from 3.
- US listings only. NASDAQ, NYSE and AMEX.
Finviz is the exception that proves the licensing argument rather than breaking it. It ships an API and sample code for Google Sheets, Python and JavaScript, which no other pure web tool here does, and it does not publish a rate limit for it. Its fundamentals also refresh hourly rather than on a supplier's schedule. Whatever its arrangements are, they are visibly less restrictive than the ones Koyfin and TIKR describe.
What you give up is depth and reach. 8 years of statements is short for anyone doing long-horizon work, the coverage stops at 3 US exchanges by the company's own statement, and the fundamental data is broad rather than deep: this is a screening and monitoring tool that happens to carry financials, not an analysis platform. For the job it was built for it remains, at $24.96 a month, one of the best-value products in this comparison.
Fiscal.ai
The most interesting company on this page, because it sits on both sides of the argument at once. Formerly FinChat, it parses filings itself and then sells that feed to other people, which means several of the platforms and search products you already use are quietly running on it. Its own customer logos include Google Finance, Perplexity, KPMG and CIBC, and Stock Analysis names it as a fundamentals supplier alongside S&P.
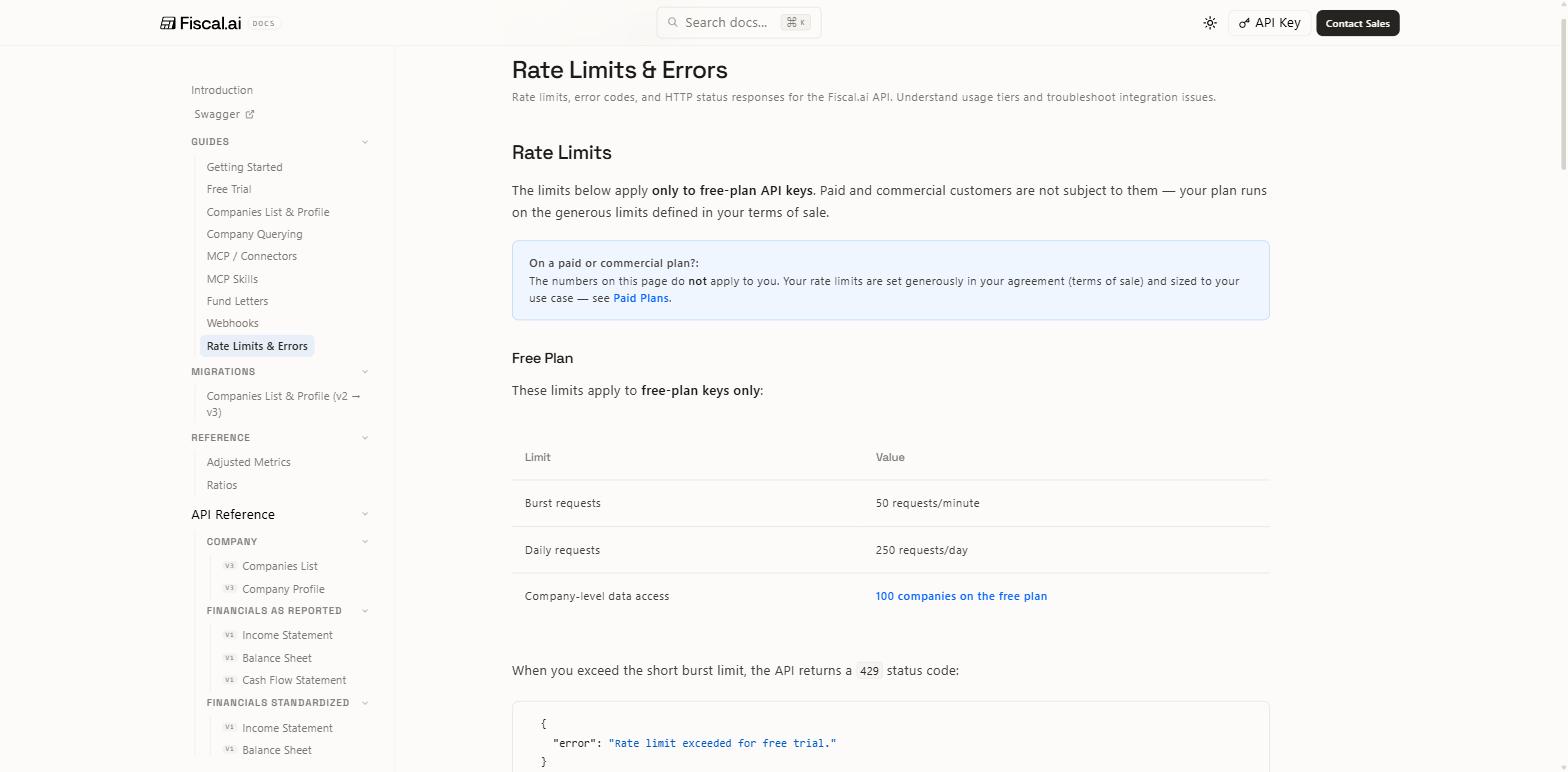
- 3 products: a web terminal, an MCP connector and a data feed API.
- No price published on any of the 3.
- Free API key, 250 calls a day and 50 a minute.
- 100 companies on the free key, a fixed published list.
- Paid limits sit in the contract, not on the site.
- Segments, KPIs and ownership are all documented endpoints.
- US, Canada, UK and Europe.
The endpoint list is the tell that this is a primary source rather than a reseller. As-reported statements sit alongside standardised ones, so you can see what the company printed and what the normalisation did to it. Segments and KPIs have their own endpoint. Insider and institutional ownership have 5 between them. There are filing images by page and filing PDFs, which only exists if you are working from the document itself.
The friction is commercial rather than technical. The terminal's price is no longer on the pricing page at all: all 3 products route you to a signup or a sales form, and the free API key is deliberately shaped as a trial rather than a small plan, since 100 named companies will not carry a real project. If you are shopping on published prices you cannot compare this one, and that is a deliberate choice by a company that has moved upmarket toward institutions.
Koyfin
The tool people reach for when they want a Bloomberg-shaped screen without a Bloomberg invoice, and the best pure charting and dashboard experience in this comparison. Macro dashboards, cross-asset views, company snapshots and a genuinely good custom-formula layer, all in a dark interface that is clearly built by people who have sat in front of a terminal.
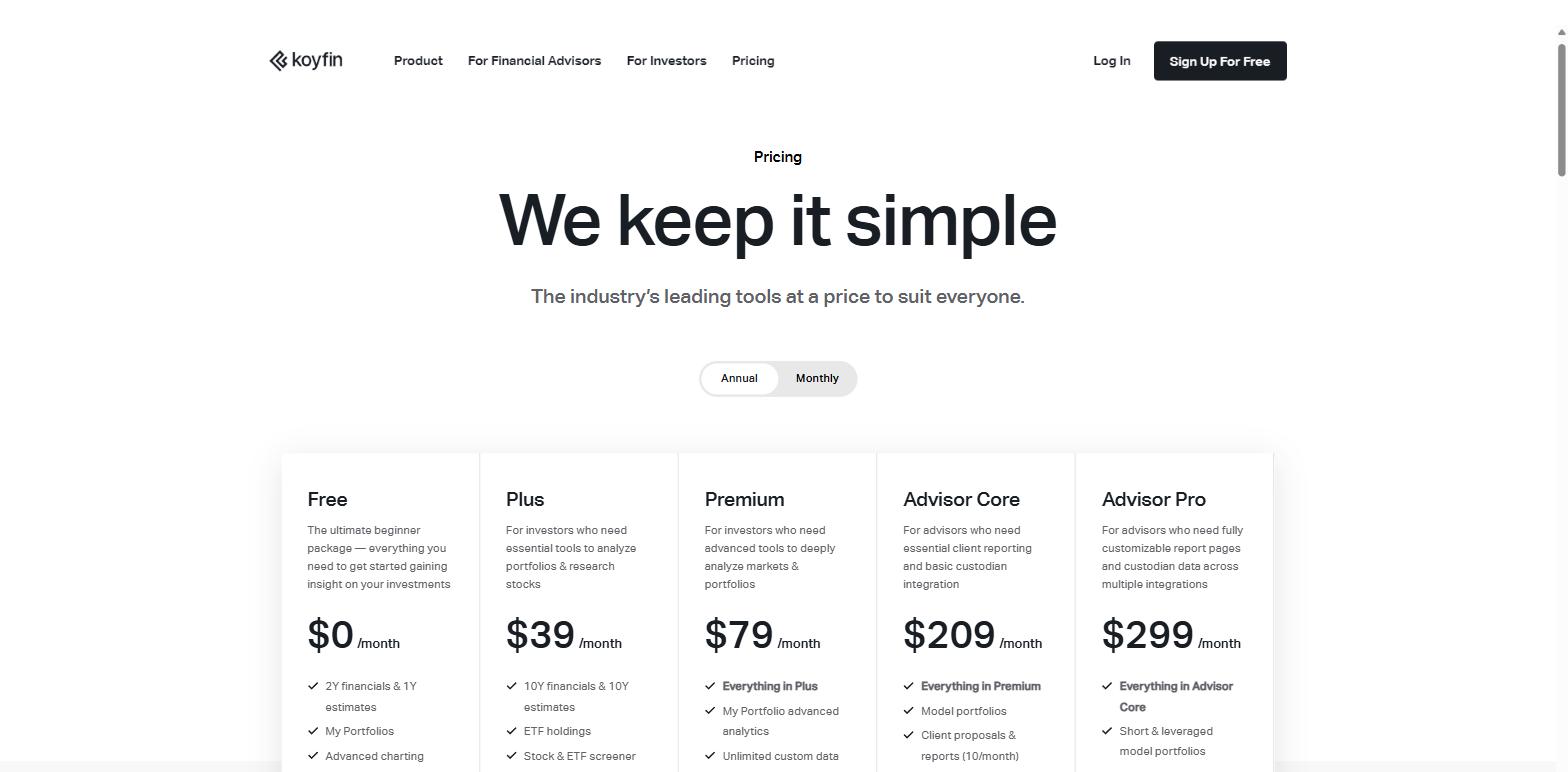
- Free $0, with 2 years of financials and 1 year of estimates.
- Plus $39 a month, with 10 years of both.
- Premium $79, adding custom data and custom formulas.
- Advisor Core $209 and Advisor Pro $299, for client reporting.
- Filings and transcripts arrive at the Plus tier.
- 100,000+ company snapshots on Plus and above.
- No API, on the record and since 2020.
The free plan is more useful than its limits suggest, because charting and the macro dashboards are not gated at all. You can run a serious top-down workflow at $0 and only hit the wall when you want history on an individual company, which is a well-judged place to put the line.
The scope worth knowing is that Koyfin is deliberately an analytics layer rather than a data business, and it says so. That produces a fast, well-designed product with an unusually clear boundary: everything you can do here happens inside the browser window, on purpose, and there is no supported route to taking the data anywhere else.
Seeking Alpha
The odd one out, and it belongs here anyway because it is where a very large number of people actually do their research. Seeking Alpha is a publishing community first: thousands of contributor articles, an argumentative comment section under each, and a quant ratings layer built on top to give the whole thing a systematic spine.
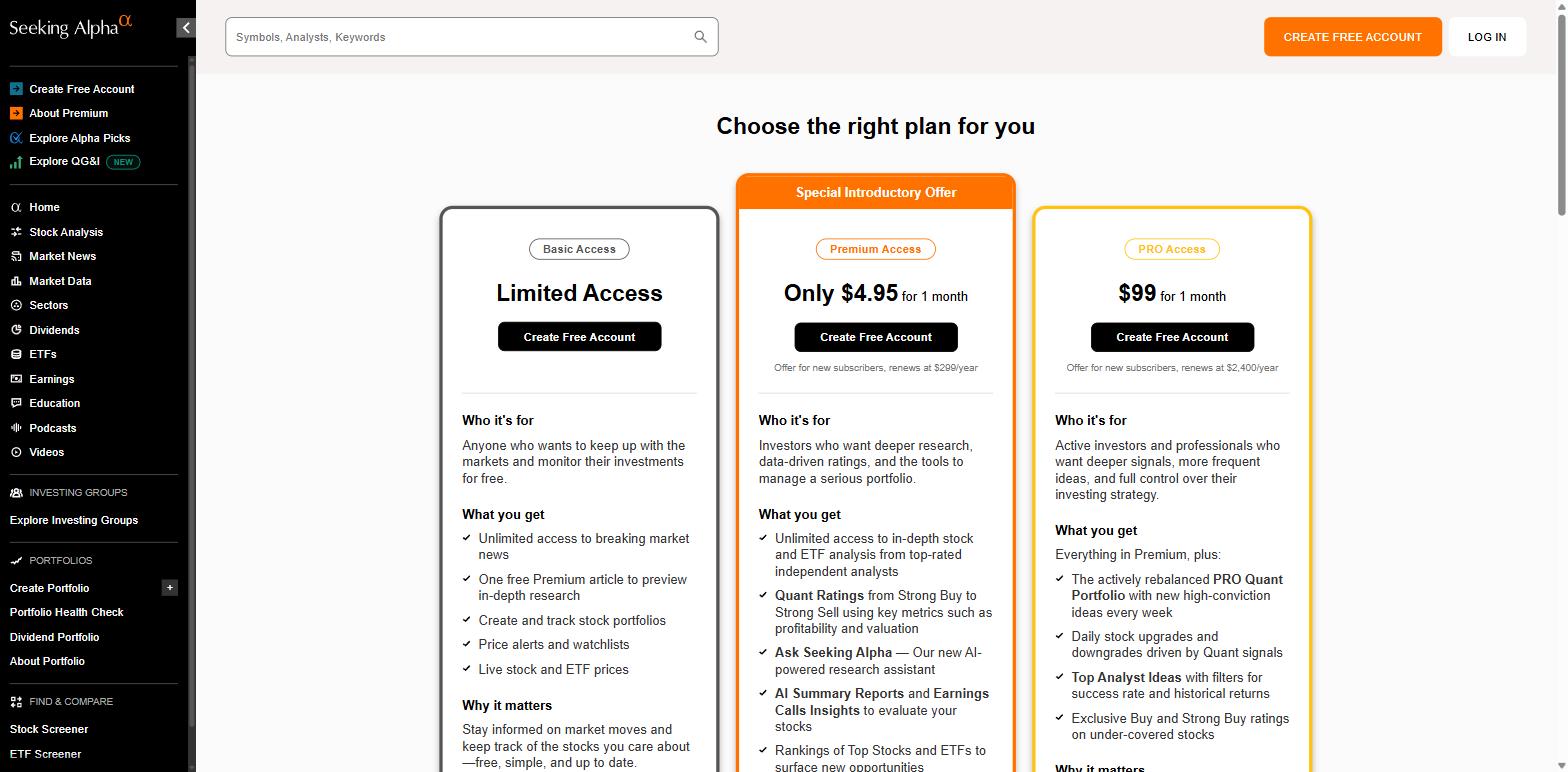
- Basic is free, with news, portfolios, watchlists and 1 Premium article.
- Premium renews at $299 a year, after $4.95 for the first month.
- PRO renews at $2,400 a year, after $99 for the first month.
- Quant Ratings run from Strong Buy to Strong Sell.
- Stock and ETF screeners sit on Premium.
- PRO adds a rebalanced quant portfolio and daily rating changes.
- No API documented for subscribers.
What you are buying is coverage of the argument rather than coverage of the data. For a small or unfashionable company, the odds that somebody has written 3,000 words on it here are better than anywhere else on this page, and the comment threads underneath are often where the actual bear case lives.
Read the pricing carefully, because the introductory numbers are prominent and the renewal numbers are in grey underneath. The gap between $4.95 and $299 is the widest first-month discount in this comparison, and the PRO tier at $2,400 a year is priced against professional research budgets rather than against the other tools here.
Simply Wall St
The one your non-financial friends can actually use. Simply Wall St turned the company report into an infographic, and the snowflake diagram scoring value, future, past, health and dividend is probably the single most recognisable visual in retail investing software.
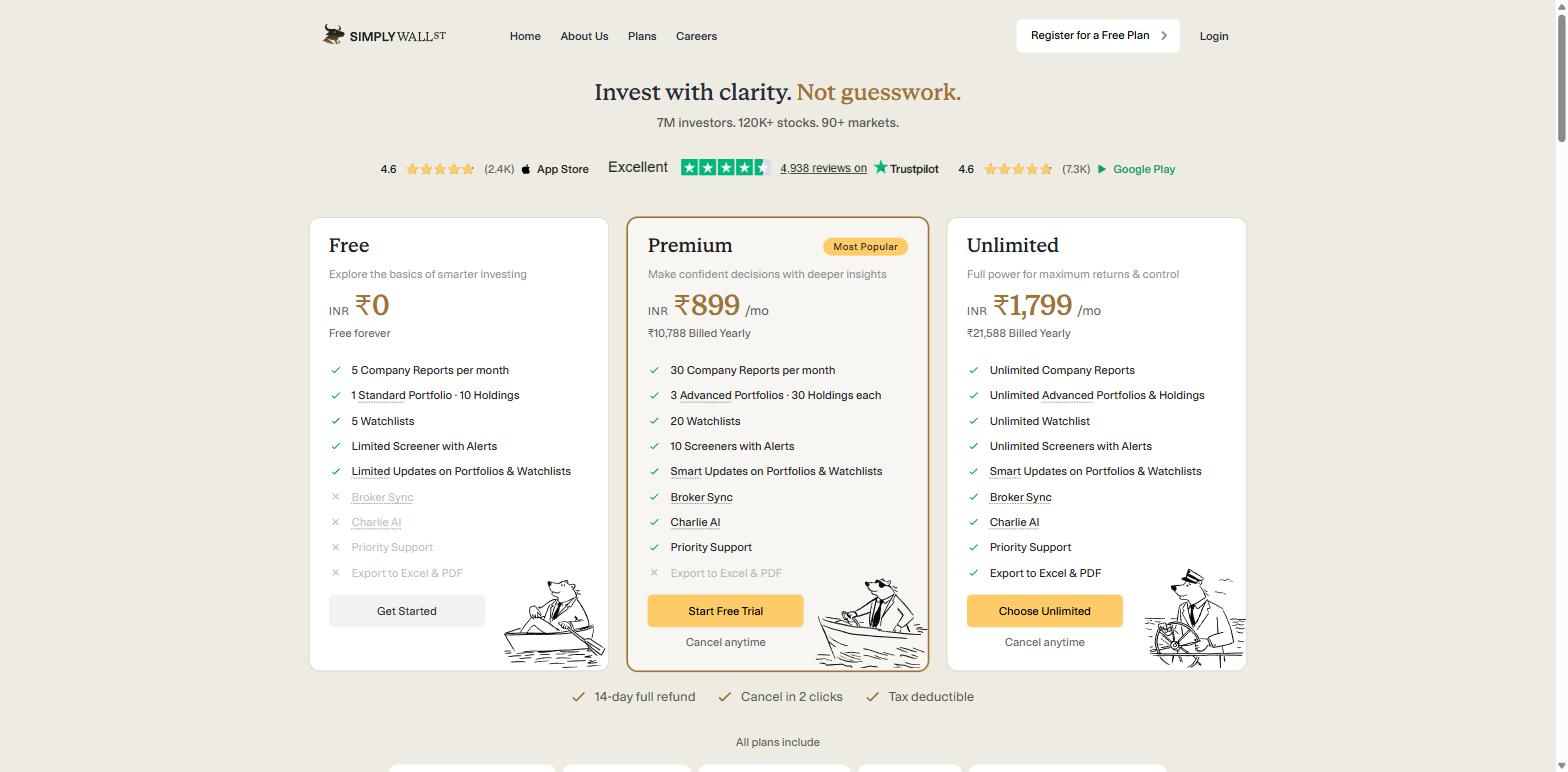
- Free plan, capped at 5 company reports a month.
- Premium $10.95 a month, $131.40 a year.
- Unlimited $21.50 a month, $258 a year.
- Export to Excel and PDF is Unlimited only.
- Broker sync starts at Premium.
- 120,000+ stocks across 90+ markets.
- S&P Global Market Intelligence supplies the financial data.
The reports are genuinely good at the job they set: giving somebody who does not read balance sheets a defensible first opinion in 90 seconds, with the reasoning visible rather than hidden behind a score. The narratives feature, where members publish their own fair-value cases, is a smart way to surface disagreement instead of pretending the model is the answer.
2 things to check before subscribing. Export sits on the top tier rather than the middle one, so the plan most people buy is a read-only plan. And prices are localised, so the figure you see depends on where you are: the numbers above are the US list, and the screenshot shows what the same page serves elsewhere.
Stock Analysis
Built and run by 5 people, and it embarrasses products with 50. Stock Analysis is the fastest site in this comparison and the most generous at $0, and it has done the unglamorous work of documenting exactly where each of its datasets comes from, which nobody else here has matched.
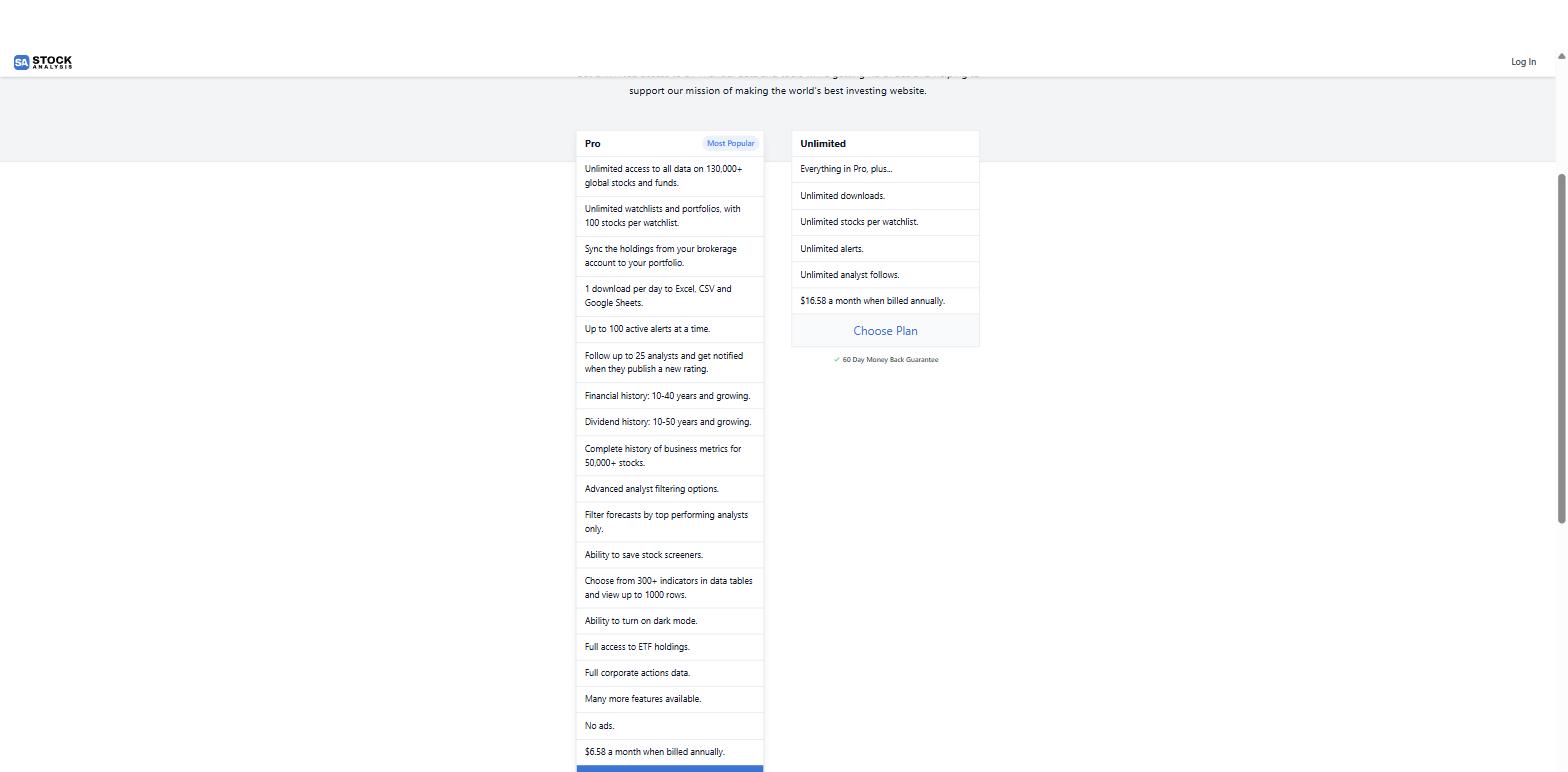
- Free forever, with no card and no trial clock.
- Pro $6.58 a month billed annually, $79 a year.
- Unlimited $16.58 a month billed annually.
- 130,000+ global stocks and funds.
- 10 to 40 years of financials, 10 to 50 of dividends.
- 1 download a day on Pro, unlimited on the tier above.
- No API, and no MCP server either.
The data sources page is the most useful document any of these companies publishes, and it is the reason this article could be written at all. It names a different supplier for fundamentals, prices, ETF holdings, dividends, corporate actions, transcripts and analyst records, tells you which supplier updates in hours and which in minutes, and explains that downloads come from a different source than the display because the primary one forbids them.
That candour is also the clearest illustration of the ceiling. A user can switch data source from a dropdown above the financial statements, which is a thoughtful piece of engineering and an admission at the same time: the platform is arranging other people's numbers, and where they disagree the honest move is to let you choose. At $79 a year, that is a very good deal and a real constraint in the same product.
Stock Rover
The screening and portfolio-analytics tool for people who like a dense screen, and the most spreadsheet-minded product here. Stock Rover has been around long enough to have accumulated a deep metric library, a strong research-report layer and a portfolio module that connects to brokerages and tells you what your holdings actually add up to.
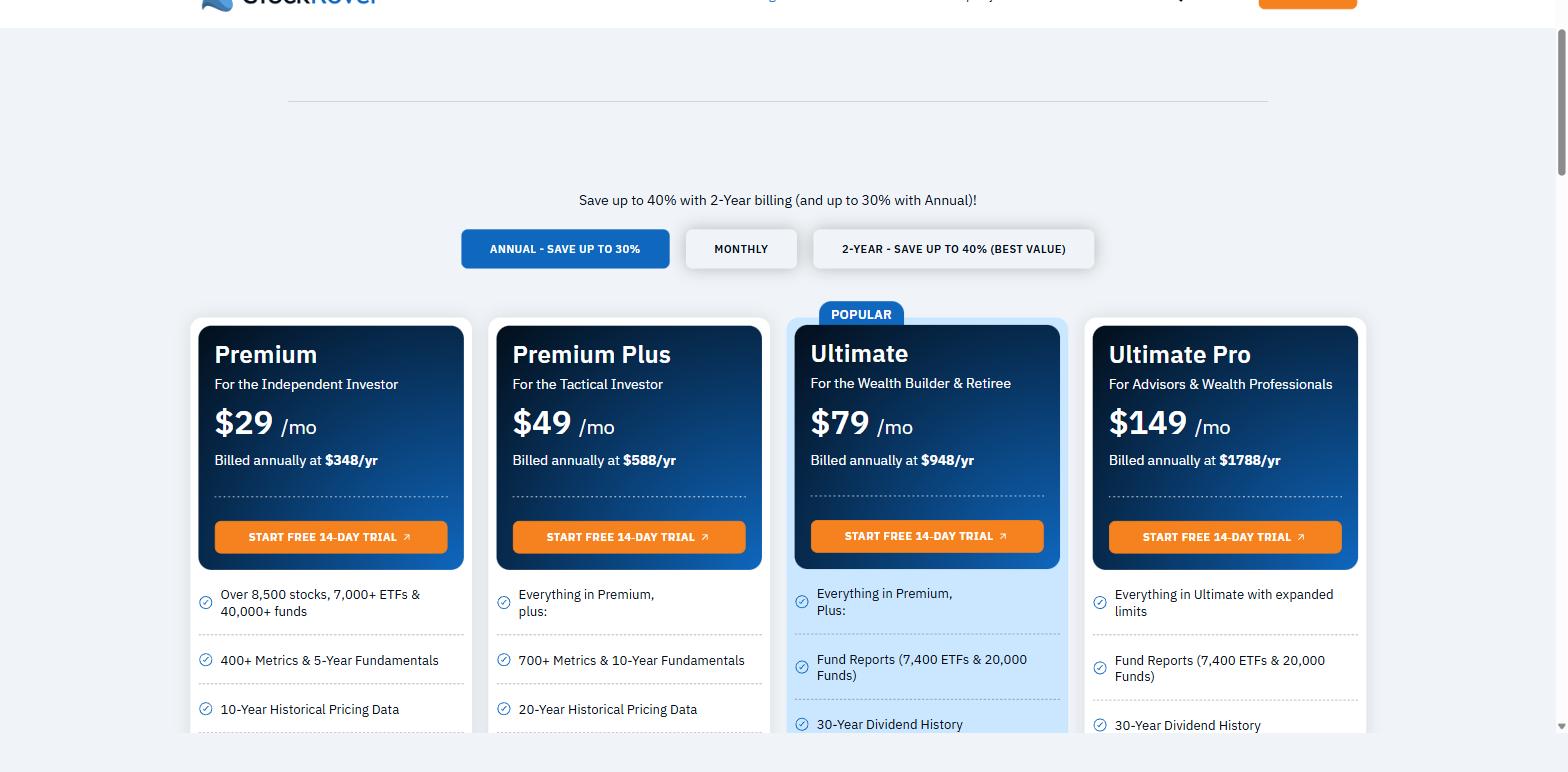
- Premium $29 a month, $348 a year.
- Premium Plus $49, Ultimate $79, Ultimate Pro $149.
- A 2-year billing option cuts up to 40%.
- 8,500+ stocks, 7,000+ ETFs, 40,000+ funds.
- 400+ metrics and 5-year fundamentals on Premium.
- 700+ metrics and 10-year fundamentals on Premium Plus.
- 30-year dividend history from Ultimate.
The tier structure is the most legible in this comparison: each step up buys a specific, stated number of metrics and years of history, with no feature puzzles. If you know you want 10 years of fundamentals and 700 fields to screen on, you can price that in 5 seconds, which is more than can be said for most of the field.
What the published material does not tell you is the shape of the universe. The plan cards give counts for stocks, ETFs and funds without saying which markets they cover, and no API is documented anywhere on the site. For a US-focused screener the counts are ample; if your question is whether a particular foreign listing is in there, you will have to ask.
Stockopedia
The quant-scores platform, born in the UK and built around the StockRanks: a composite of quality, value and momentum applied consistently to every company in the covered universe, with the ranking history published so you can see how the system has behaved rather than being asked to trust it.
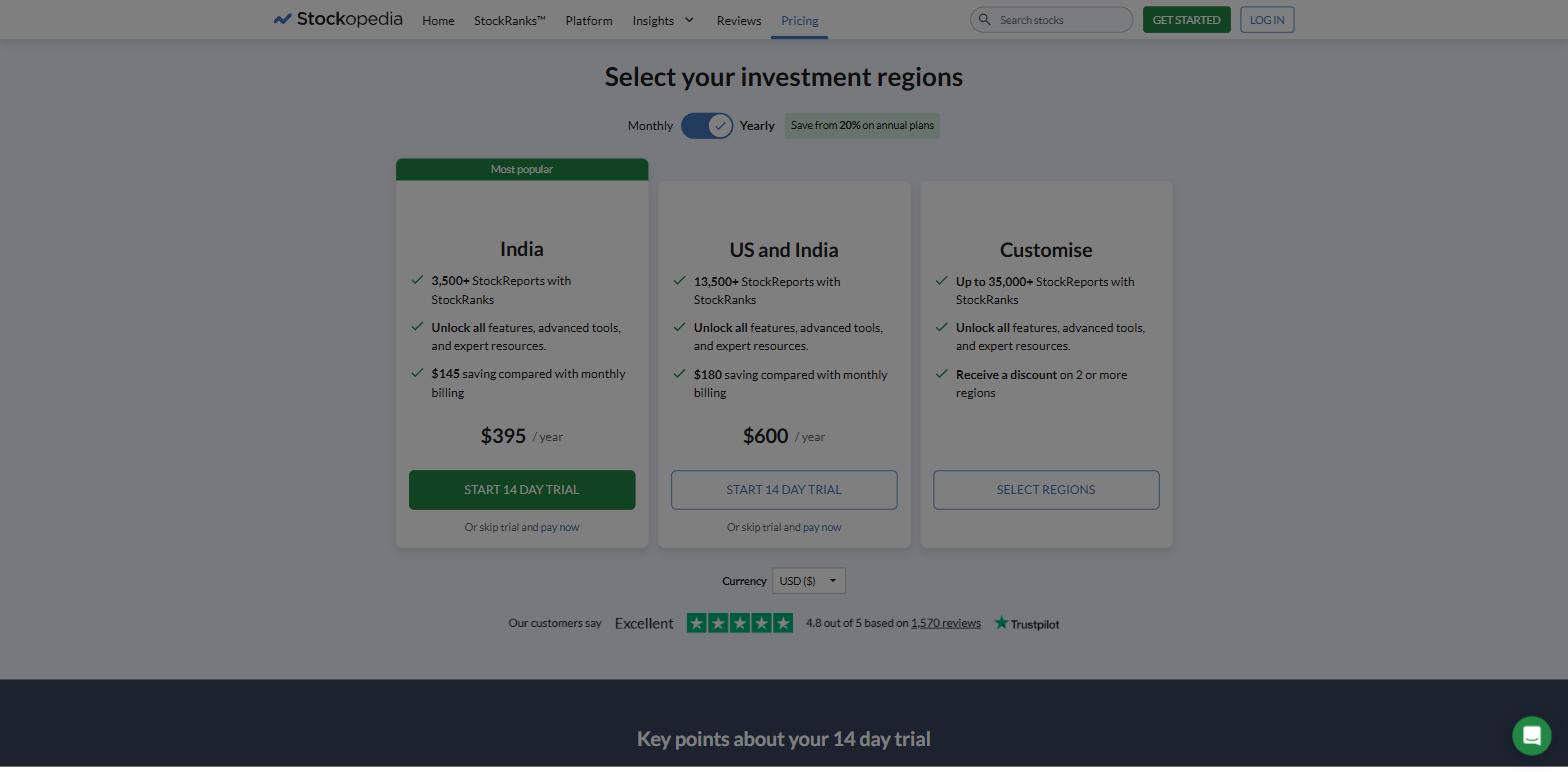
- $395 a year for one region, $600 for 2.
- Up to 35,000+ StockReports across the full set.
- No free plan. A 14-day trial needs a card.
- 350+ financial ratios in the screener.
- 65 GuruScreens, prebuilt on published strategies.
- Director deals and dividends inside every StockReport.
- LSEG, S&P Global and Smart Insider behind the data.
The region-based pricing is genuinely unusual and, for the right buyer, the fairest model on this page: somebody who only invests in one market is not subsidising coverage of 8 others. It also makes Stockopedia the most expensive option here for anyone who wants breadth, since regions stack.
The 3-supplier credit line in the footer is worth noticing, because it explains the product. Prices and fundamentals from 2 wholesalers and director dealings from a specialist is a sensible assembly, and the value Stockopedia adds is the ranking model on top rather than the numbers underneath. There is no documented API, which is what you would expect given that assembly.
TIKR
The clearest expression of the licensing model in this whole comparison, and it does not hide it. TIKR exists to put S&P Global Capital IQ data, the dataset professional funds pay five figures a year for, in front of individuals at a retail price, and it names that partnership on its own pricing page as the headline reason to trust the numbers.
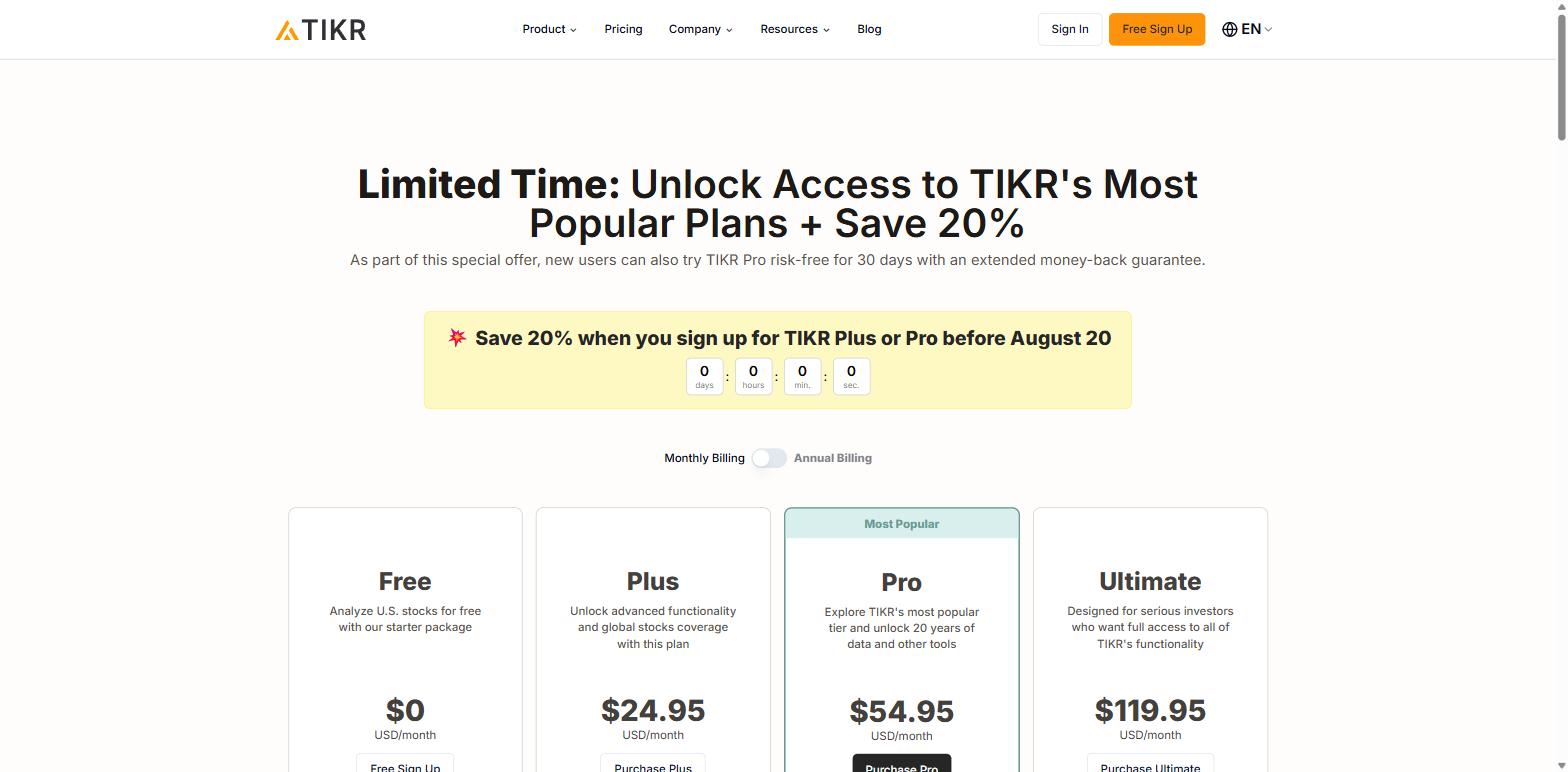
- Free plan, US only, 5 years and 8 quarters.
- Plus $24.95 a month, adding global coverage and 10 years.
- Pro $54.95, with 20 years of charting and 10 of transcripts.
- Ultimate $119.95, at 30 years and 40 quarters.
- Institutional holders start at Pro, and stop at the top 10.
- Guru portfolios reach 10,000+ funds on Pro and above.
- No API and no Excel plug-in, by agreement with its suppliers.
For long-horizon fundamental work on global companies, the Ultimate tier is the deepest dataset an individual can buy at a published price anywhere on this page. 30 years of annual history and 40 quarters, with estimates and transcripts alongside, is a research capability that did not exist at this price 10 years ago, and the interface stays out of the way.
The support article on programmatic access is the one to read before you build anything on it. TIKR does not merely decline to offer an API; it warns that attempting to access the site programmatically results in permanent closure of your account. That is the licence talking, not the engineering team, and it is the clearest statement in this market of what a display-only agreement means in practice.
WallStreetZen
The plain-English tool. WallStreetZen runs a 115-factor quant model over US stocks, publishes the result as a letter grade, and then does something the rest of this field mostly does not bother with: it explains, in a sentence, why a stock moved today, with a human having read the filing or the press release behind it.
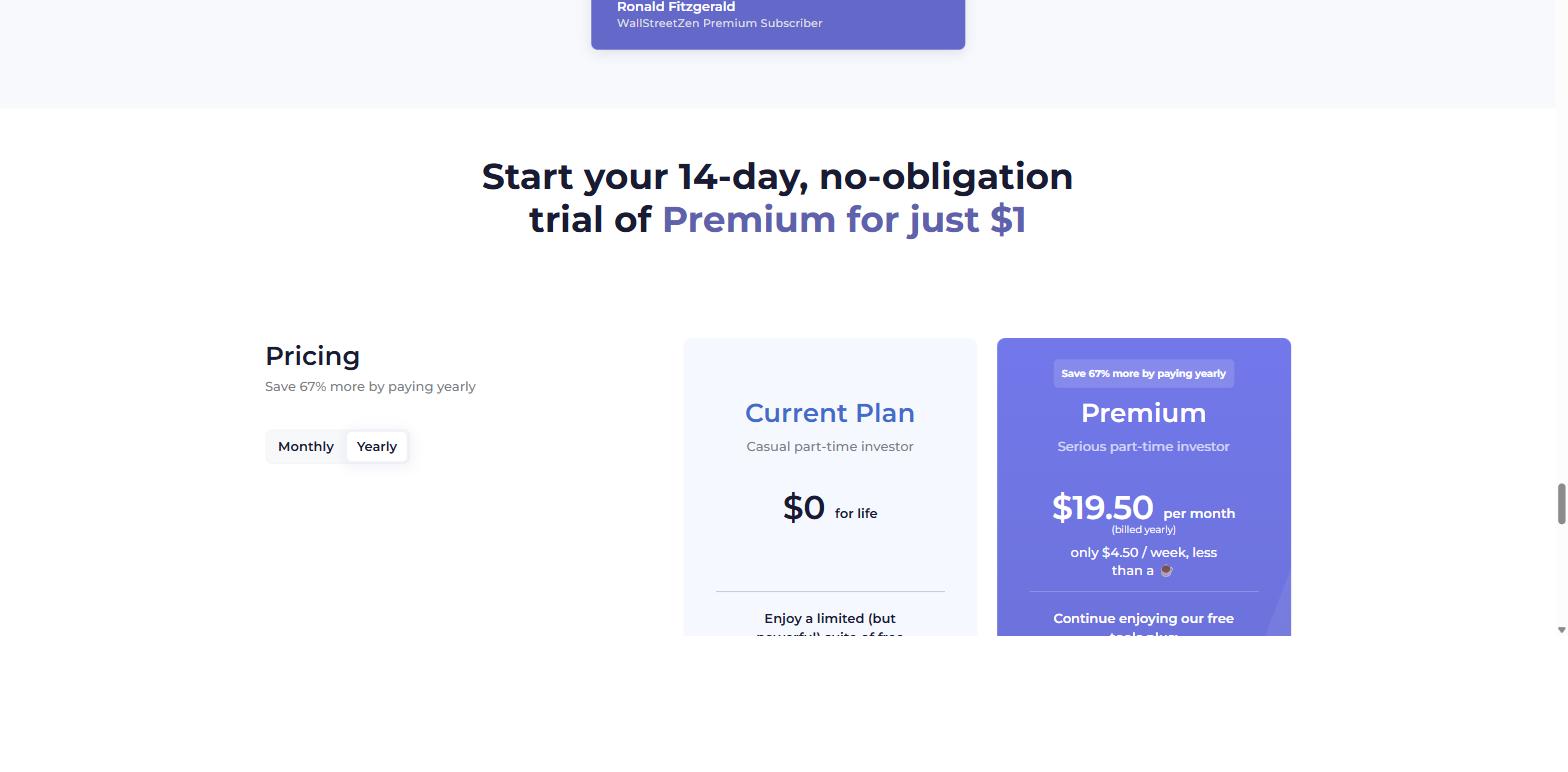
- Free plan for life, with due-diligence checks on 10 stocks.
- Premium $19.50 a month, billed yearly.
- A $1 trial runs for 14 days.
- Zen Ratings score 115 factors into a single grade.
- 4,000+ analysts tracked by realised return.
- 5,300+ US stocks covered.
- Screener export is Premium only.
The analyst database is the underrated part. Filtering forecasts to analysts who have actually been right, rather than averaging everybody into a consensus that nobody is accountable for, is a genuinely better way to read sell-side research, and very few tools at any price do it.
The boundary is coverage and scope. 5,300 US stocks is the smallest universe in this comparison, the model is the product rather than the underlying data, and there is no documented API. This is a tool for forming a quick view on a mid or large-cap US name, and it is very good at that specific job.
Business Quant
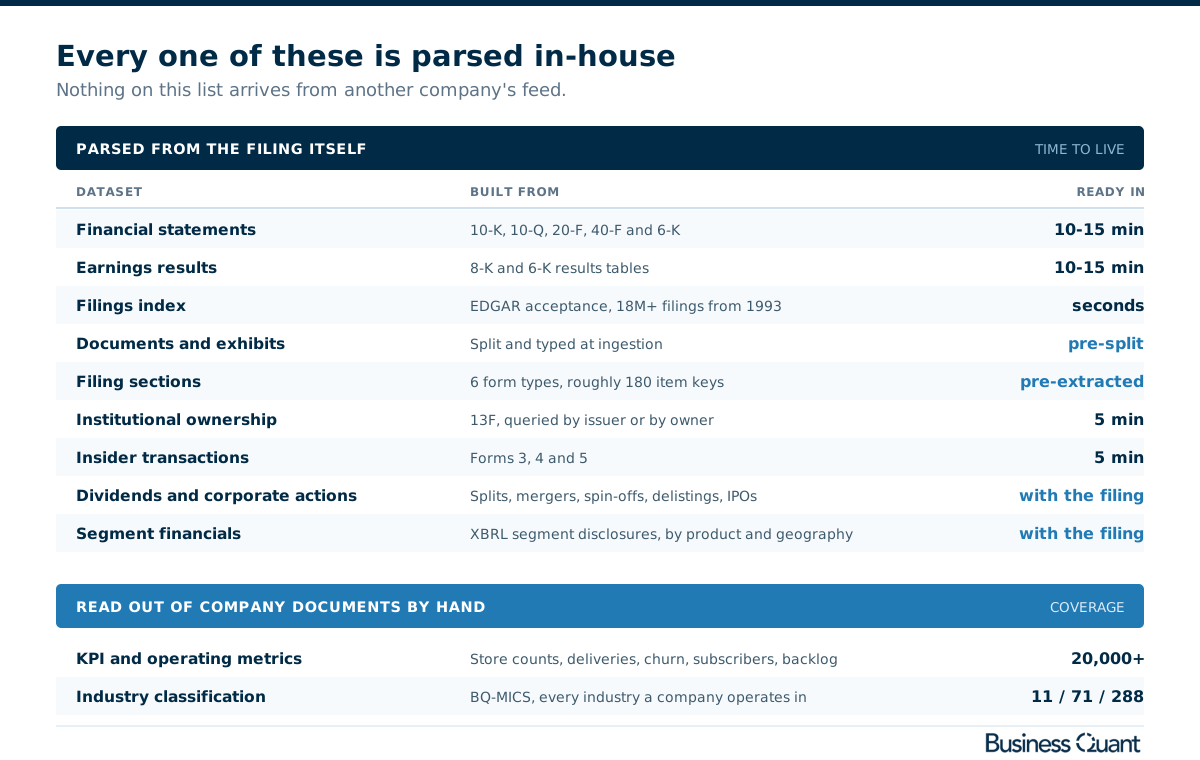
Built the expensive way round: every dataset on the platform is parsed out of the primary document rather than licensed from a wholesaler, which is why the API is on every plan instead of being forbidden by somebody else's contract.
- Free to use, no card required.
- Pro $29 a month billed annually ($49 month to month), at 75 API calls a minute.
- Max $59 a month billed annually, at 300 API calls a minute.
- Ultra $120 a month billed annually, at 600 API calls a minute.
- Enterprise from $199 a month billed annually, at 900 API calls a minute.
- The API is on all 5 plans, free included, at 30 calls a day without paying.
- Statements within 10 to 15 minutes of the filing publishing.
- 18M+ filings back to 1993, documents already split.
- 20,000+ KPI metrics, read out of company documents by analysts.
- ~35,700 US-listed securities, including OTC and ETFs.
Every endpoint is listed in the API documentation.
3 pieces of that are worth expanding, because they are where owning the pipeline shows up as something you can use. Statements are extracted with industry templates built in-house, so a bank, an insurer and a software company each get a schema that fits them and every line item still means the same thing across the market. SEC filings are not fetched on request: documents are split and typed at ingestion and sections are extracted in advance, so a 20-F from 2011 answers as fast as one filed this morning. And every company is classified under BQ-MICS, an in-house taxonomy of 11 sectors, 71 industry groups and 288 industries that tags a company in every industry it genuinely operates in rather than forcing it into one.
Ownership, dividends, corporate actions and segment financials come out of the same pipeline and share the same identifiers, which is why a 13F or a Form 4 lands within 5 minutes of appearing on EDGAR and lines up with the statements without a join you had to invent. The KPI library is the part that cannot be automated: store counts, deliveries by model, churn, subscriber numbers and backlog are read out of presentations and transcripts by analysts, and paid plans include the right to request new companies each month.
The scope worth stating up front: coverage is US-listed equities only, which is narrower than 7 of the other 11 platforms on this page. Price quotes are licensed from authorised market data vendors rather than collected first-hand, and the article says so because the rest of the pipeline is the claim. Commercial redistribution sits on the enterprise plan rather than the free access, and the free access holds statements to 3 years and KPI and segment data to a single quarter, which is enough to judge the data and not enough to work in.
The 4 dividing questions
4 questions separate these 12 once the interface stops being the thing you are looking at. Each one changes what you can build on top of the tool rather than how it looks while you use it.
| Platform | Free account not a trial |
API documented |
API at the entry price |
Beyond US listings |
Paid from |
|---|---|---|---|---|---|
| Fiscal.ai | ✓ | ✓ | ✓ | ✓ | Not published |
| Business Quant | ✓ | ✓ | ✓ | ✗ | $29/mo |
| Finviz | ✓ | ✓ | ✗ | ✗ | $24.96/mo |
| Koyfin | ✓ | ✗ | ✗ | ✓ | $39/mo |
| Simply Wall St | ✓ | ✗ | ✗ | ✓ | $10.95/mo |
| Stock Analysis | ✓ | ✗ | ✗ | ✓ | $6.58/mo |
| TIKR | ✓ | ✗ | ✗ | ✓ | $24.95/mo |
| Finbox | ✗ | ✗ | ✗ | ✓ | $10/mo |
| Seeking Alpha | ✓ | ✗ | ✗ | ✗ | $299/yr |
| Stock Rover | ✓ | ✗ | ✗ | ✗ | $29/mo |
| Stockopedia | ✗ | ✗ | ✗ | ✓ | $395/yr |
| WallStreetZen | ✓ | ✗ | ✗ | ✗ | $19.50/mo |
Ordered by tick count, ties broken alphabetically. A tick means the capability is documented in that platform's own published material. A cross means it is absent from that material or excluded at that tier, not that it is impossible. "Beyond US listings" asks whether the platform documents coverage of listings outside the United States. "API at the entry price" asks whether the cheapest plan a person can sign up for, free plans included, carries programmatic access.
Read the middle 2 columns as a description of who each product was built to serve rather than as a scoreboard. A cross in the API columns is the normal state of this market, not a defect: 9 of these 12 are analytics products sitting on a licence, and for somebody who wants to open a browser, form a view and close it again, that is exactly the right shape and often the better-designed one. The columns matter the moment your work leaves the browser, and not a minute before.
What Business Quant unlocks
Owning the pipeline is only interesting if it turns into something you can do. Here is what each part of it buys, against what a licensed platform can offer instead.
| What you want | What you get |
|---|---|
| Numbers the night results land | Statements parsed within 10 to 15 minutes of the filing |
| The same data in your own code | API access on every plan, free included |
| To try it before paying anything | The same API at $0, no card |
| To backfill a universe overnight | 300 calls a minute on Max, up to 900 a minute on Enterprise |
| A full filings archive, not a search box | 18M+ filings from 1993, documents pre-split |
| One section of a 10-K, not the whole thing | Sections extracted in advance across 6 form types |
| To watch what funds and insiders are doing | 13F and Forms 3, 4 and 5 within 5 minutes |
| Comparable line items across an industry | Statements extracted with in-house industry templates |
| Operating detail that is not in a standard tag | 20,000+ KPI metrics read from company documents |
| Revenue split by product and geography | Segment financials from the XBRL disclosures |
| Splits, spin-offs and dividends in one history | Corporate actions parsed from the filings |
| A company filed under every business it runs | BQ-MICS, at 11 sectors and 288 industries |
| A backtest that includes what delisted | Delisted and acquired companies retained |
Priced by sales call
Several well-known research tools are missing from the roster above on purpose, because you cannot buy them the way you buy the 12. Each one publishes no price and routes you to a conversation instead, which is a legitimate way to sell software and a genuine reason a reader shopping in this bracket will not be comparing them like for like.
- Bloomberg Terminal. The reference product, and priced accordingly.
- FactSet. Workstation-first, with entitlements per seat.
- S&P Capital IQ. The wholesaler behind several tools above.
- AlphaSense. Document search across filings, transcripts and broker research.
- YCharts. Its plans page carries a phone number instead of a price.
- Morningstar Direct. Institutional analytics, sold separately from the retail app.
- Quartr. Both the platform and the API are contact-sales.
- Daloopa. Model-ready fundamentals, sold to funds.
2 of those are worth a sentence more, because they are why this market looks the way it does. S&P Capital IQ is not a competitor to the tools above so much as the substance inside several of them, which is what the copyright lines and help articles quoted earlier are telling you. And AlphaSense, whose blog ranks for the exact search that brought you here with a listicle placing AlphaSense first, is the pattern this whole format has to work to avoid.
The tool I would open first
If you invest outside the United States, Business Quant is not the answer, and 7 of the platforms above cover that ground better at prices between $10.95 and $119.95 a month.
For US-listed research, and particularly if any part of your work eventually leaves the browser, I would start with Business Quant.
The argument is the one the opening makes. A research tool built on somebody else's licence inherits that licence's limits, and those limits show up exactly where the work gets serious: no API, no bulk export, a refresh cadence set by a supplier's schedule, and in one documented case a different source behind the download button than behind the number on screen. A platform that parses its own filings has none of those constraints to pass on, because there is no contract between the document and the screen.
3 specifics sit behind that, each checkable against what this page has already stated. Statements land within 10 to 15 minutes of a filing being published rather than within hours, because nothing is waiting on a supplier. Every filing back to 1993 is already split into its documents and its sections before anybody asks for it, so the archive answers at the same speed as this morning's news. And the API is on all 4 plans, so the thing you prototype against is the thing you scale on, up to 50,000 calls a day on the Max plan and no daily cap at all on Enterprise.
The limits, in the same breath: US-listed equities only, price quotes licensed rather than collected, commercial redistribution on the enterprise plan, and free access that holds statements to 3 years and operating data to a single quarter.
Here is the 20-minute test I would run before paying anyone, us included. Pick a company you already follow that filed results in the last week. Time how long each tool took to show the new quarter. Then try to get that same quarter out of the tool and into a spreadsheet or a script, and count how many of them let you. Those 2 numbers will tell you more about what you are buying than any feature list, and you can run the whole test on free plans this afternoon.
How this comparison was made
One test set the roster: a subscription research platform for public-company fundamentals, used in a browser, that an individual can sign up for and pay for directly without a sales conversation or an institutional contract. Products sold only through a sales call did not qualify however well known they are, and they are named in their own section rather than quietly omitted. 12 products met the test and 12 are reviewed. The number is what the test produced rather than a target set in advance.
Every price, plan boundary and coverage figure was read at the vendor's own pricing or help pages on 18 August 2026 and screenshotted there, rather than taken from other roundups. Where a vendor does not publish something the table says "Not published" instead of carrying an estimate. Statements about where each platform's data comes from, and about whether it offers an API, are drawn from that platform's own help centre or page footer and from nowhere else. The Business Quant figures come from its own API documentation and its data sources page, read the same day, and from its own plans page, re-read on 3 October 2026.
2 orderings are used, each by a stated rule. The reviews and the bullet list run alphabetically, with Business Quant placed last rather than first. The dividing table runs by tick count with ties broken alphabetically, which puts Fiscal.ai top on 4 and Business Quant second on 3. Business Quant makes one of these 12 products and is measured on the same 4 questions as the other 11, including the one it loses. If you want the same field judged from the developer's side instead, the screener API comparison and the SEC filings API comparison apply the same tests to endpoints rather than interfaces.
Image credits. Header photograph by Jakub Żerdzicki on Unsplash, used under the Unsplash License. Vendor screenshots were captured on 18 August 2026 from each provider's own pricing, plans or help pages and are reproduced for comparison. Diagrams are Business Quant originals.
Frequently asked questions
Which stock research tools are free to use?
Most of them run a free plan, and the free plans differ far more than the paid ones do. Stock Analysis is the most generous of the pure web tools, with a permanent free account across 130,000 symbols. Finviz, Koyfin, TIKR, Simply Wall St, Seeking Alpha, Stock Rover and WallStreetZen all keep a free plan too, though each one draws the line somewhere different: Koyfin caps you at 2 years of financials, TIKR at US listings only, Simply Wall St at 5 company reports a month. Business Quant is free to use with no card and the API is included at that level. Finbox and Stockopedia are the 2 here with no free plan at all, only a card-backed trial.
Do any stock research platforms offer an API?
3 of the 12 do, and the reason the other 9 do not is worth knowing before you shop. Fiscal.ai publishes a full data feed API with a free key, Finviz includes export and API access with its Elite plan, and Business Quant carries the API on every plan including the free one, scaling from 30 calls a day without paying to 300 a minute on Max and 900 a minute on Enterprise. Koyfin, TIKR, Finbox and Stock Analysis all state plainly on their own help pages that they have no API, and 3 of those 4 give the same reason: their agreements with the data vendors they license from do not permit it. It is a licensing outcome rather than a product decision.
Where do stock research websites get their data?
Usually from 1 of 3 or 4 wholesalers, and most of them publish it if you look. Koyfin licenses from over a dozen vendors with fundamentals from S&P Capital IQ and fund data from Morningstar. TIKR names S&P Global Capital IQ. Simply Wall St carries an S&P Global Market Intelligence copyright line in its own footer. Stockopedia credits LSEG, Smart Insider and S&P Global. Stock Analysis publishes the most detailed breakdown of the lot, naming a different supplier for fundamentals, prices, ETF holdings, dividends, corporate actions, transcripts and analyst records. Fiscal.ai and Business Quant are the 2 that build their fundamentals from the filings themselves.
What is the cheapest paid stock research tool?
Stock Analysis Pro at $6.58 a month on annual billing, which is $79 a year, and it is not a stripped plan: it carries 130,000 symbols, 10 to 40 years of financials and 300 indicators. Simply Wall St Premium is next at $10.95 a month, then Finbox Starter at $10 a month on yearly billing but with no free plan behind it, then WallStreetZen Premium at $19.50. At the other end, Seeking Alpha PRO renews at $2,400 a year and Stockopedia starts at $395 a year for a single region. Price tracks how much of somebody else's licence the platform is paying for.
Which stock research tool is best for SEC filings and ownership data?
Filings and ownership are where this field thins out fastest, because both are laborious to build and neither comes free with a fundamentals licence. Koyfin puts press releases, filings and transcripts on its $39 Plus plan. TIKR shows company filings on the free plan but holds the top 10 institutional holders back to its $54.95 Pro tier. Fiscal.ai exposes filings, insider and institutional ownership through its API. Business Quant indexes 18 million filings back to 1993 with every document already split and typed, extracts filing sections in advance, and publishes 13F and Form 4 activity within 5 minutes of the filing appearing.