
In the intricate world of stock market investing, knowledge equates to profit. Most investors just look at the headline financial figures while analyzing, and call it a day. However, beyond the surface of broad financial statements lies a treasure trove of details: segment financials, KPI Data, and operating metrics. Including these items in your stock research workflow can potentially lead to greater profits and remarkable returns in stock investing. Let’s take a closer look at it all.
Beyond the Basics: Segment Financials
Modern businesses, especially multinational giants, rarely operate in a singular domain. They branch out into different geographical locations and diversify into various product lines or services. These individual units within a company, known as segments, often have their financial trajectories, impacting the overall profitability and potential of the company.
Example: Consider Apple Inc. While most recognize it for its iPhones, Apple operates in various segments—iPads, Macs, Services, Wearables, and more. Each of these segments can perform differently based on multiple factors like market demand, competition, and innovation. Tracking their segment-level revenue can provide us with leading insights about how the company’s performance is evolving over time and if it is on the verge of a slowdown or growth acceleration.
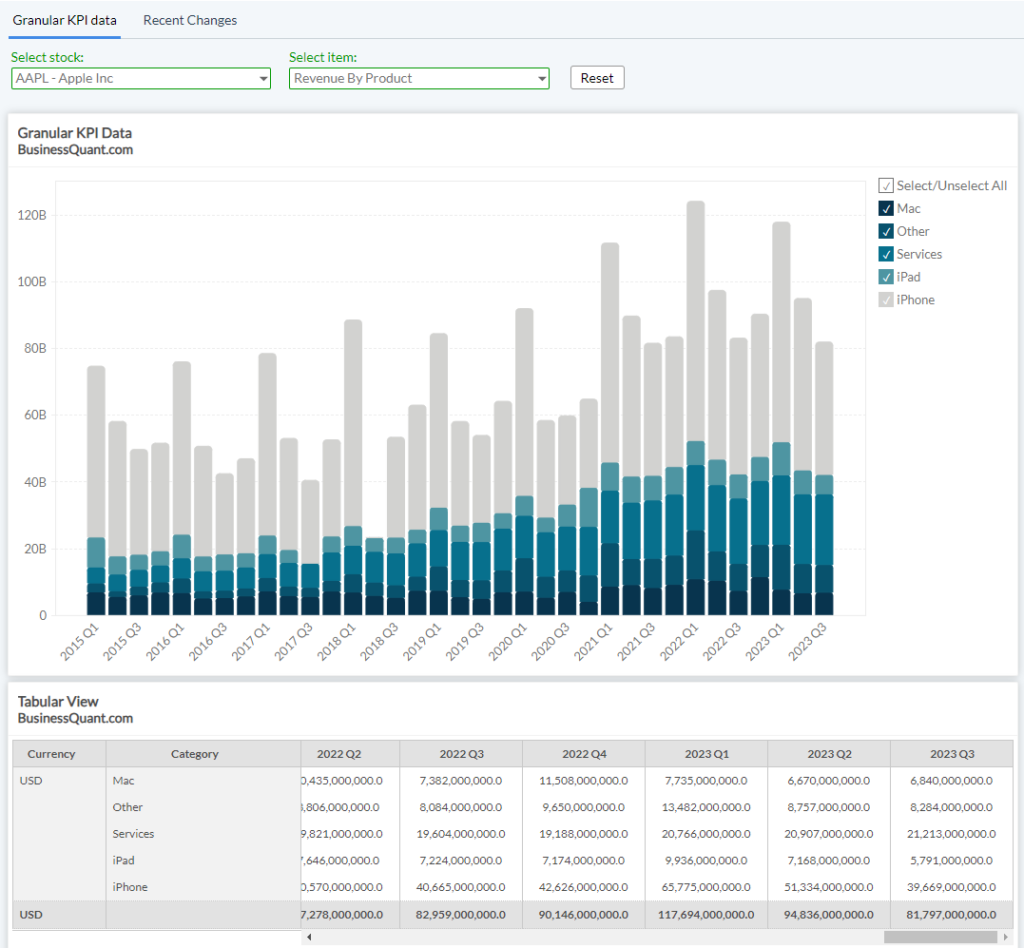
Simply put, segment financials are the detailed financial breakdowns of these individual units within a company. These can include metrics like revenue, profit margins, and costs related to each segment.
Why is this important?
- Precision in Analysis: Rather than relying on a blanket overview, investors can pinpoint which segments are thriving and which are lagging, providing a clearer picture of the company’s future.
- Risk Management: It allows investors to gauge the risk associated with specific segments, thus diversifying their portfolio accordingly.
The Crystal Ball: Operating Metrics and KPI Data
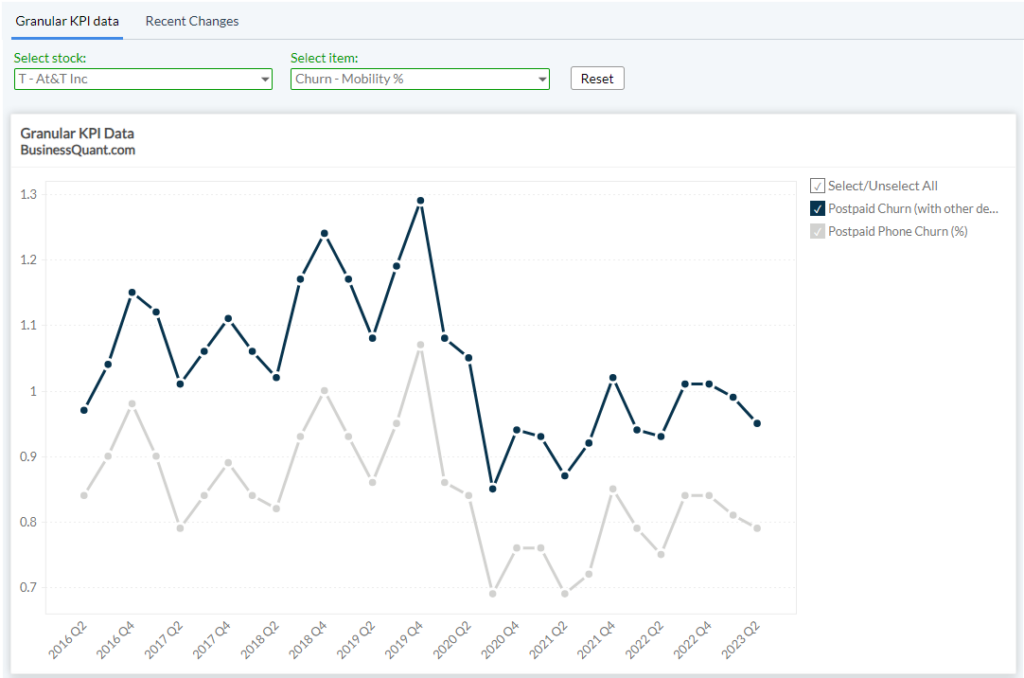
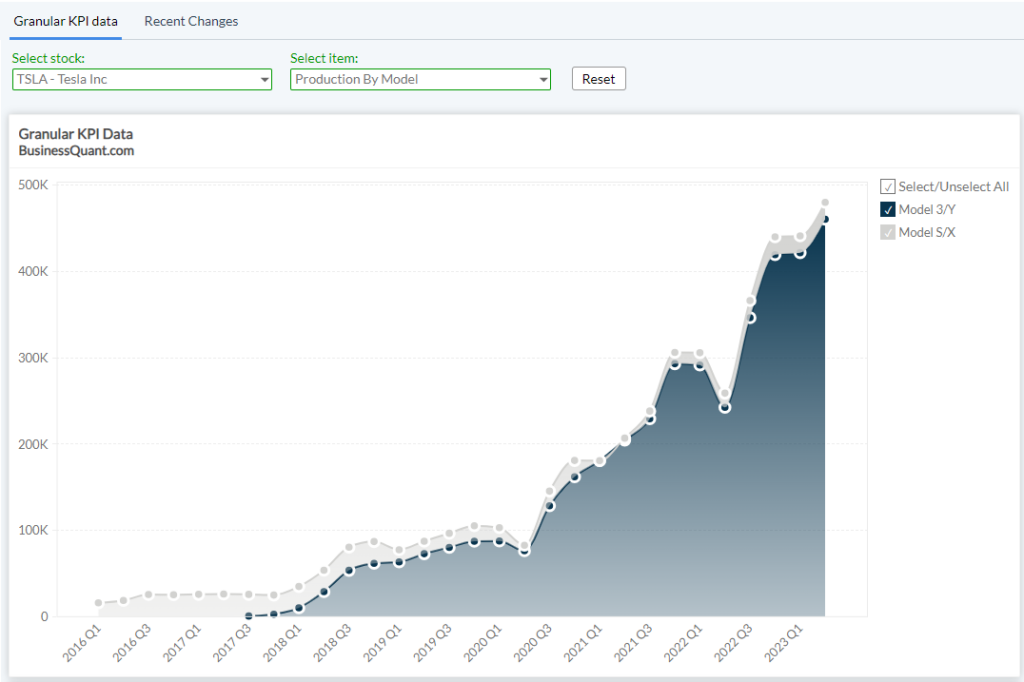
Operating metrics delve deeper into the day-to-day functioning of the company. These can include metrics such as AT&T’s subscriber count, Tesla’s vehicle deliveries, Netflix’s Average Revenue Per User (ARPU), and Facebook’s Monthly Active Users (MAUs).
Operating metrics often serve as leading indicators, giving investors insights into future trends.
Example: A sudden rise in AT&T’s churn rate would indicate that its customers aren’t satisfied with their network and are disconnecting at an elevated rate. Thus, it suggests that AT&T’s revenue could decline in the coming quarters.
Example: Similarly, a decline in Tesla’s vehicle production volume suggests that consumer demand for its vehicles is waning and the company’s revenue could take a hit in the near future.
Operating metrics essentially reveal how efficiently a company operates. High operational costs or longer inventory turnovers might suggest internal inefficiencies, which could impact stock values.
Challenges in Gathering Segment Information and Operating Metrics
Knowledge might be power, but acquiring it isn’t always easy. Herein lie a few challenges:
- Fragmented Information: Companies report segment data across multiple publications — annual descriptions, quarterly releases, investor meets, etc. Manually collecting this data could take several hours per company, and is akin to assembling a jigsaw puzzle without knowing the final picture.
- Consistency in Reporting: There isn’t always a uniform approach. Two companies might categorize their segments differently, making direct comparisons a challenge.
- Time & Effort: For individual investors, time is as valuable as money. Wading through mountains of data to find relevant nuggets isn’t just tedious; it’s time-consuming.
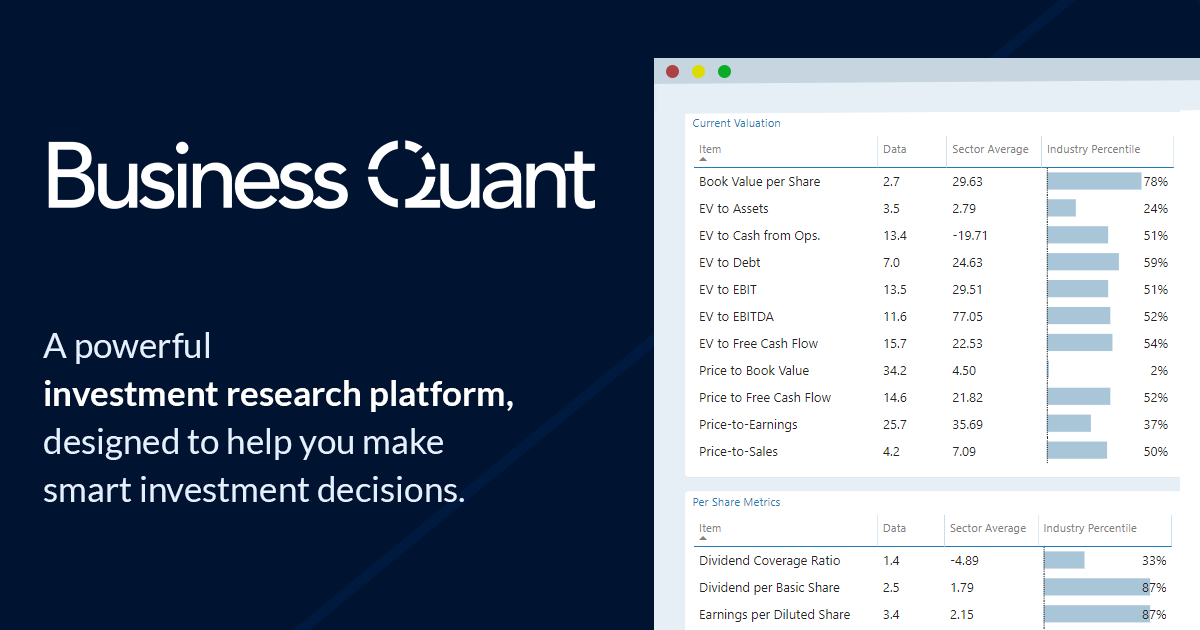
The Solution: Business Quant
This is where Business Quant comes in to save your day.
- Centralized Data Repository: Business Quant provides access to all segment financials for thousands of US stocks at the click of a button. Business Quant makes this possible, eliminating the need to jump between multiple data sources and company documents.
- User-friendly Interface: Instead of dense financial jargon, Business Quant provides its tools an intuitive, accessible manner, catering to both novice and expert investors.
- Time-efficient: With Business Quant, investors can redirect the time saved from data gathering to data analysis, crafting sharper investment strategies.
To summarize, Business Quant is a powerful stock research platform, using which you can get access to:
- Company KPI data and segment financials,
- Industry KPI data,
- Economic data,
- Industry financials,
- Financial statements,
- Stock warnings,
- Stock ratings,
- Stock screener,
- Compare stocks,
- Time series analysis,
- Advanced charting tools,
- Institutional ownership data,
- Insider trading data,
- SEC filings,
- 200+ financial items and ratios,
- Download data in .csv/.xlsx formats
Pricing plans:
- Basic plan is Free
- Pro plan costs $19/month
Who is it ideal for: New and Experienced Investors
The Real-World Scenario
Let’s contextualize with a hypothetical scenario. Joe, an investor, is keen on investing in a renowned e-commerce giant. A cursory glance at the company’s overall profits paints a rosy picture. However, upon analyzing segment financials, Jane realizes that while the company’s North American operations are booming, its European ventures are bleeding money. This granular insight helps Jane make an informed decision, adjusting her investment considering the European market’s potential risks.
Such precise, informed decisions can be the difference between lucrative returns and costly regrets.
Final Thoughts
As the market evolves, staying ahead requires more than just capital—it demands insight, precision, and strategy. Business Quant’s stock research platform is pioneering this shift, ensuring every investor has the data and tools to navigate the stock market’s intricate labyrinths. Consider Business Quant not just as a platform but as a strategic partner, guiding you toward informed, confident, and profitable decisions. The stock market awaits — arm yourself with the best!
Image by mindandi on Freepik


