
Investing in today’s complex financial landscape can be a daunting task. Whether you are a seasoned investor or just starting, finding a one-stop solution that caters to all your investment needs is challenging. The market is flooded with numerous investment research platforms, each offering specialized solutions for different types of investors. This article aims to shed light on the key features, core competencies, and pricing policies of each of the stock analysis websites, to make it easy for investors to pick the right tool.
Best Stock Analysis Websites for 2026
-
- Business Quant
- Ziggma
- Finviz
- Alphaspread
- FAST Graphs
- Gurufocus
- Morningstar
- Simplywall.st
- Koyfin
- Stockopedia
- Stock Rover
- Wallstreetzen
- Yahoo! Finance
- YCharts
Looking at stock analysis websites
-
Business Quant
That’s us! We believe that Business Quant is the go-to investment research platform for serious investors. Business Quant specializes in providing Key Performance Indicator data (or KPI data) on US stocks and industries. This includes financial breakdowns by segment, geography, and product categories. You can also access key operating metrics such as Tesla’s vehicle delivery volume, McDonald’s store openings, AT&T’s subscriber additions, and lots more such metrics on thousands of US stocks.
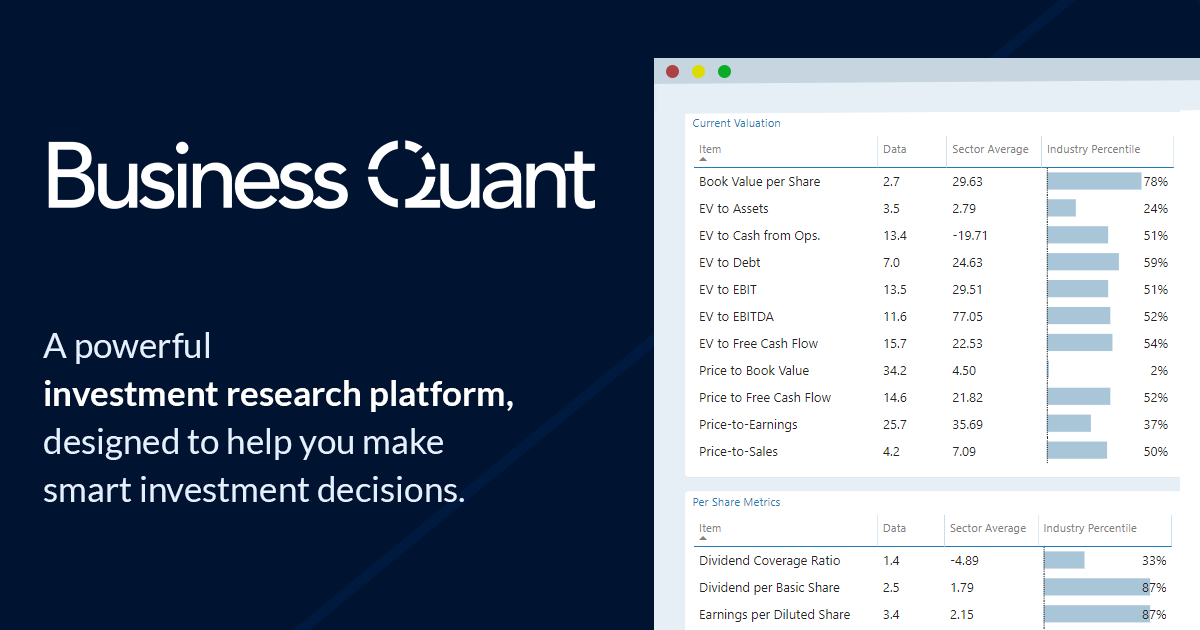
In essence, Business Quant saves countless hours for you — you don’t have to ever go through boring SEC filings and company documents, to extract and maintain key metrics on the companies you follow. Our KPI database is unique and its coverage rivals bigger platforms such as Bloomberg and FactSet that cost upwards of $10,000 a year.
Besides, Business Quant also hosts several other features such as:
- Industry KPI data (eg: market shares ),
- Company KPI data (eg: segment financials and key company metrics),
- Non-GAAP metrics sourced from company presentations and filings,
- Stock screener with 1 million+ filter combinations,
- Industry financials (eg: show capex for all airline stocks),
- AI-generated stock warnings and ratings,
- SEC filings,
- Insider ownership data,
- Institutional ownership data,
- Historic financial statements
- Economic data and indicators
- Timeseries Analysis and Comparison Tables.
- Advanced charting tools (fundamental and technical),
- 200+ financial items and ratios,
- Download data in .csv and .xlsx formats
Pricing Plans:
Although Business Quant’s feature-set to pricey institutional research terminals, its pricing is quite affordable and doesn’t break the bank:
- Basic plan is priced at $0. All the features are accessible in this plan, albeit with limited or delayed data,
- Pro plan is priced at $19/ month. It unlocks all the features available on the platform.
Who is it for: New, Seasoned and Professional Investors
-
Ziggma
Ziggma is another key contender in our list of best stock analysis websites. It was founded recently in 2019 with the mission of providing institutional-grade data to retail investors. The platform specializes in providing advanced investment portfolio management and analysis tools to individual investors and financial advisors alike. They leverage data-driven insights, allow investors to consolidate their holdings in one place, provide a user-friendly interface and they strive to be affordable.
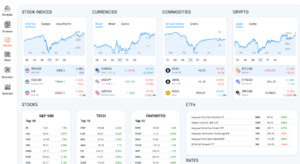
As far as the feature set goes, Ziggma provides features such as:r
- Portfolio dashboard with performance and risk metrics,
- Top 50 Stocks List,
- Stock scores,
- Stock and ETF screener,
- Alert functionality to notify users,
- Portfolio simulator
- Model and Guru portfolios
- Daily portfolio recap
- Portfolio back-testing
However, certain important features (like historic financial statements) are missing as of this writing, making it less suitable for serious investors.
Pricing Plans:
Ziggma has two straightforward pricing plans:
- Monthly plan is priced at $9.90/month
- Annual plan is priced at $89/year
Who is it for: New investors
-
Finviz
Finviz was launched in 2007 and it has, since, grown rapidly to become a popular stock analysis website amongst investors. It offers a range of data and tools, to help users analyze stocks, track market movements, and conduct stock research. Finviz website gained popularity among investors due to its user-friendly interface and its powerful and customizable stock screener, at a time when none existed for free.
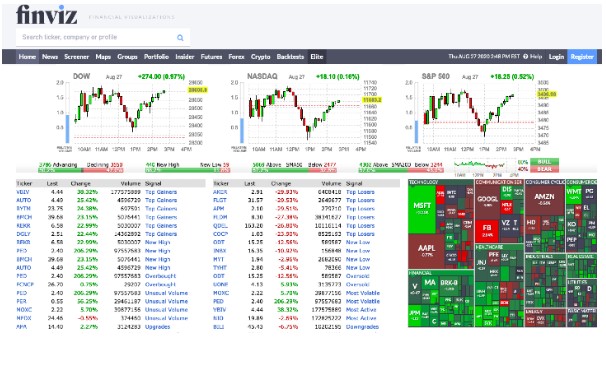
Key features offered by Finviz are:
- Quotes and price charts,
- Stock screener,
- Interactive visuals,
- Heat maps,
- Historic financial statements (3 years),
- Intraday charts,
- Advanced technical charts,
- Backtesting on technical indicators,
- Correlations,
- Screener Presets,
Pricing Plans:
Finviz used to be an ad-supported business but it has rolled paid subscription plan over the years:
- Monthly plan is priced at $39.5/month,
- Annual plan is priced at $299.5/year
Who is it for: New and Seasoned Investors
-
Alphaspread
Alpha Spread was launched fairly recently in 2020. The platform was built by investors, to meet the needs of investors, with the guiding principle of having “skin in the game”.
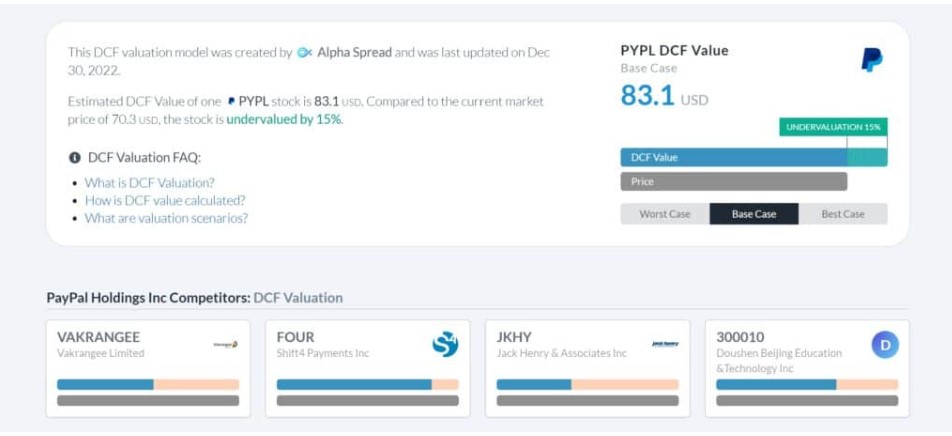
They’ve developed intrinsic valuation tools (DCF valuation and relative valuation) that provides quick valuation scores for thousands of stocks. Like Business Quant, Alpha Spread’s scoring models are also divided into multiple sections: profitability and solvency.
To summarize, Alpha Spread offers the following tools:
- Customizable user watchlist, which notifies users with email alerts,
- Access to pre-built and powerful stock screeners,
- Access to stock lists of various individual companies,
- Valuation tools — DCF value calculator and discount rate calculator,
- Stock scores,
- Earnings call transcripts
Pricing Plans:
Alpha Spread’s pricing is as follows:
- Free Plan allows investor to analyze up to 3 stocks per week,
- Unlimited plan priced at $25 per month,
- Enterprise plan priced at $200 per month.
Who is it for: New Investors
-
FAST Graphs
FAST Graphs was founded in 1992 and it’s one of the oldest stock analysis websites in our list. The term “FAST” Graphs is an acronym for “Fundamental Analyzer Software Tool” which essentially allows users to visualize important company financials and key ratios.
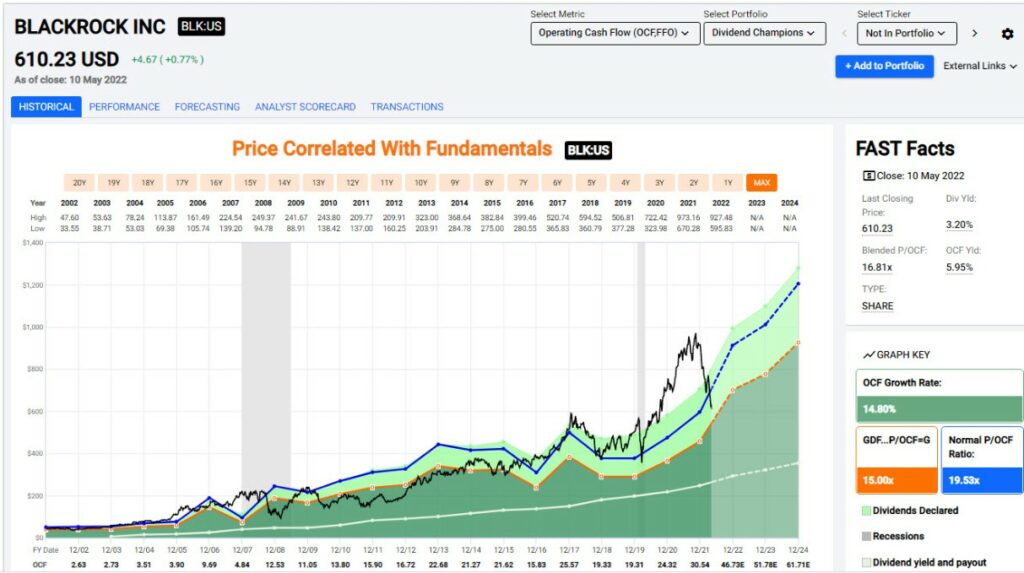
FAST Graphs empower users to research stocks deeper and faster by allowing them to exploit the undeniable relationship and functional correlation between long-term earnings growth and the market price of a company.
The key features offered by FAST Graphs are :
- Fundamental charts,
- Analyst scorecards,
- Portfolio tracking and management,
- Company financials and ratios,
- Stock screeners,
- Analyst forecasts,
These tools seem to be a better fit for income-seeking investors — dividends and REITs.
Pricing Plans:
FAST Graph’s pricing is as follows: categorized as follows :
- Basic plan is priced at $15.95 per month,
- Premium plan is priced at $48 per month,
Who is it for: Dividend and REIT investors
-
Gurufocus
GuruFocus is another popular value-investing stock analysis website that was founded in 2004 by Dr. Charlie Tian. The website was initially built to track trades of renowned institutional investors, also known as Guru’s. As the platform gained traction over the years, its feature set was expanded to meet the needs of a broader investor audience.
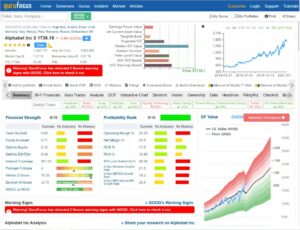
The core philosophy behind GuruFocus is that wealth is created by investing for the long-term and in quality instruments. Accordingly, its feature set is tailor-made to suit the needs of value investors. For instance, they provide detailed breakdowns for a range of financial calculations, ratios and business metrics.
Some of the features offered by Guru Focus are:
- Dynamic fundamental charts,
- Sock screener,
- Historic financial statements dating back 10+ years,
- Institutional ownership data,
- Insider trading data,
- SEC Filings,
- Customizable watchlists,
- Financial news and articles through the News feed,
- Portfolio tracking and management,
- Backtesting of investment strategies
- Excel integration and data export in .xlsx / .csv formats
- Valuation tools including the DCF model
- Stock quotes,
- Economic data
- Dividend data and earnings calendar.
Pricing plans:
GuruFocus offers a myriad of features that are important for value investors. At the same time, the platform isn’t as affordable as some of the other names on this list.
Its pricing is as follows:
- Premium plan costs $449/year
- Premium plus plan costs $1,348/year
- Professional plan costs $2,398/year
Who is it for: Seasoned and Professional Investors
-
Morningstar
Morningstar is another prominent stock analysis website. It was founded in 1984 and is by far the oldest name on our list here. Over the years, Morningstar has grown to become a reputed name in the field of investment research and asset management, with subsidiaries in 32 countries.
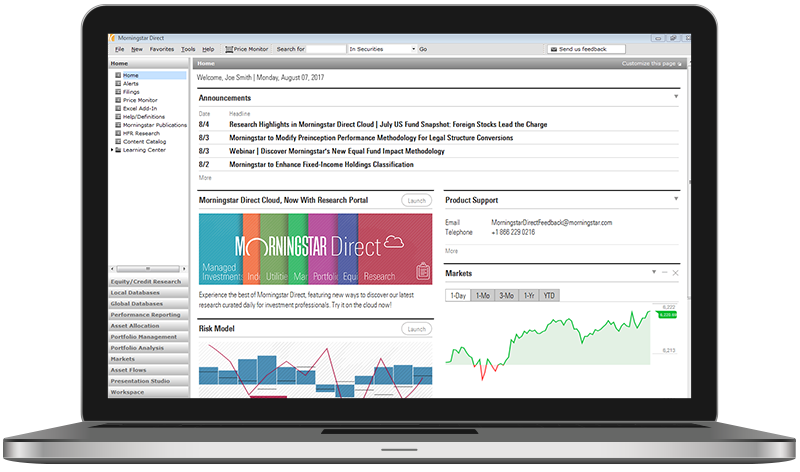
Their focus seems to be geared towards providing portfolio management tools, along with data on Mutual Funds and ETFs.
To summarize, Morningstar offers the following features:
- Research on Mutual funds, ETFs, and Stocks,
- Scoring system for Mutual Funds,
- ESG ratings for companies,
- Historic financial statements (10+ years),
- Fund and stock screener,
- Portfolio tracker and watchlists,
- News feed,
- Institutional and insider ownership data,
- Earnings calendar,
- Enables data export
Morningstar seems packed with features. However, it doesn’t include a range of features advanced charting tools, timeseries analysis, comparison tables, KPI data, and industry financials that Business Quant and other websites offer, making Morningstar more suitable for investors who are starting their investment journey. For seasoned and professional investors, other platforms seem more suited.
Pricing Plans:
Morning star has two pricing plans:
- Annual plan is priced at $249/year,
- Monthly plan costs $34.95/month
Who is it for: New Investors
-
SimplyWall.St
Simply Wall St was launched in 2014 and is based out of Sydney, Australia. The platform simplifies complex financial data, by providing a range of visualizations and charts. It’s not a typical stock analysis website where users can slice and dice the data.
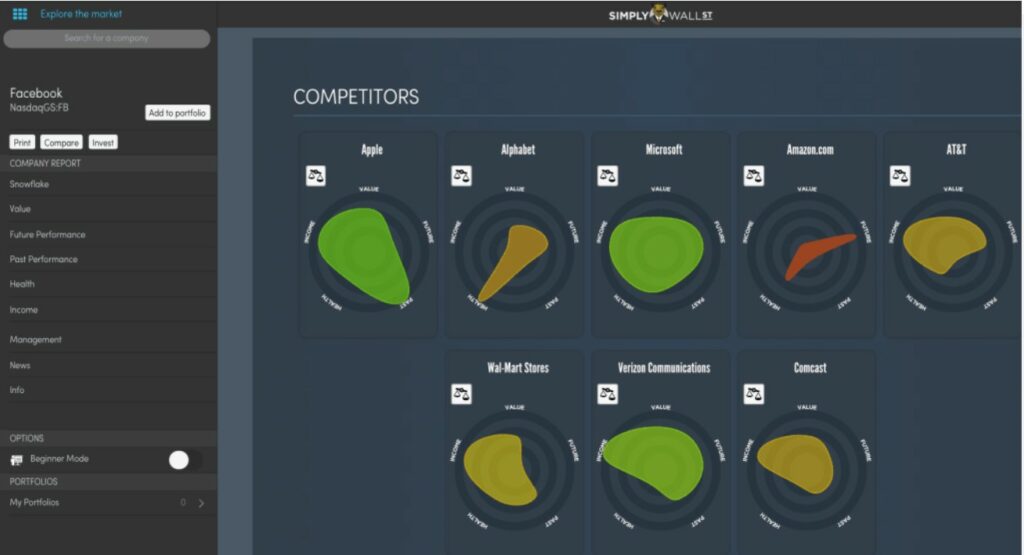
On the contrary, Simply Wall St has preset templated-style reports on thousands of stocks, that provides a range of automated insights and fundamental data. This allows investors to quickly screen and analyze companies from the top level but it may not be suitable for investors that want to analyze companies at a deeper level.
Simply Wall St’s feature set includes:
- Visual and intuitive charts
- Portfolio tracking,
- Financial and risk analysis tools,
- Stock screener,
- Personalized watchlists and alerts,
- Earning calendar,
- Institutional and insider ownership data.
Pricing plans:
Simply Wall St has three pricing plans, as follows:
- Free plan grants access to limited features,
- Premium plan is priced at $10/month,
- Unlimited plan is priced at $20 per month,
Who is it for: Students and new investors
-
Koyfin
Koyfin is another powerful stock analysis website. It was founded by Rob Koyfman in 2016 and is headquartered in New York. They aim to revolutionize the stock research industry by giving investors access to live market data and powerful analytical tools.
Koyfin’s diverse feature set primarily caters to individual investors, traders, and finance professionals, although its pricing is higher than the other platforms on this list.
Some of the key features offered by Koyfin are:
- Advanced charting,
- Historic financial statements (10+ years),
- SEC filings,
- Earnings call transcripts,
- Stock screener,
- Customizable market dashboards and watchlists,
- Newsfeed,
- Portfolio tracker,
- Economic data
- Institutional and insider ownership data,
- Analyst forecasts,
- Data export
Pricing plans:
Koyfin has four subscription plans, as follows:
- Free plan is available with limited features,
- Basic plan is priced at $25/month, but it doesn’t allow data export,
- Plus plan is priced at $45/month and it unlocks data exports,
- Pro plan is priced at $70/month,
Who is it for: Seasoned and Professional Investors
-
Stockopedia
Stockopedia is another key stock analysis website that has become popular amongst investing circles. It was launched in 2008 and is headquartered in Oxford, UK. Like Business Quant, Stockopedia also simplifies stock-picking with its interactive charts, stock-scoring models, and a diverse range of features.
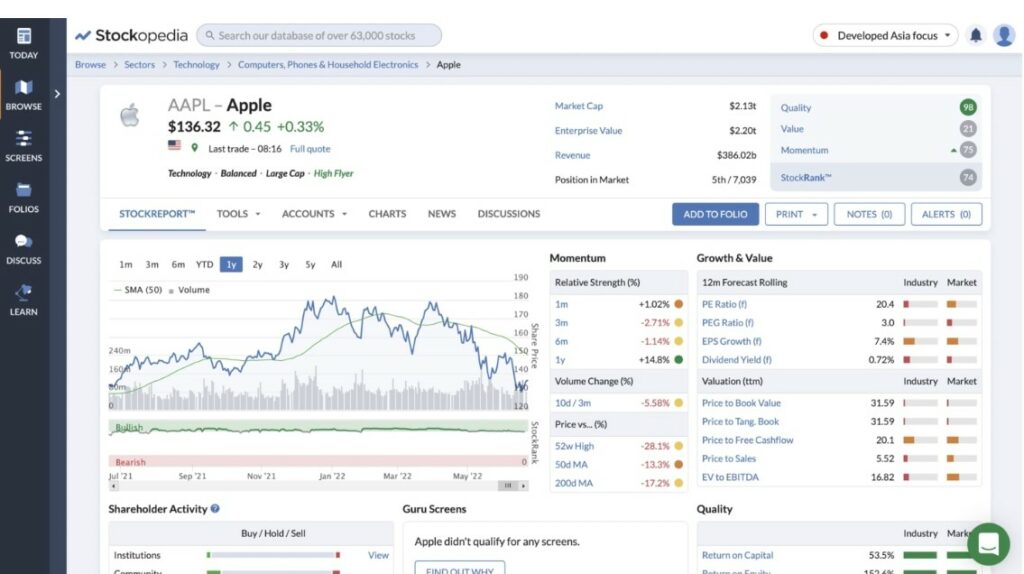
Besides, Stockopedia offers users various tools and data that are required for global investing. Its coverage has grown rapidly from 2,000 UK stocks in 2012 to over 40,000 global stocks now, spanning all continents.
Here’s a list of features that Stockopedia offers to its subscribers:
- Stock screener,
- Stock scores,
- Guru screens,
- Historic financial statements (10+ years)
- Advanced charting tools,
- Portfolio tracking and watchlist,
- DCF valuation models,
- Enables Sectoral analysis
- Email alerts,
- News feed,
- SEC filings,
- Discussion forum for investors,
- Risk assessment and strategy backtesting tools,
- Pre-built model portfolios,
- International market data,
- Insider and institutional ownership data,
- Earnings calendar,
Pricing plans:
Stockopedia has region-specific pricing, as follows:
- Data on US market costs $50/month,
- Data on UK market costs $35/month,
- Data on Indian market costs $30/month,
- Data on Canadian market costs $40/month,
- Data on European market costs $70/month,
- Data on Developed Asian markets costs $70/month
Who is it ideal for: Seasoned investors
-
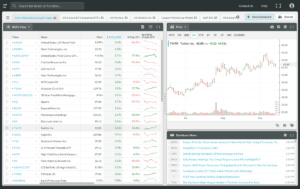
Stock Rover
Stock Rover is another strong contender in our list of best stock analysis websites for professional-level equity research capabilities. It was launched in 2008 by two software engineers to ease investment analysis and is headquartered in Massachusetts, US.
![]()
Stock Rover provides over 650 financial metrics and detailed financial data for over 40,000 stocks. Besides, users can also subscribe to the add-on package that unlocks access to research reports. All in all, Stock Rover offers a clean user interface for power users looking to deep dive into their stocks.
Stock Rover’s feature set includes:
- Stock screener,
- Portfolio management tools and custom watchlists,
- Advanced charting tools,
- Historic financial statements (10+ years)
- News feed,
- Enables easy data integration and export
- Email alerts,
- ETF and Mutual Fund data,
- Earnings and dividend calendars,
- Economic indicators,
- Backtest investment strategies
Pricing plans:
Stock Rover has three pricing plans.
- Essentials plan is priced at $7.99/month but it doesn’t allow data downloads,
- Premium plan is priced at $17.99/month,
- Premium Plus plan is priced at $27.99/month
Who is it for: Seasoned investors
-
Yahoo! Finance
Yahoo! Finance is perhaps the most popular name on our list here. It was founded in 1997 but it has, since then, grown to become one of the biggest platforms that provides timely business, economic and financial news.
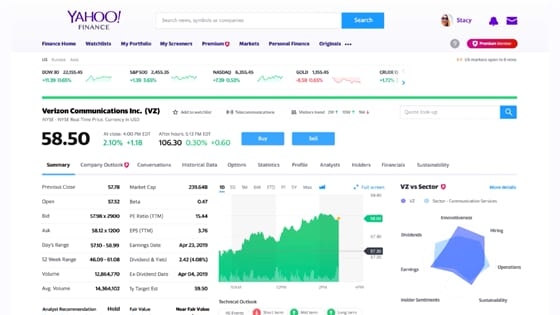
Yahoo! Finance’s core competency lies in its ability to aggregate financial data, stock quotes, key metrics, and related news. However, it doesn’t offer powerful analytical tools like Time-series Analysis, Comparison Tables, and KPI Data that Business Quant has.
Regardless, Yahoo! Finance is a useful platform and it includes features such as:
- Latest stock quotes and interactive charts for global markets,
- Historic financial statements (10+ years)
- Personalized watchlists,
- Stock screener,
- Compny profiles,
- Insider and institutional ownership data,
- News feed,
- Portfolio tracking tools,
- Earnings and dividend calendar,
Pricing plans:
Yahoo Finance provides a free ad-supported version that allows users to access most of the basic features including stock quotes, interactive charts, news articles and watchlists.
However, to access historic financials, research reports, advanced portfolio tools, Yahoo Finance has paid subscription plans as follows:
- Yahoo Finance Plus Lite is priced at $24.99/month,
- Yahoo Finance Plus Essential is priced at $34.99/month
Who is it for: Investors starting on their investment journey
-
YCharts
YCharts was founded in 2009 and it’s based out of Illinois, US. Over the years, YCharts has become a prominent stock analysis website amongst institutional and professional investors. It was acquired in 2020 and is by far, the most comprehensive stock analysis website on our list. At the same time, YCharts is also pricier than all the other websites that we’re listing here today.
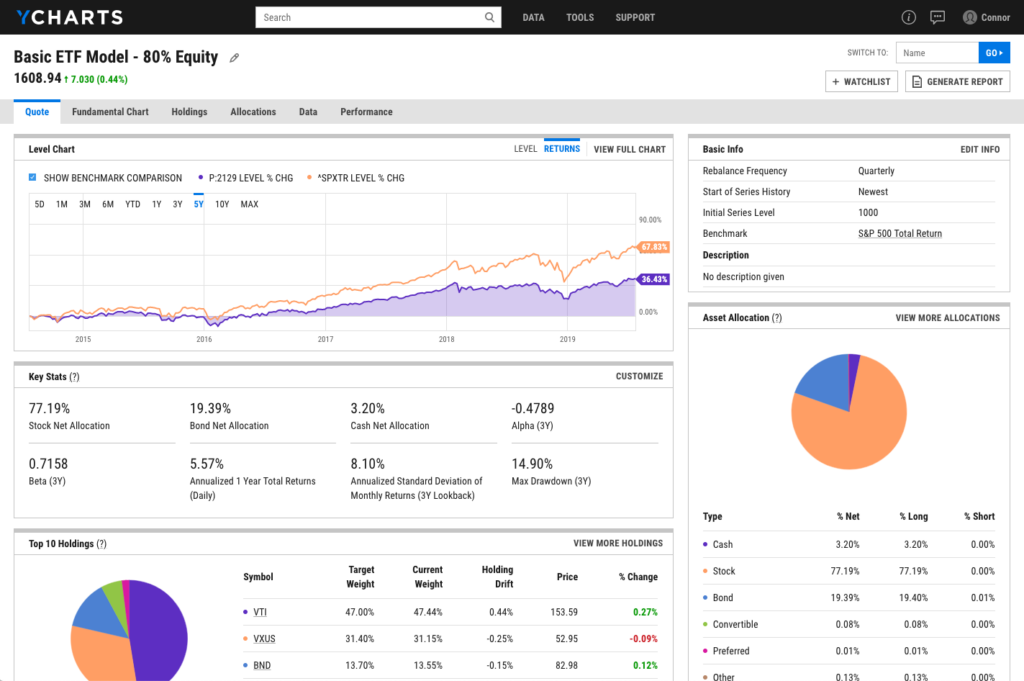
To put things in perspective, YCharts is catering to a client base of more than 5,000 registered investment advisors, financial planners, asset managers, enterprises, individuals, and educators who, collectively oversee more than $750 billion in assets.
The core competency of this modern investment research platform lies in providing a user-friendly platform for security research, portfolio construction, idea generation, and market monitoring, albeit at higher price points.
Like Business Quant, YCharts offers a plethora of features, such as:
- Advanced charting tools
- Historic financial statements (10+ years)
- 4000+ financial metrics,
- Risk analysis tools,
- Document annotation and note-taking capabilities,
- Collaborative functionality that allows users to share documents and insights with others,
- Stock quotes,
- User alerts,
- News feed,
- SEC filings,
- Stock screener,
- Portfolio tracking,
- Economic data,
- Excel integration and data exports,
- Customizable dashboards,
- Advanced analytics for Equity, Mutual funds and ETF
Pricing plans:
Ycharts does not offer a free plan and its pricing plans are as follows:
- Standard is priced at $3,600/year,
- Professional is priced at $7,200/year,
- Enterprise has custom pricing and users can directly contact YCharts for their requirements.
Who is it ideal for: Finance professionals
- WallStreetZen
WallStreetZen was launched in 2020 and is based out of Hong Kong, China. Its feature list is fairly limited when we compare it to other stock analysis websites on our list. However, they strive to compete with an easy user interface and simple automated insights. WallStreetZen itself claims that their platform suitable for “serious part-time investors”.
As a result, WallStreetZen seems like a direct alternative for Simply Wall St but not for more comprehensive analysis websites like YCharts, Koyfin, or Business Quant.
Regardless, WallStreetZen’s list of features includes:
- Quotes for stock prices, indices, commodities, and currencies,
- News feed,
- Portfolio tracking and watchlist,
- SEC filings,
- Email alerts,
- Analyst estimates,
Pricing plans:
WallStreetZen has two pricing plans:
- Free plan is available but it’s restricted to certain features.
- Premium plan is priced at $19/month
Who is it ideal for: Students and investors who are just starting out
And that wraps up our list of best stock analysis websites for this year.
Conclusion
As we saw in this article that different stock analysis websites offer different sets of features. There is no one-size-fits-all solution on a budget. It’s up to you to decide which functionality you’d like to have and then go with that stock analysis website. For instance, Business Quant happens to be the most comprehensive stock analysis website that provides company KPI data, industry KPI data and a wide range of other stock research tools at just $19/month. So, I encourage you to check out Business Quant. But other than that, I hope you found this article useful.
Happy Investing!
(Image credits: Image by pressfoto / Freepik)


