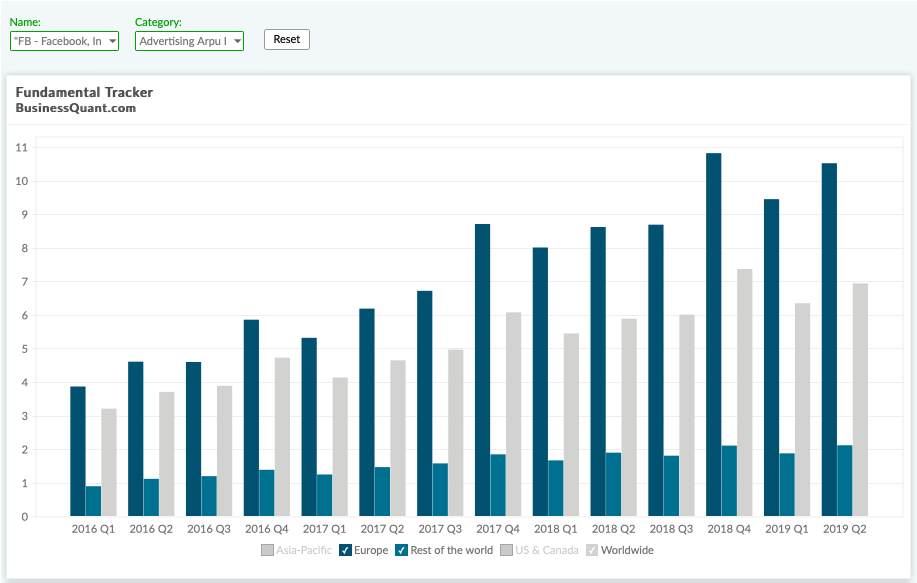
Advertising ARPU by Region
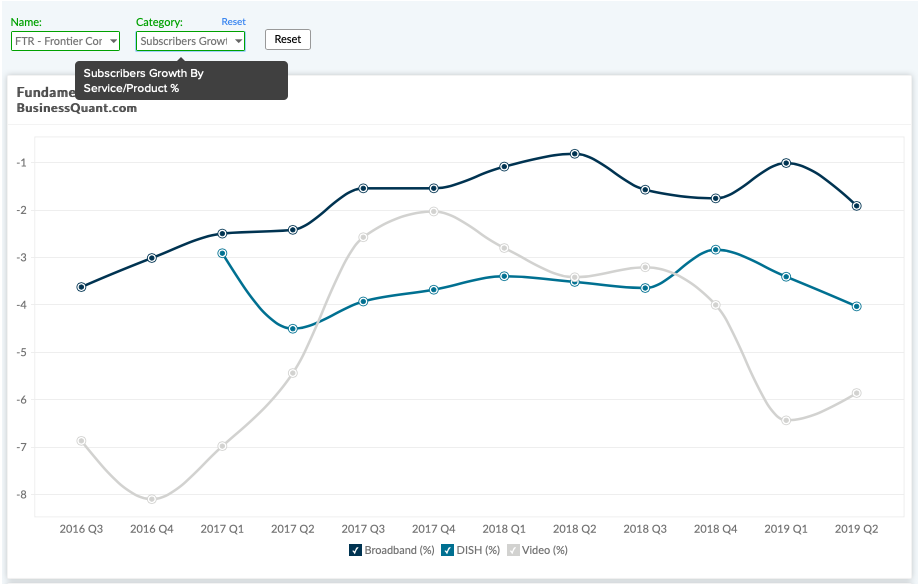
Frontier Communications
Subscriber Growth by Service/Product (YoY %)
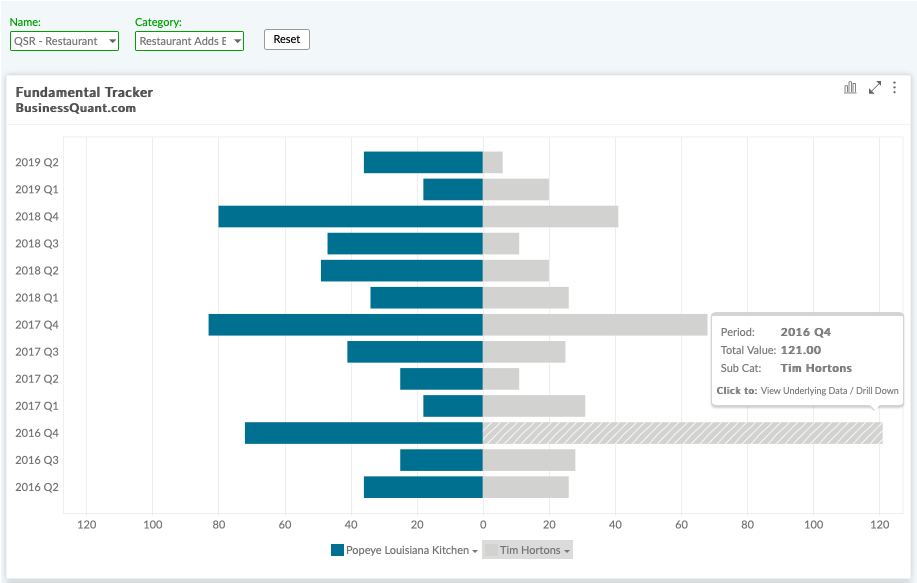
Restaurant Brands International
Restaurant Adds by Brand.
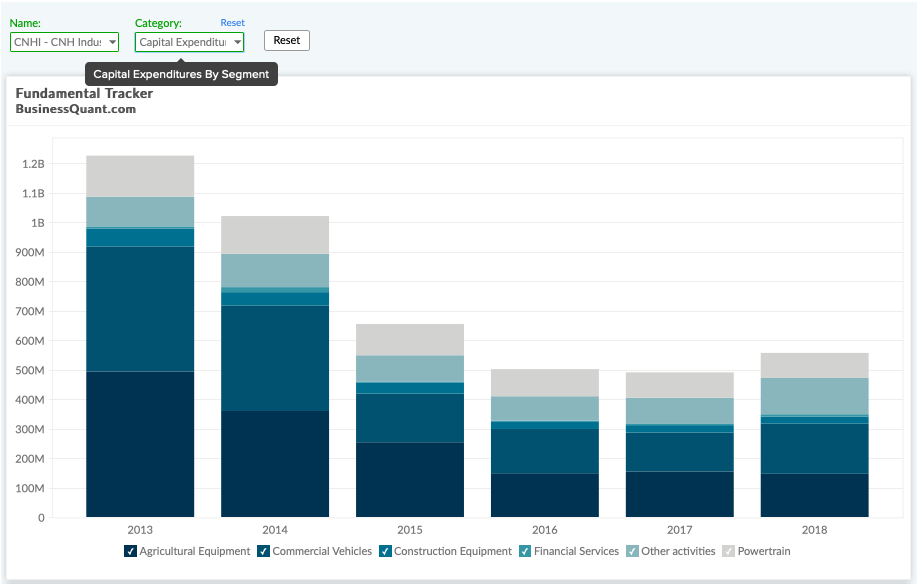
CNH Industries
Capital Expenditure by Segment
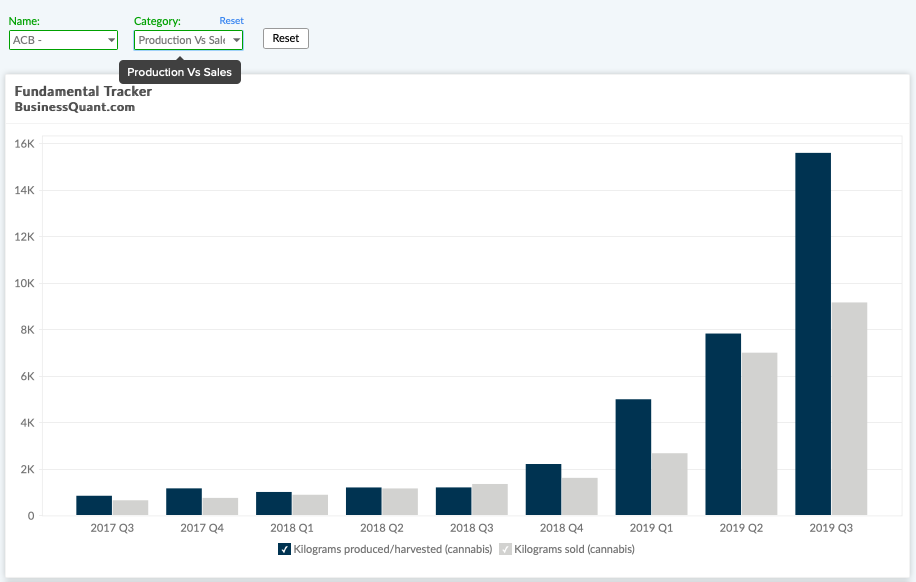
Aurora Cannabis
Cannabis Production (kg) vs Sales (kg)