
When it comes to investing in stocks, it’s important to have sufficient data to conduct thorough analysis on public companies. Although there are several websites that provide a plethora of financial data and countless analytical tools, there isn’t a one-stop destination to cater to all investors. But we have you covered. Here’s an in-depth comparison encompassing 13 websites for research and stock analysis, broken down according to their key features and pricing plans. So sit back, read along and find your best fit.
13 Best Stock Research Websites for 2026:
- Business Quant
- Finbox
- Gurufocus
- Koyfin
- Morningstar
- Simply Wall Street
- Stockopedia
- Stockrover
- Wall Street Zen
- Yahoo! Finance Plus
- YCharts
- Atom Finance
- Whale Wisdom
Looking at Stock Research and Analysis Websites
-
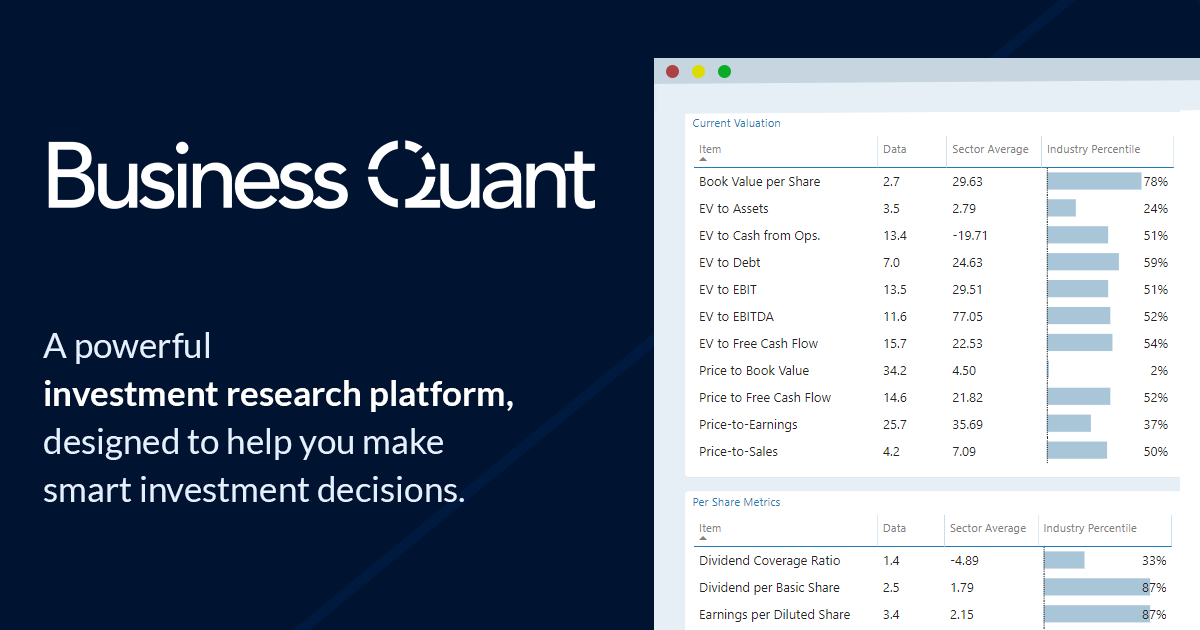
Business Quant
Business Quant is topping the charts with its unique feature — Key Performance Indicator (KPIs) data. This tool provides you with financials segregated based on Segments, Regions and/or Product Categories. Besides, you can also access non-GAAP operating metrics, such as Tesla’s production volume by model, Netflix’s subscriber count, AT&T’s churn rate, and other such metrics for thousands of US stocks.
There’s also the Industry KPI tool, where you can select industries and access items such as market share, shipments by vendor and even sort companies based on their industries KPIs (example: sort restaurants based on their store openings last quarter). These tools are usually found in high-end research terminals that cost several thousand dollars, but Business Quant’s is priced at just $19/month.
Business Quant has one of the most comprehensive set of features, some of which include:
- Company KPI data
- Industry KPI data
- Economic data
- Sector and Industry financials
- Financial statements dating 10+ years
- 200+ financial items and ratios
- Stock warnings and reports
- Stock ratings
- Stock screener
- Compare stocks
- SEC filings
- Charting functionality
- Technical analysis tools
- Institutional ownership data
- Download data in .csv/.xlsx formats
Who is it for: Individual investors and investment professionals
Pricing: Plans start from $19/month
- Finbox
Finbox was established back in 2014. Although it does not offer KPI or economic data, it provides financial data for 6 major global markets and has a broad range of tools to help with financial modelling and stock screening. It also has a “Top Ideas” section where users can view portfolios of renowned and legendary investors such as Warren Buffet. The platform also has education videos which can be useful for investors who are just starting out. They used to have an Excel plugin but it was discontinued sometime in 2021.
Some of its features are:
- Charting tools
- SEC filings
- Stock screener
- Portfolio tracker
- Watchlists
- News Feed
- Financial modeling tools
- Financial data on 6 major markets
- Analyst forecasts
- Backtest investment strategies
Pricing :
- Starter Plan – $10/ month
- Executive Plan – $25/month
- Professional – $66/month
Who is it for: Seasoned investors and investment professionals
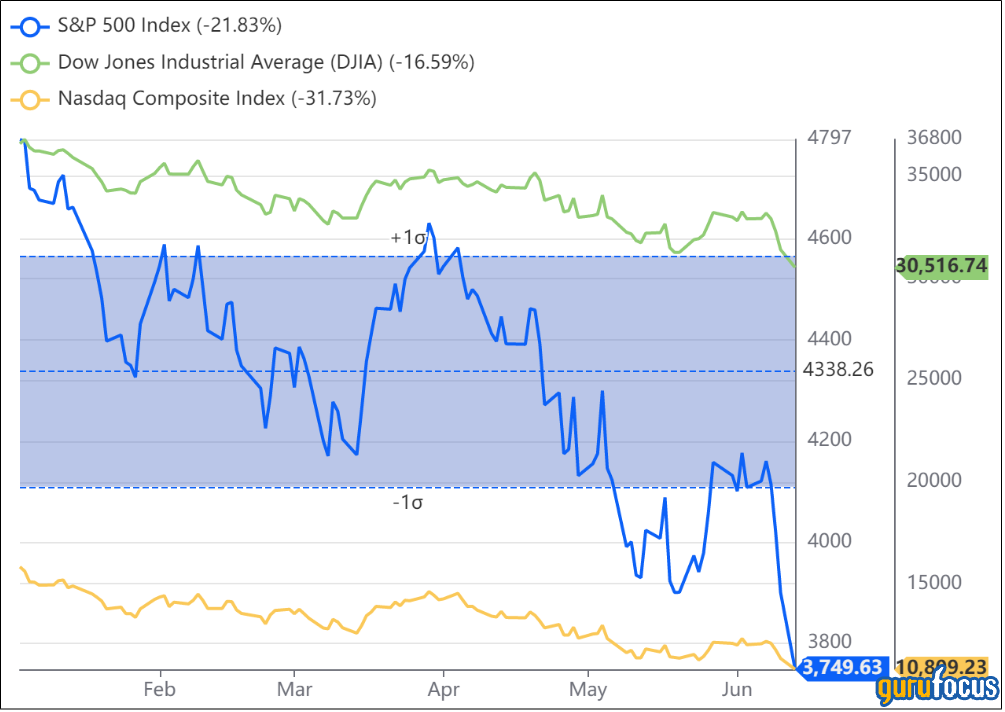
- Gurufocus
Gurufocus was established in 2004 and has developed quite a lot over the years. They started by offering the functionality to track portfolios of renowned investmentors and fund managers (or Gurus) and now also offer market news, research, member discussion boards and a myriad of tools for researching stocks. Users can ask questions and share ideas in their investing forums. They have an extensive library of how-to videos, encompass expert portfolio features, offer analytical tools such as a DCF calculator.
The basic Gurufocus subscription is priced at $499 annually and it covers data on US markets. Its higher-end plans include data on international markets but that cost as much as $2,398 annually.
- Charting
- Financial statements
- SEC filings
- Warning signs
- Stock screener
- Portfolio tracker
- Watchlist
- DCF calculator
- News feed
- Financial modeling
- Backtest investment strategies
- Excel add-in
- 10+ Yrs. financial data
- Economic data
- Analyst forecasts
Pricing:
- Premium plan – $499/year
- Premium Plus plan – $1,348/year
- Professional plan – $2,398/year
Who is it for: Investors and investment professionals
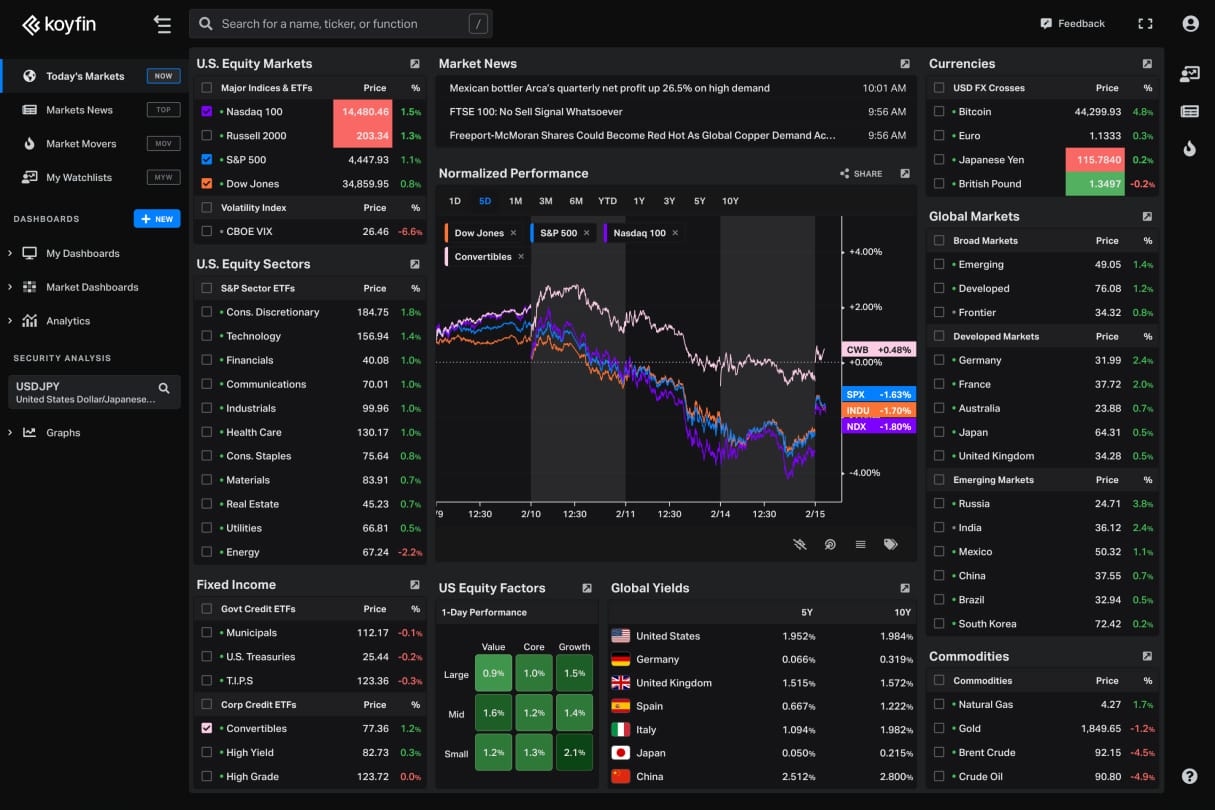
- Koyfin
Koyfin was established in 2016 by two former Wall Street executives who wanted to introduce professional tools at price points that individuals can afford. They completely rebuilt the charting and dashboard tools, to provide the experience of a dedicated research terminal, on the web.
Some of Koyfin’s notable features are:
- Charting tools
- Financial statements
- SEC filings
- Stock screener
- Portfolio tracker
- Watchlist
- News feed
- International stocks
- Economic data
- Forex data
- Analyst forecasts
- Transcripts
Pricing:
- Basic plan costs $15/month
- Plus plan costs $35/month
- Pro plan costs $70/month
Who is it for: Investors and investment professionals
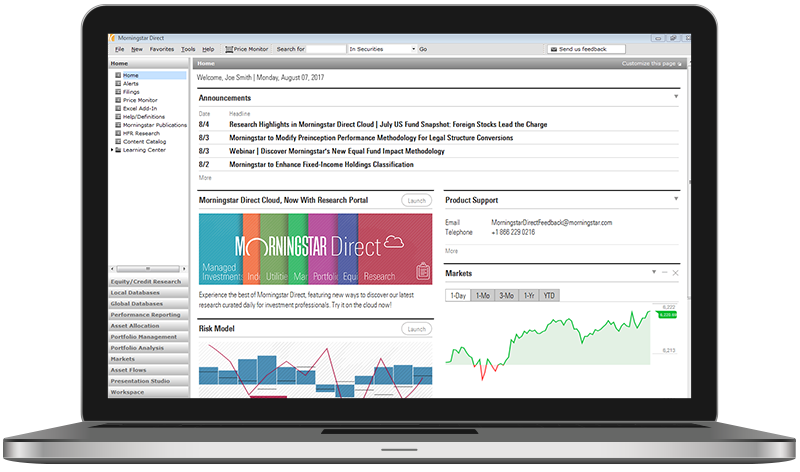
- Morningstar
Morningstar has been providing an array of financial services since 1984. It provides data, news and analytical tools for mutual funds, bonds, ETFs, equities and personal finance. The platform doesn’t offer flexible charting and stock comparison tools, but its tools are well-suited for conducting broad fundamental and value research. For instance, the platform has a Portfolio X-Ray feature which highlights an investors’ exposure to different stocks, whether that’s in the form of direct stock ownership or indirect exposure through mutual fund ownership.
Some of Morningstar’s notable features include:
- Financial statements
- Stock ratings and reports
- Stock screener
- Portfolio tracker
- Watchlist
- News Feed
- Insider and institutional ownership
- Bond, ETF and Mutual funds data
Pricing: Premium plan costs $35/month
Who is it for: Investors
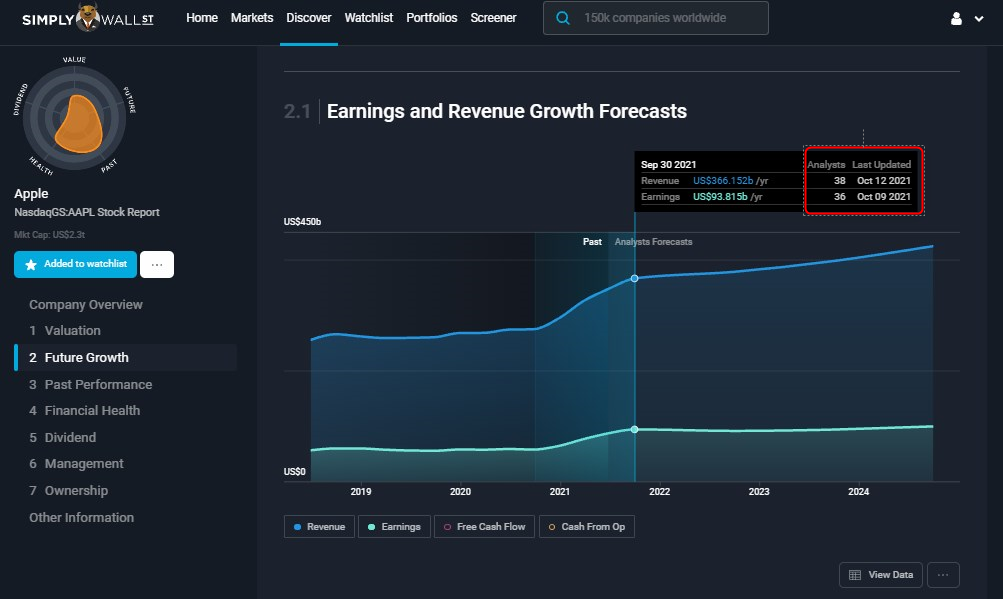
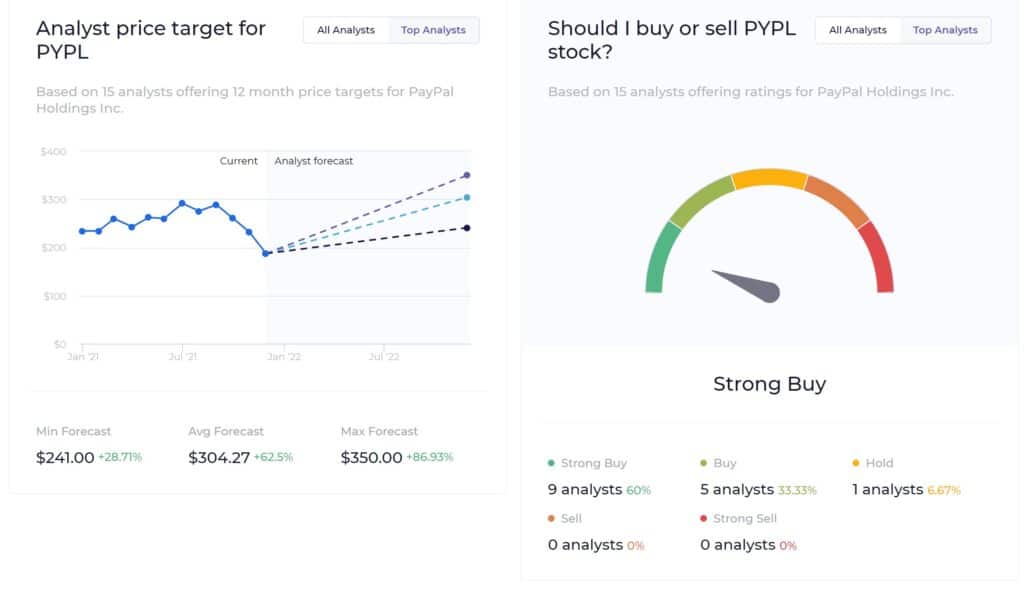
- Simply Wall St.
Simply Wall Street uses infographics to provide system-generated assessments for any selected stock. As a user scrolls down, they’re walked through different kinds of assessments and key highlights pertaining to any selected stock. This is quite helpful for anyone who’s just starting out with analyzing a new company.
Some of its notable features are:
- Stock reports
- Stock screener
- Portfolio tracker
- Watchlist
- News feed
- International stocks
- Insider and institutional ownership data
- Analyst forecasts
Pricing:
- Premium plan costs $15/month
- Unlimited plan costs $30/month
Who is it for: Investors
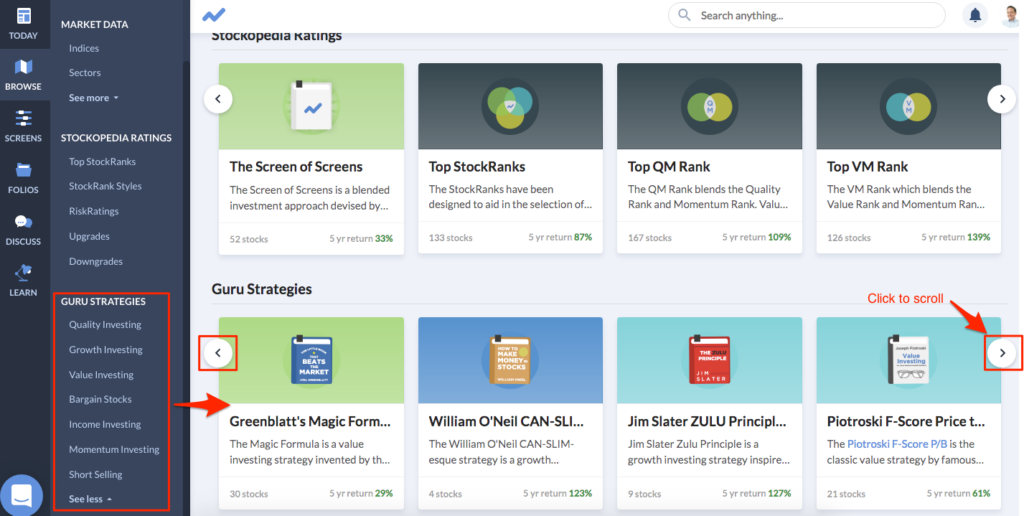
- Stockopedia
Stockopedia was introduced in 2012 and it claims to have catered to more than 10,000 Do-It-Yourself (or DIY) investors. It offers a several research tools — such as Stock Reports, Stock Ranks, Risk Ratings, Stock Screener, Charting tools and Portfolio building — to aid smarter investment decisions. Subscribers can also review their portfolio diversification across countries, sectors and investment styles. The Basic subscription plan is priced at $50 monthly and its top-tier plan is priced at $155 per month.
Some of Stockopedia’s notable features include:
- Charting
- Financial statements
- Stock ratings
- Stock reports
- Stock screener
- Portfolio tracker
- Watchlist
- News feed
- International data
- Analyst forecasts
Pricing:
- Basic plan costs $50/month
- Highest-tier costs $155/month
Who is it for: Investors and investment professionals
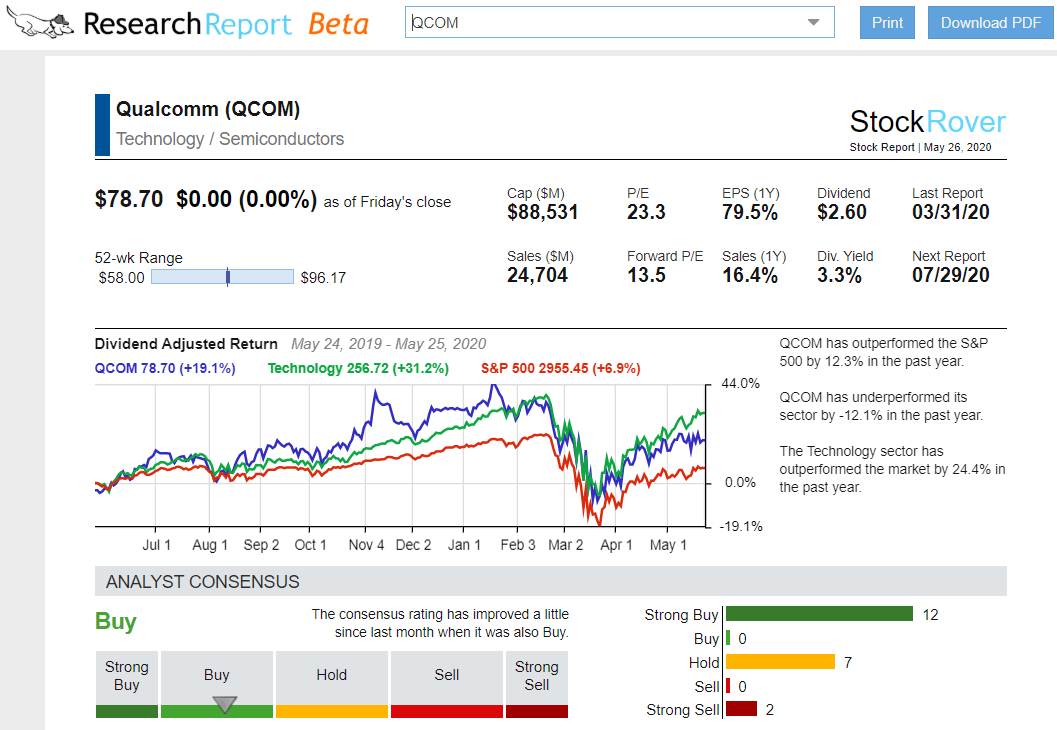
- Stock Rover
Stock Rover was founded in 2008 with the goal of streamlining and enhancing how investors conduct research, make decisions, and monitor investments. The platform allows investors to create and update watchlists, compare stocks and ETFs, has system-generated stock reports and stock charting functionality. Besides, the platform also has real-time notifications, company ratings, earnings calendars, brokerage connections, and much more. The platform is trying to provide the experience of a research terminal, in a web browser.
Some of its notable features include:
- Charting tools
- Compare stocks and ETFs
- Financial statements
- SEC filings
- Stock ratings
- Stock reports
- Stock screener
- Portfolio tracker
- Watchlist
- News feed
- Analyst forecasts
- Stock, ETF and mutual funds data
- Earnings & dividend calendar
Pricing:
- Essential plan costs $7.99/month with limited data
- Premium plan costs $17.99/month
- Premium plus plan costs $27.99/month
Who is it for: Investors and investment professionals
- Wall Street Zen
Wall Street Zen makes use of automated stock research and data visualizations. The platform has a stock screener as well as a Stock Ideas section that enlists system-generated insights for any selected stock. Besides, the platform also has a system-generated DCF model that automatically creates spreadsheets to give the investor a brief summary about the implied valuation.
Some of its notable features include:
- Stock reports
- Stock screener
- Watchlist
- News feed
- Insider and institutional ownership
Pricing: Subscription costs $19/month
Who is it for: Investors
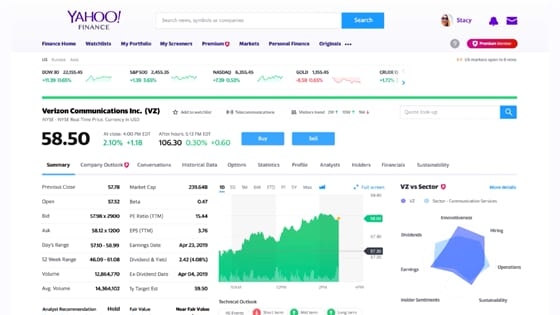
- Yahoo! Finance Plus
Yahoo! Finance has been providing financial news and commentary for listed stocks since 1997. In recent years, Yahoo! Finance has also ventured into providing a “Plus” membership, which basically offers financial data and analytical tools to aid stock research and analysis. In addition to providing financial statements for listed stocks, this membership offers data pertaining to options, mutual funds and ETFs.
Some of the notable features in Yahoo! Finance Plus are as follows:
- Charting tools
- Financial statements
- Portfolio tracker
- Watchlist
- News feed
- Insider and institutional ownership data
- Analyst forecasts
- Earnings and dividend calendar
Pricing:
- Lite plan costs $250/year,
- Essential plan costs $350/year.
Who is it for: Investors.
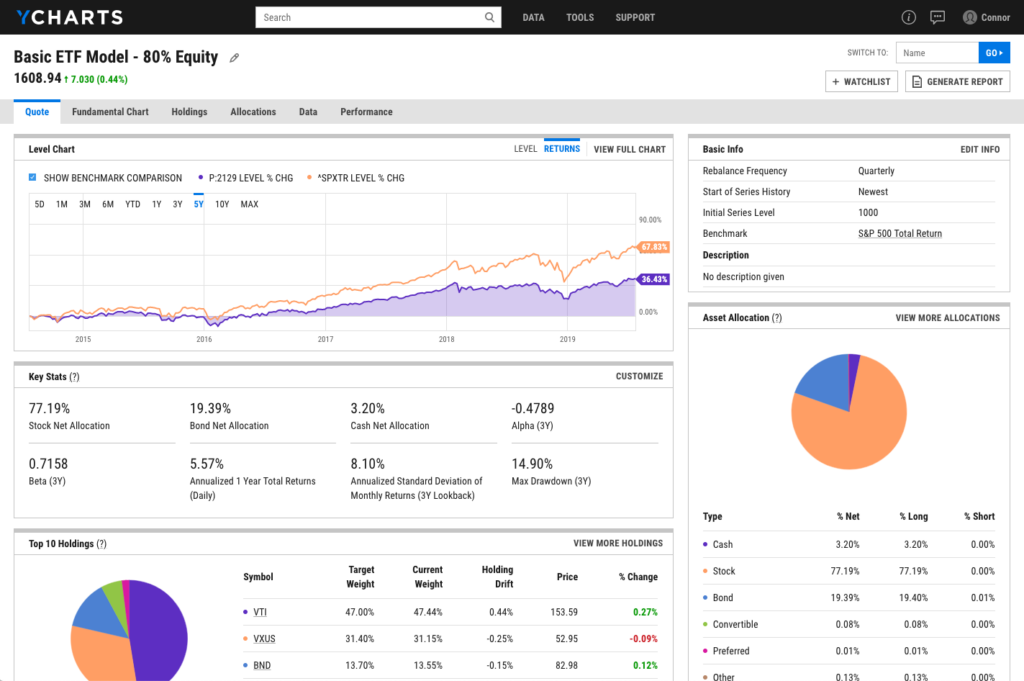
- YCharts
YCharts is a comprehensive, but perhaps the most expensive, stock research website of all the mentioned names here. It includes model portfolios, time series analysis, scoring models, sector and industry data, Excel plugin, stock screener, live news, analyst estimates and recommendations. Some of these features are extremely useful for teams of investment professionals, who want to iterate and go over each other’s financial models. But all these features come at a price — YCharts pricing plans start from $2150 per year.
To summarize, some of it feature highlights are as follows:
- Charting tools
- Financial statements
- SEC filings
- Stock screener
- Portfolio tracker
- Watchlist
- News feed
- Financial modelling
- Back test investment strategies
- Excel add-in
- Economic Data
- Insider and institutional ownership
- Analyst forecasts
- Mutual funds data
- Earnings calendar
Pricing:Plans start from $2,150/year.
Who is it for: Sophisticated investors and investment professionals.
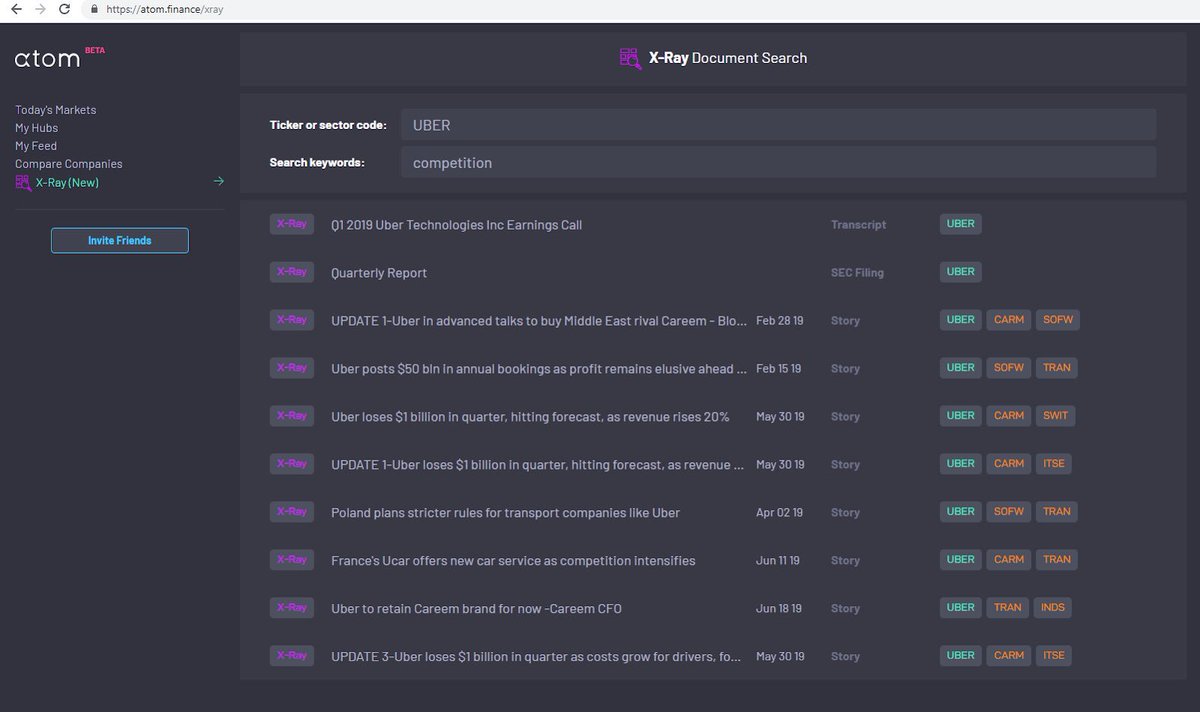
- Atom Finance
Atom has received close to $50 million in funding from prestigious venture capital firms and angel investors. It provides institutional-grade investment data and investing resources to individual investors. The platform seems useful for track portfolio holdings on smartphone devices, creating watchlists, to track stock-specific news, events and documents. It’s not as comprehensive as some of the other names mentioned in our curated list of stock analysis websites, but does a good job at providing an overview about the covered stocks.
Some of Atom Finance’s features are:
- Charting tools,
- Peer comparison,
- Financial statements,
- SEC Filings,
- Stock screener,
- Portfolio tracker,
- Watchlist,
- News feed,
- Insider and institutional ownership data,
- Analyst forecasts.
Pricing: Starts at $6.99/month.
Who is it for: Individual investors.
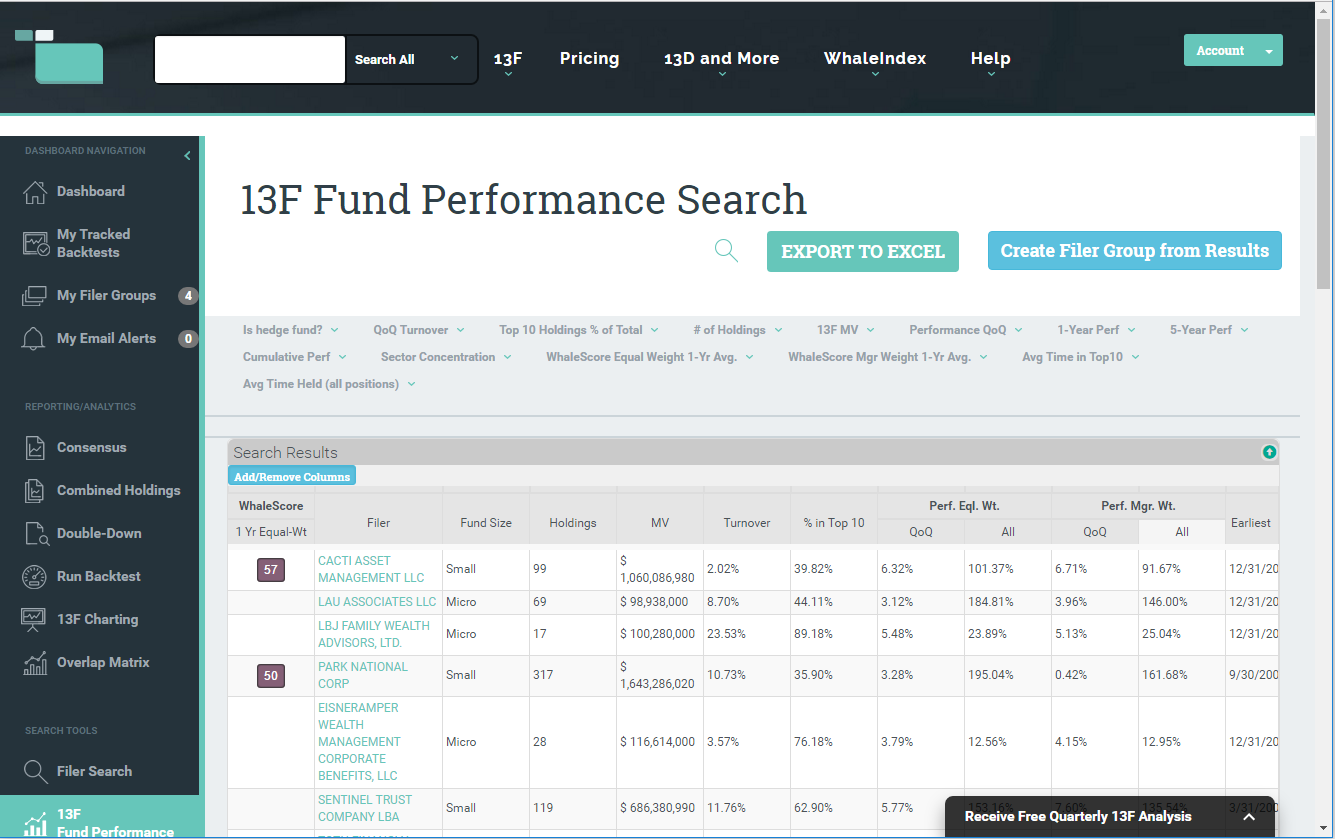
- Whale Wisdom
Whale Wisdom is centered around institutional ownership data. It parses 13F and 13G/D filings, just like Business Quant, and then presents the data in the form of interactive dashboards. The Whale Index is a unique feature representing the most popular domestic holdings of top-performing managers. It also provides a back testing engine and various other tools for investors to find funds that are worth duplicating. The platform focuses on institutional ownership data, so readers keen to track these data releases, might find Whale Wisdom useful.
Some of Whale Wisdom’s features include:
- SEC filings,
- Watchlist,
- Back testing,
- Excel add-in,
- Insider and Institutional ownership data
Pricing:
- Standard plan costs $300/year,
- Pro plan costs $500/year.
Who is it for: Individual investors.
Making the Right Choice
As you might have noticed by now, several stock analysis websites exist to serve different purposes and there isn’t a one-size-fits-all solution. We recommend that you first narrow down on the specific features that you’re looking for, and then zero in on the platform of your choice. If it helps, Business Quant has slashed its prices by 60% for the next two weeks, so you might want to take advantage of this massive discount. Good Luck!
(Image credits : Our-team at Freepik.com)


