Comprehensive coverage on 25+ industries to help you refine your investment ideas. Spot industry trends, separate leaders from laggards, track relative performance of industry peers, and rank companies based on key performance indicators (KPI data).
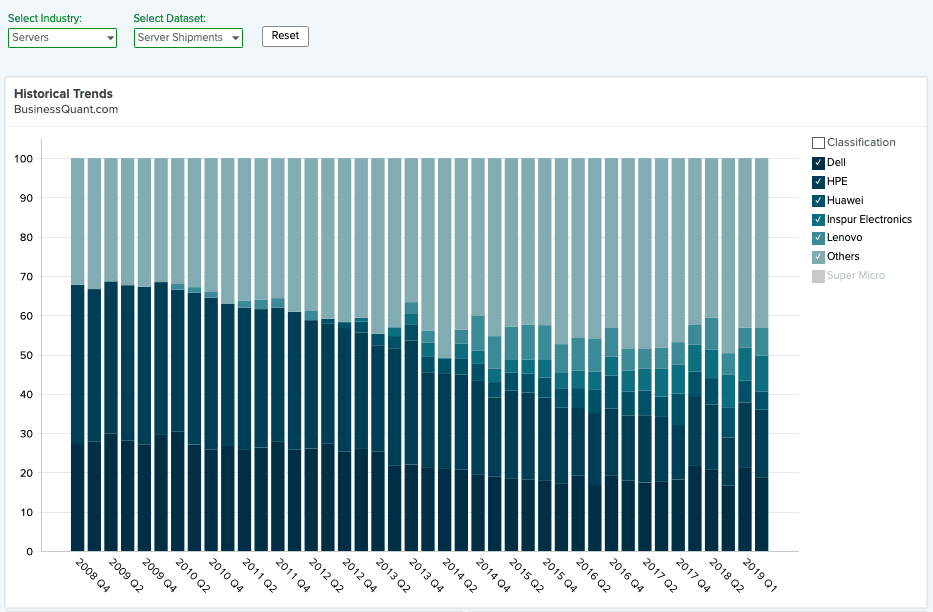
Server Market Share
Server Market Share by Vendor
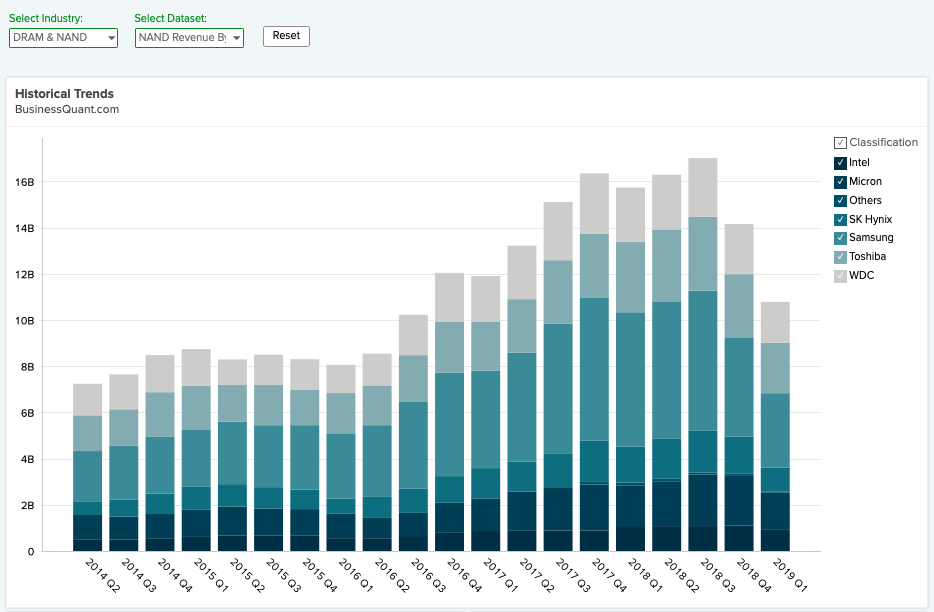
NAND Revenue
NAND Revenue by Manufacturer
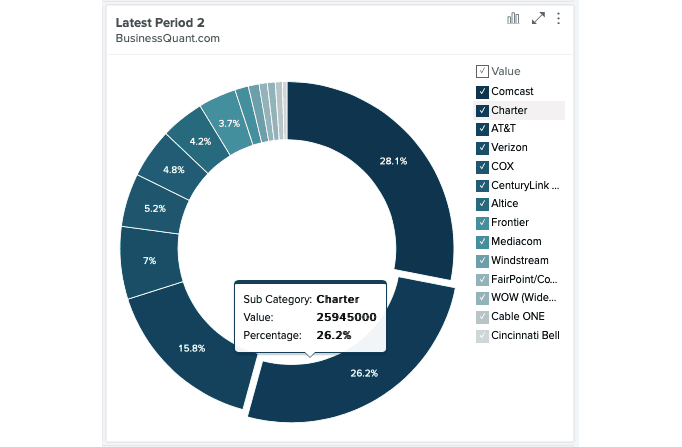
Broadband Subscribers
Broadband Subscribers by ISP in Q2 2019
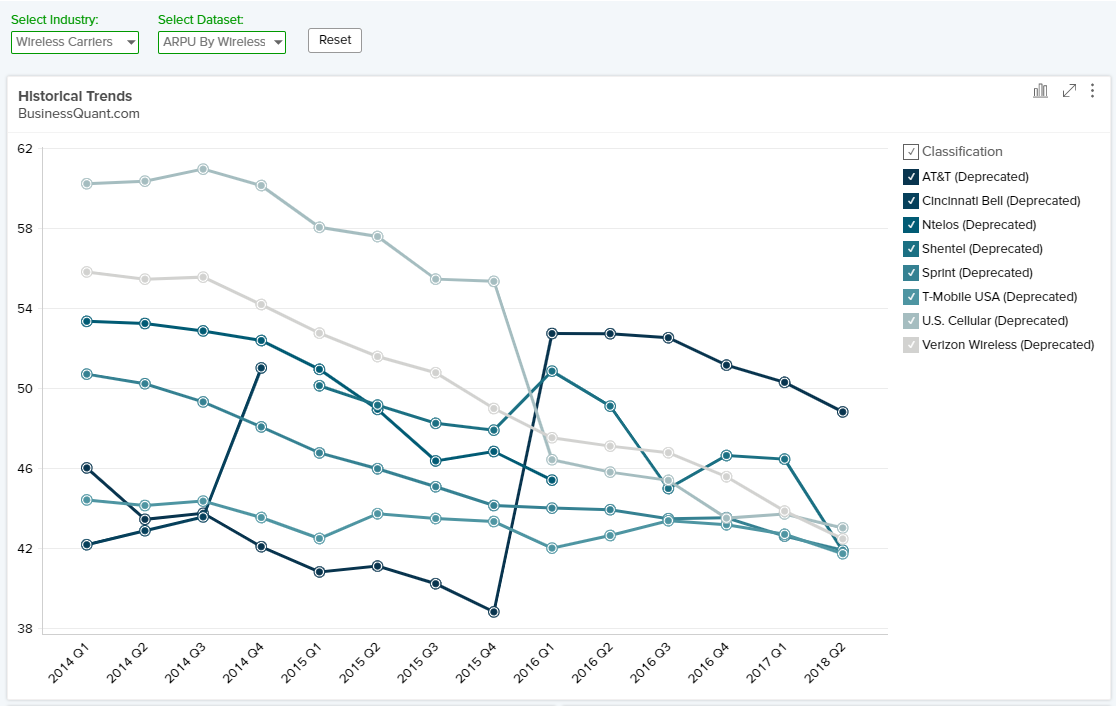
Wireless ARPUs
Wireless US telecom providers with their respective ARPUs.
Over 30 industries covered.
Metrics such as semiconductor billings, semiconductor consumption by region, equipment sales by region.
Metrics such as x86 and GPU market shares, ASP and volume growth across vendors, board shipments across industry.
Metrics such as cloud revenue by major vendor, IaaS market share, Cloud infrastructure revenue by vendor and industry
We cover 25+ industries, some of which are DRAM, PCs/Notebooks, Consoles, Construction, Foundry, Sports, Telecom etc.
Metrics such as ASM, load factor, passenger count, aircrafts in fleet, fuel cost & more, for all airline companies in our study.
Metrics such as NIM, adequacy ratio, efficiency ratio, average deposits, interest revenue & more, for all banks in our study.
Metrics such as grams produced, medical revenue, ASP, cost/gram, patient count & more, for all firms in our study.
Metrics such as reserves, volume & revenue from Gold, Silver, Zinc & Aluminum & more, for all firms in our study.
Metrics such as comparable sales growth, store count, system sales, franchised percentage & more, for all restaurants in our study.
Metrics such as PV panels manufactured, energy production, leased capacity & more for all solar firms in our study.
Metrics such as average daily production volume, revenue from oil and natural gas & more for all oil & gas firms in our study.
We cover 40+ industries, some of which are DRAM, PCs/Notebooks, Consoles, Construction, Foundry, Sports, Telecom etc.
This is what sets us apart.
Our team of analysts (CFAs and MBAs) extracts, curates and analyzes this data from official company documents — SEC filings, investor decks, supplementary materials, press releases etc. — as well as from renowned industry publications.
You don’t have to go through company fillings to keep a track how many which restaurant company opened the most number of stores during the quarter, or how market share by DRAM manufacturer. All this data is made available in the Industry Data tool.
Business Quant’s database is original and unique, that other investment research platforms may not be able to match. Our datasets are updated every quarter and we expand our coverage based on subscriber demand.
Export data for further analysis
All the data is downloadable in XLSX and CSV formats at the click of a button, so you can easily conduct further analysis on your laptop or desktop.