

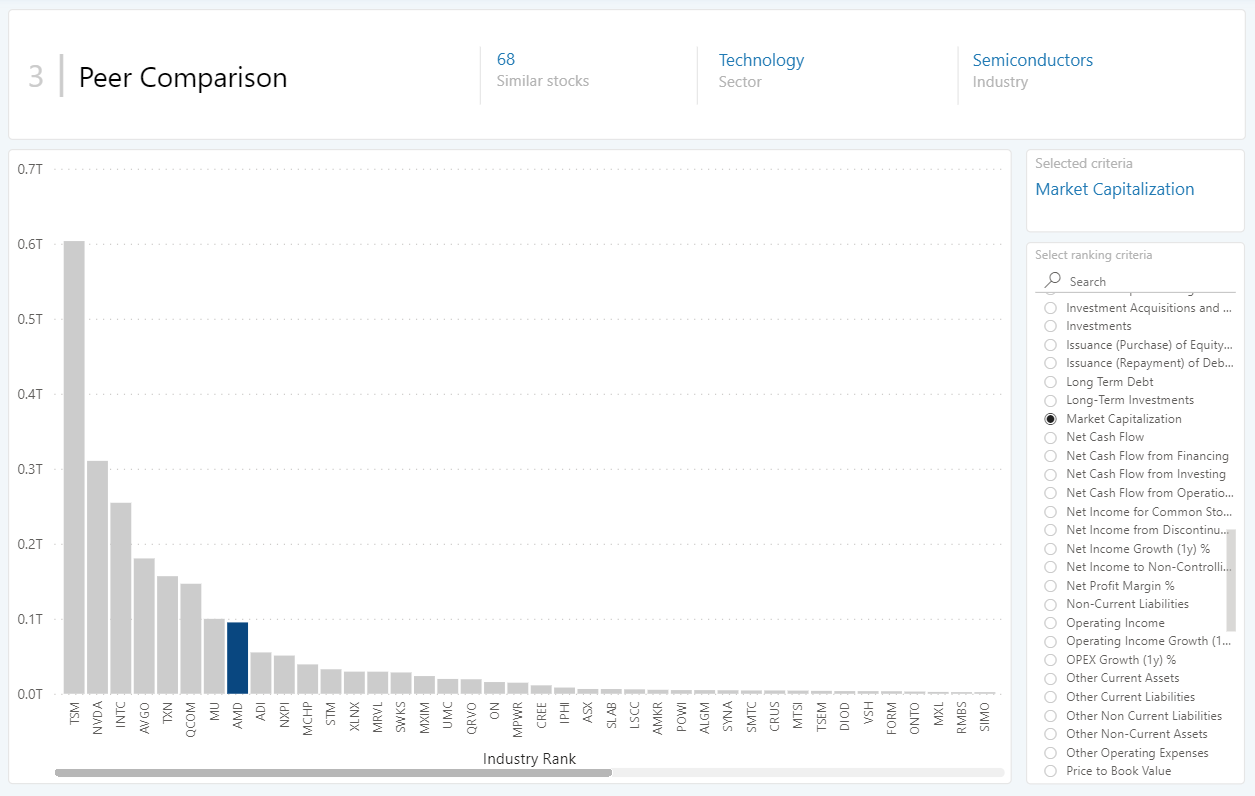
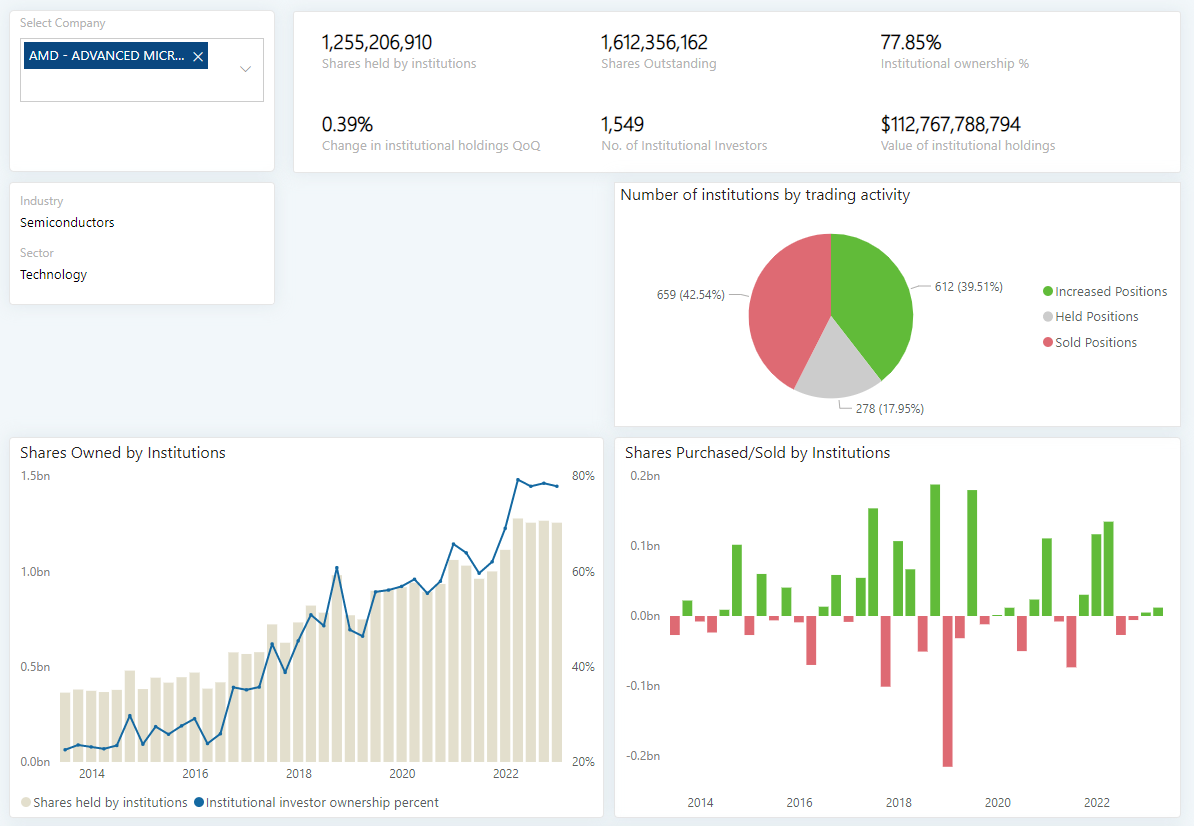
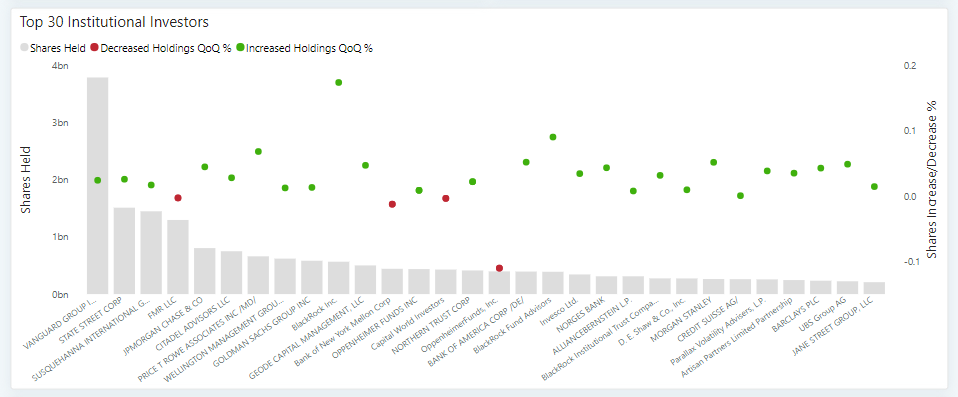
Advanced Micro Devices
Overview about its institutional holding trends
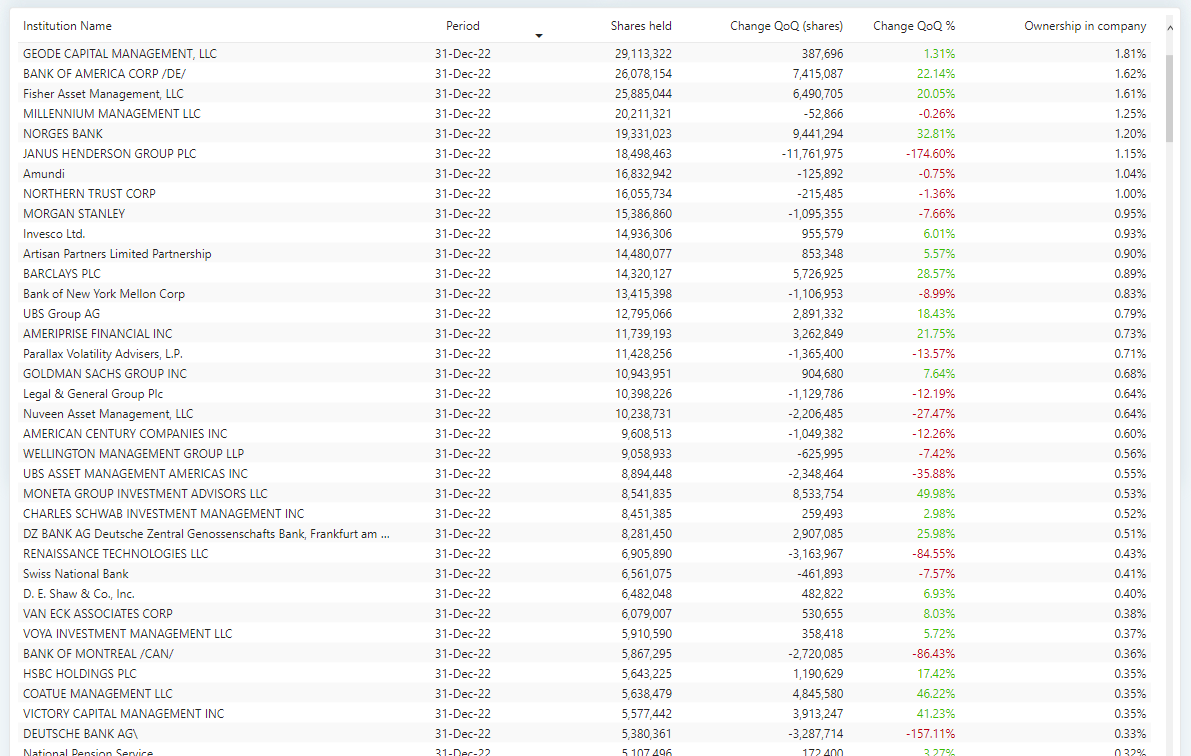
Advanced Micro Devices
View table of holdings for each institutional investor.
Advanced Micro Devices
View holding trends of key investors
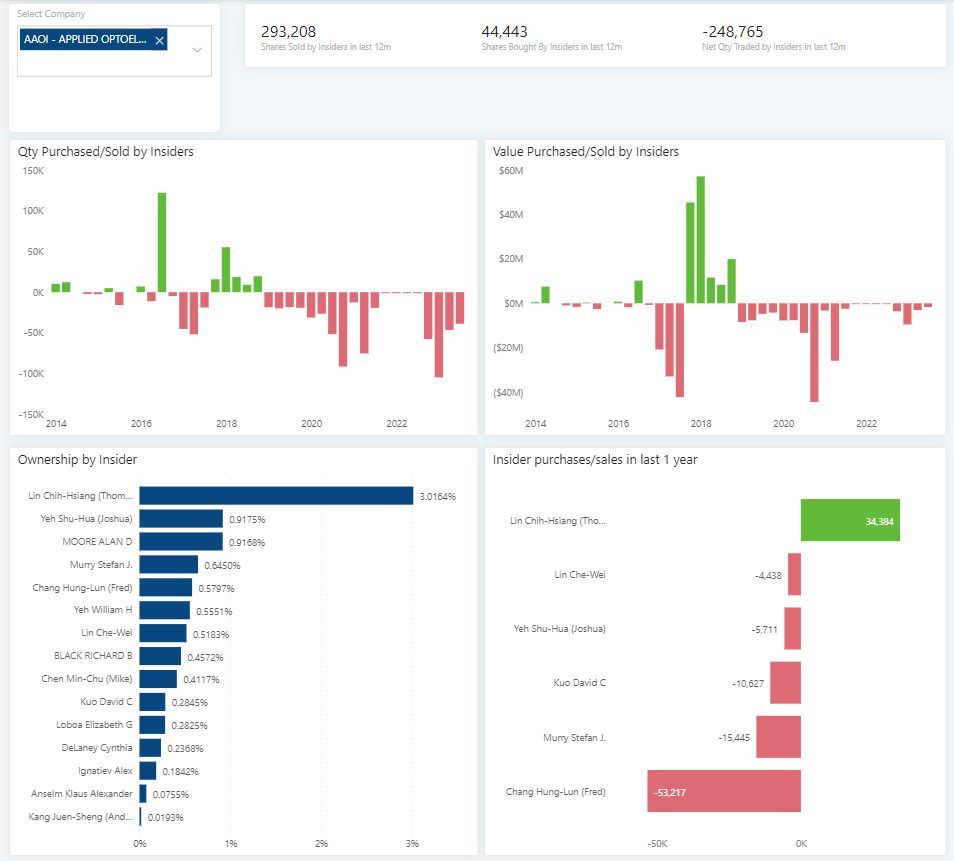
Speedy insights
Quickly gain insights about insider trading trends and highlights.
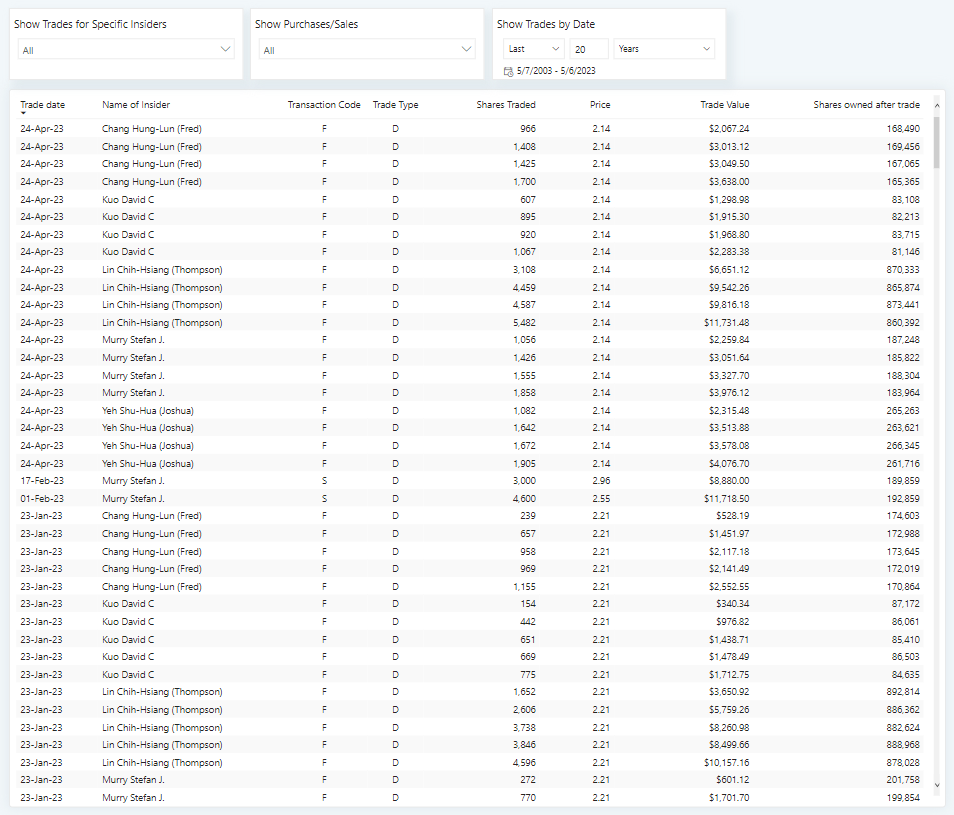
Take a deep dive
Dive deep into transaction records of every insider and filter the view per your criteria.