About Us
Pricing
Features
Company KPI Data
Industry KPI Data
Financial Data Toolkit
Menu
About Us
Pricing
Features
Company KPI Data
Industry KPI Data
Financial Data Toolkit
Login
Start for Free
About Us
Pricing
Features
Company KPI Data
Industry KPI Data
Financial Data Toolkit
Schedule A Demo
Login
Start for Free
About Us
Pricing
Features
Company KPI Data
Industry KPI Data
Financial Data Toolkit
Schedule A Demo
Start for Free
Login
Tag: services
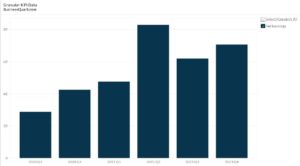
ASML Holdings’ Net Bookings (2020-2023)
Akshi Lamba
May 21, 2022
Read More »
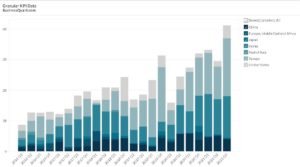
ASML Holdings’ Revenue Breakdown Worldwide (2016-2023)
Akshi Lamba
April 25, 2022
Read More »
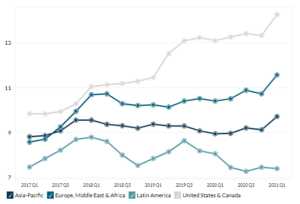
Netflix’s ARPU by Region (2017-2023)
Priti Gohil
May 15, 2020
Read More »
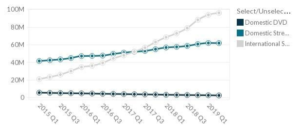
Netflix’ Number of Subscribers by Region (2018-2023)
Virang Jain
May 14, 2020
Read More »
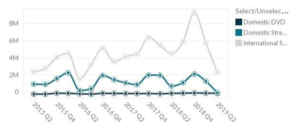
Netflix’ Subscribers by Segment (2018-2023)
Virang Jain
May 14, 2020
Read More »
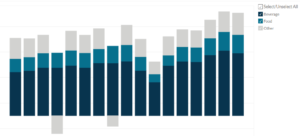
Starbucks: Revenue by Segment (2015 – 2023)
Hemali Surve
March 1, 2020
Read More »
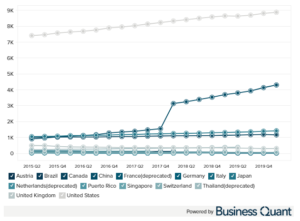
Starbucks’ Company Stores by Region (2015-2023)
Virang Jain
February 29, 2020
Read More »
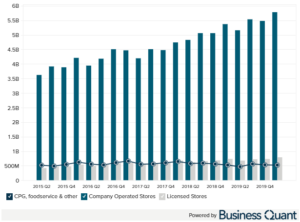
Starbucks’ Revenue Breakdown by Product (2018-2023)
Hemali Surve
February 28, 2020
Read More »
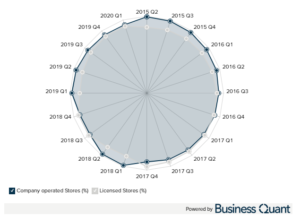
Starbucks’ Company and Licensed Stores Share (2015-2023)
Virang Jain
February 28, 2020
Read More »
Roku’s Revenue Breakdown by Segment (2016-2023)
Vaishali Ladha
February 20, 2020
Read More »
Get Pro for 60% off
Access all features immediately
Datasets updated every day
Export data in CSV and XLSX formats
Offer Ends In
{"timer_type":"fixed","years":"2024","months":"4","days":"22","hours":"9","minutes":"30","show_labels":"yes","show_years":"","show_months":"","show_days":"yes","show_hours":"yes","show_minutes":"yes","show_seconds":"yes","label_days_plural":"Days","label_days_singular":"Day","label_hours_plural":"Hours","label_hours_singular":"Hour","label_minutes_plural":"Minutes","label_minutes_singular":"Minute","label_seconds_plural":"Seconds","label_seconds_singular":"Second","block_style":"default","label_position":"outside","fixed_timer_action":"hide","timer_layout":"{y<} \t\t<div class=\"pp-countdown-item\">\n\t\t\t<div class=\"pp-countdown-digit-wrapper\">\n\t\t\t\t<h3 class=\"pp-countdown-digit\">\n\t\t\t\t\t{ynn}\t\t\t\t<\/h3>\n\t\t\t<\/div>\n\t\t\t\t\t\t\t<div class=\"pp-countdown-label-wrapper\">\n\t\t\t\t\t<p class=\"pp-countdown-label\">\n\t\t\t\t\t\t{yl}\t\t\t\t\t<\/p>\n\t\t\t\t<\/div>\n\t\t\t\t\t<\/div>\n\t\t {y>}\n\t\t\t\t\t{o<} \t\t<div class=\"pp-countdown-item\">\n\t\t\t<div class=\"pp-countdown-digit-wrapper\">\n\t\t\t\t<h3 class=\"pp-countdown-digit\">\n\t\t\t\t\t{onn}\t\t\t\t<\/h3>\n\t\t\t<\/div>\n\t\t\t\t\t\t\t<div class=\"pp-countdown-label-wrapper\">\n\t\t\t\t\t<p class=\"pp-countdown-label\">\n\t\t\t\t\t\t{ol}\t\t\t\t\t<\/p>\n\t\t\t\t<\/div>\n\t\t\t\t\t<\/div>\n\t\t {o>}\n\t\t\t\t\t{d<} \t\t<div class=\"pp-countdown-item\">\n\t\t\t<div class=\"pp-countdown-digit-wrapper\">\n\t\t\t\t<h3 class=\"pp-countdown-digit\">\n\t\t\t\t\t{dnn}\t\t\t\t<\/h3>\n\t\t\t<\/div>\n\t\t\t\t\t\t\t<div class=\"pp-countdown-label-wrapper\">\n\t\t\t\t\t<p class=\"pp-countdown-label\">\n\t\t\t\t\t\t{dl}\t\t\t\t\t<\/p>\n\t\t\t\t<\/div>\n\t\t\t\t\t<\/div>\n\t\t {d>}\n\t\t\t\t\t{h<} \t\t<div class=\"pp-countdown-item\">\n\t\t\t<div class=\"pp-countdown-digit-wrapper\">\n\t\t\t\t<h3 class=\"pp-countdown-digit\">\n\t\t\t\t\t{hnn}\t\t\t\t<\/h3>\n\t\t\t<\/div>\n\t\t\t\t\t\t\t<div class=\"pp-countdown-label-wrapper\">\n\t\t\t\t\t<p class=\"pp-countdown-label\">\n\t\t\t\t\t\t{hl}\t\t\t\t\t<\/p>\n\t\t\t\t<\/div>\n\t\t\t\t\t<\/div>\n\t\t {h>}\n\t\t\t\t\t{m<} \t\t<div class=\"pp-countdown-item\">\n\t\t\t<div class=\"pp-countdown-digit-wrapper\">\n\t\t\t\t<h3 class=\"pp-countdown-digit\">\n\t\t\t\t\t{mnn}\t\t\t\t<\/h3>\n\t\t\t<\/div>\n\t\t\t\t\t\t\t<div class=\"pp-countdown-label-wrapper\">\n\t\t\t\t\t<p class=\"pp-countdown-label\">\n\t\t\t\t\t\t{ml}\t\t\t\t\t<\/p>\n\t\t\t\t<\/div>\n\t\t\t\t\t<\/div>\n\t\t {m>}\n\t\t\t\t\t{s<} \t\t<div class=\"pp-countdown-item\">\n\t\t\t<div class=\"pp-countdown-digit-wrapper\">\n\t\t\t\t<h3 class=\"pp-countdown-digit\">\n\t\t\t\t\t{snn}\t\t\t\t<\/h3>\n\t\t\t<\/div>\n\t\t\t\t\t\t\t<div class=\"pp-countdown-label-wrapper\">\n\t\t\t\t\t<p class=\"pp-countdown-label\">\n\t\t\t\t\t\t{sl}\t\t\t\t\t<\/p>\n\t\t\t\t<\/div>\n\t\t\t\t\t<\/div>\n\t\t {s>}\n\t\t\t\t","timer_format":"DHMS","timer_labels":"Years,Months,,Days,Hours,Minutes,Seconds","timer_labels_singular":"Year,Month,,Day,Hour,Minute,Second","time_zone":"NULL","timer_exp_text":"<div class=\"pp-countdown-expire-message\"><\/div>","redirect_link":"","redirect_link_target":"","expire_message":""}
Starting from
$49
$19 / month
Watch Demo
Claim Discount
.