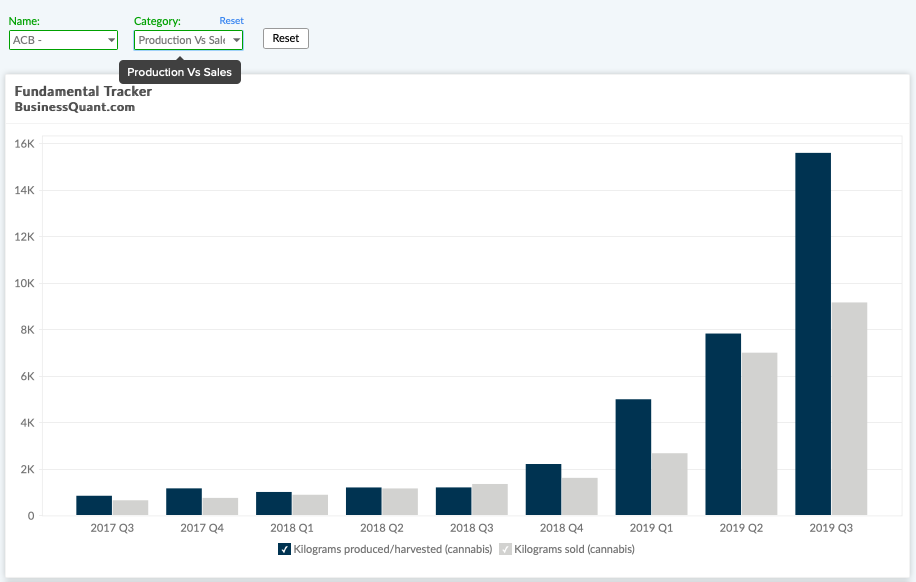
Key performance indicator data.
You don’t have to go through boring SEC filings to keep a track of AT&T’s subscriber count, Apple’s revenue from iPhones or Disney’s revenue by segment. Access over 100,000 key performance indicator data points (or KPI data) on thousands of listed stocks. Get an edge over the market, from day one.
Access over 100,000 KPI data points on US stocks.
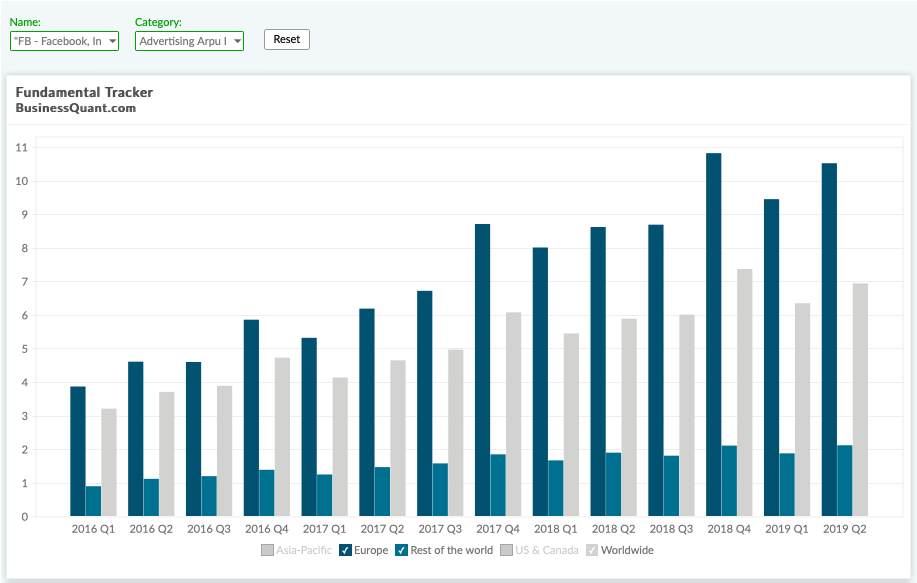
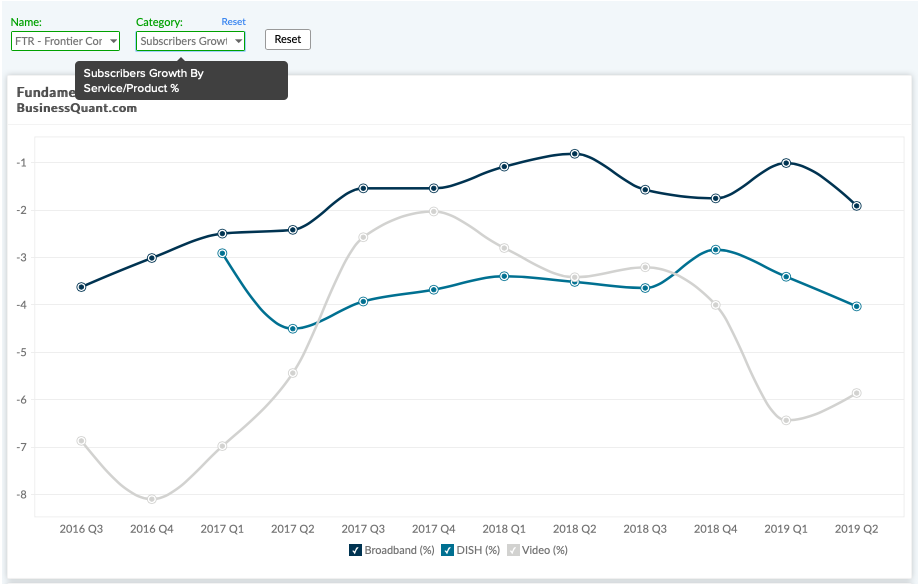
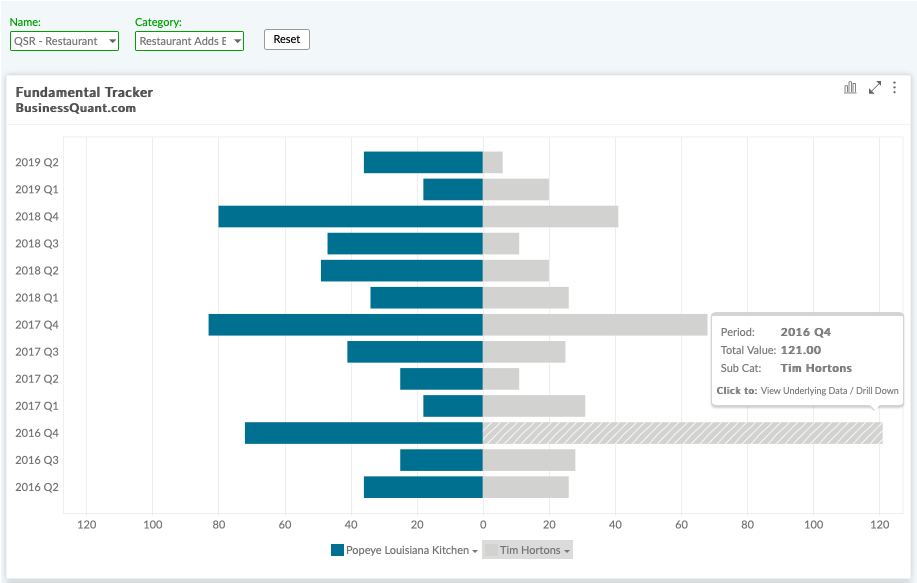
Key performance data such as shipments, ARPU, churn, gold reserves, restaurant adds etc.
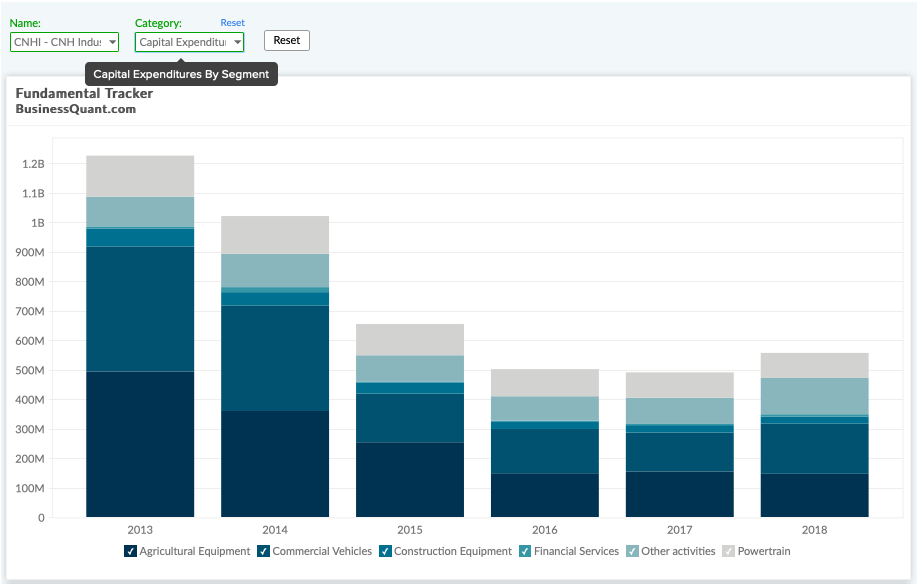
Financials by segment, product category, business vertical, region and end-markets etc.
Total and long-lived assets segregated by type and by geographic location to assess concentration risk.
GAAP and non-GAAP numbers. Latter includes items such as adjusted EBITDA, margins etc.
Historical operating expenses segregated by type and as a percentage of revenue.
Items such as financial contribution and margins by segment, region, product category, business vertical.
Access revenue exposure to major geographies and customers to get an early heads up.
Also, a wide range of other datasets and analytics such as employee count, revenue per hotel etc.
This is what sets us apart.
Our team of analysts (CFAs and MBAs) extracts, curates and analyzes this data from official company documents — SEC filings, investor presentations, supplementary materials, press releases etc. — as well as from renowned industry publications.
You don’t have to go through company fillings to keep a track how many stores McDonalds opened during the quarter, or how many vehicles Tesla produced last year. All this data is made available in the Company KPI Tool.
Business Quant’s Company KPI database is original and unique, that other investment research platforms may not be able to match. Our datasets are updated every quarter and we also expand our coverage based on subscriber requests.
See how Business Quant helps investors.
We're happy to help
or prefer a direct mail?

