About Us
Pricing
Features
Company KPI Data
Industry KPI Data
Financial Data Toolkit
Menu
About Us
Pricing
Features
Company KPI Data
Industry KPI Data
Financial Data Toolkit
Login
Start for Free
About Us
Pricing
Features
Company KPI Data
Industry KPI Data
Financial Data Toolkit
Schedule A Demo
Login
Start for Free
About Us
Pricing
Features
Company KPI Data
Industry KPI Data
Financial Data Toolkit
Schedule A Demo
Start for Free
Login
Tag: Communication Equipment
Maxar Technologies’ Revenue Breakdown (2019-2022)
Kanika Sah
May 10, 2022
Read More »
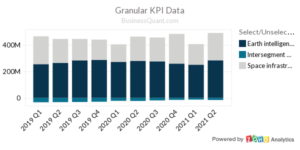
Maxar Technologies’ Revenue by Segment (2018-2022)
Kanika Sah
May 9, 2022
Read More »
Hewlett Packard’s Revenue Breakdown by Region (2018-2023)
Dhanraj Johari
April 21, 2022
Read More »
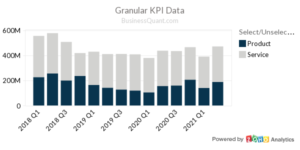
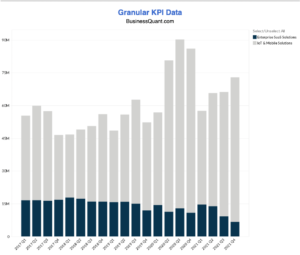
Inseego’s Revenue Breakdown by Segment (2017-2023)
Dhanraj Johari
April 21, 2022
Read More »
Hewlett Packard’s Revenue by Segment (2016-2023)
Shiksha Sahu
April 17, 2022
Read More »
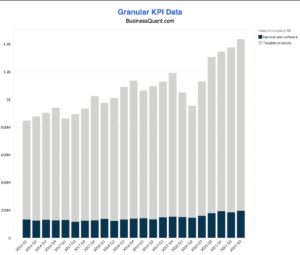
Zebra Technologies’ Revenue by Product (2016-2023)
Dhanraj Johari
April 12, 2022
Read More »
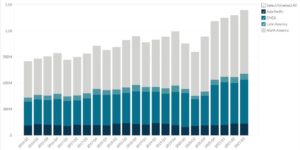
Zebra Technologies’ Revenue Breakdown Worldwide (2016-2023)
Ishika Garg
March 21, 2022
Read More »
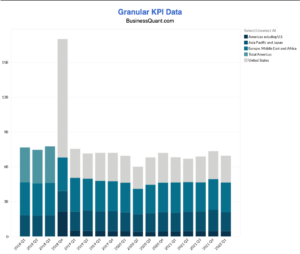
Inseego’s Revenue Breakdown Worldwide (2017-2023)
Priyansh Chourasia
March 18, 2022
Read More »
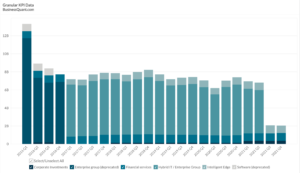
Zebra Technologies’ Revenue by Segment (2018-2023)
Ishika Garg
February 3, 2022
Read More »
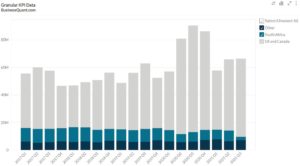
Cisco’s Revenue Breakdown Worldwide (2016-2023)
Ritesh Nandgaonkar
May 19, 2021
Read More »
Page
1
Page
2
Get Pro for 60% off
Access all features immediately
Datasets updated every day
Export data in CSV and XLSX formats
Offer Ends In
{"timer_type":"fixed","years":"2024","months":"5","days":"1","hours":"9","minutes":"30","show_labels":"yes","show_years":"","show_months":"","show_days":"yes","show_hours":"yes","show_minutes":"yes","show_seconds":"yes","label_days_plural":"Days","label_days_singular":"Day","label_hours_plural":"Hours","label_hours_singular":"Hour","label_minutes_plural":"Minutes","label_minutes_singular":"Minute","label_seconds_plural":"Seconds","label_seconds_singular":"Second","block_style":"default","label_position":"outside","fixed_timer_action":"hide","timer_layout":"{y<} \t\t<div class=\"pp-countdown-item\">\n\t\t\t<div class=\"pp-countdown-digit-wrapper\">\n\t\t\t\t<h3 class=\"pp-countdown-digit\">\n\t\t\t\t\t{ynn}\t\t\t\t<\/h3>\n\t\t\t<\/div>\n\t\t\t\t\t\t\t<div class=\"pp-countdown-label-wrapper\">\n\t\t\t\t\t<p class=\"pp-countdown-label\">\n\t\t\t\t\t\t{yl}\t\t\t\t\t<\/p>\n\t\t\t\t<\/div>\n\t\t\t\t\t<\/div>\n\t\t {y>}\n\t\t\t\t\t{o<} \t\t<div class=\"pp-countdown-item\">\n\t\t\t<div class=\"pp-countdown-digit-wrapper\">\n\t\t\t\t<h3 class=\"pp-countdown-digit\">\n\t\t\t\t\t{onn}\t\t\t\t<\/h3>\n\t\t\t<\/div>\n\t\t\t\t\t\t\t<div class=\"pp-countdown-label-wrapper\">\n\t\t\t\t\t<p class=\"pp-countdown-label\">\n\t\t\t\t\t\t{ol}\t\t\t\t\t<\/p>\n\t\t\t\t<\/div>\n\t\t\t\t\t<\/div>\n\t\t {o>}\n\t\t\t\t\t{d<} \t\t<div class=\"pp-countdown-item\">\n\t\t\t<div class=\"pp-countdown-digit-wrapper\">\n\t\t\t\t<h3 class=\"pp-countdown-digit\">\n\t\t\t\t\t{dnn}\t\t\t\t<\/h3>\n\t\t\t<\/div>\n\t\t\t\t\t\t\t<div class=\"pp-countdown-label-wrapper\">\n\t\t\t\t\t<p class=\"pp-countdown-label\">\n\t\t\t\t\t\t{dl}\t\t\t\t\t<\/p>\n\t\t\t\t<\/div>\n\t\t\t\t\t<\/div>\n\t\t {d>}\n\t\t\t\t\t{h<} \t\t<div class=\"pp-countdown-item\">\n\t\t\t<div class=\"pp-countdown-digit-wrapper\">\n\t\t\t\t<h3 class=\"pp-countdown-digit\">\n\t\t\t\t\t{hnn}\t\t\t\t<\/h3>\n\t\t\t<\/div>\n\t\t\t\t\t\t\t<div class=\"pp-countdown-label-wrapper\">\n\t\t\t\t\t<p class=\"pp-countdown-label\">\n\t\t\t\t\t\t{hl}\t\t\t\t\t<\/p>\n\t\t\t\t<\/div>\n\t\t\t\t\t<\/div>\n\t\t {h>}\n\t\t\t\t\t{m<} \t\t<div class=\"pp-countdown-item\">\n\t\t\t<div class=\"pp-countdown-digit-wrapper\">\n\t\t\t\t<h3 class=\"pp-countdown-digit\">\n\t\t\t\t\t{mnn}\t\t\t\t<\/h3>\n\t\t\t<\/div>\n\t\t\t\t\t\t\t<div class=\"pp-countdown-label-wrapper\">\n\t\t\t\t\t<p class=\"pp-countdown-label\">\n\t\t\t\t\t\t{ml}\t\t\t\t\t<\/p>\n\t\t\t\t<\/div>\n\t\t\t\t\t<\/div>\n\t\t {m>}\n\t\t\t\t\t{s<} \t\t<div class=\"pp-countdown-item\">\n\t\t\t<div class=\"pp-countdown-digit-wrapper\">\n\t\t\t\t<h3 class=\"pp-countdown-digit\">\n\t\t\t\t\t{snn}\t\t\t\t<\/h3>\n\t\t\t<\/div>\n\t\t\t\t\t\t\t<div class=\"pp-countdown-label-wrapper\">\n\t\t\t\t\t<p class=\"pp-countdown-label\">\n\t\t\t\t\t\t{sl}\t\t\t\t\t<\/p>\n\t\t\t\t<\/div>\n\t\t\t\t\t<\/div>\n\t\t {s>}\n\t\t\t\t","timer_format":"DHMS","timer_labels":"Years,Months,,Days,Hours,Minutes,Seconds","timer_labels_singular":"Year,Month,,Day,Hour,Minute,Second","time_zone":"NULL","timer_exp_text":"<div class=\"pp-countdown-expire-message\"><\/div>","redirect_link":"","redirect_link_target":"","expire_message":""}
Starting from
$49
$19 / month
Watch Demo
Claim Discount
.