Several new stock research platforms have launched in the last few years. Although most platforms differ in terms of data coverage, geographical coverage, and available tools, the age-old problem remains — interpreting the data provided by the companies and deciding which one is the best suitable for investors. The following stock research tools are at the forefront of solving this problem, in our opinion, by offering a diverse set of features that are user intuitive and aid in generating actionable insights, rather than just spewing raw data.

12 Best Stock Research Tools for 2026:
- Ycharts
- Business Quant
- Gurufocus
- Morningstar Premium
- S&P Capital IQ
- Finbox
- Koyfin
- Stockopedia
- MarketXLS
- Thomson Reuters Eikon
- Benzinga Pro
- Bloomberg
Looking at Stock Research Tools
-
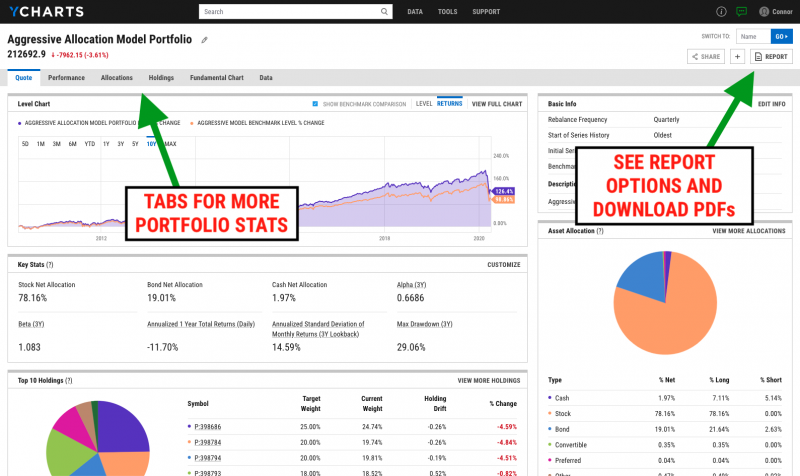
Ycharts
Ycharts was founded back in 2009, and since then, it’s well known for providing an extensive range of data points. They claim to have over 4000 clients who collectively oversee more than $750 billion in assets.
Ycharts provides 7-day free trial for their services,
-
- Their Standard basic package is priced at $3,600/year and the Professional is priced at $6,000/year
The standard package includes access to the following :
-
- Fundamental & Technical Charting
- Stock & Fund Screeners
- Live News and Customizable Alerts
- Analyst Estimates & Recommendations
- Dashboard for Monitoring Markets & Securities
Professional and Enterprise packages allow for the user to have access to features such as Charts, Excel Add-In, Integration Support, Model Portfolios, Comp Tables & Timeseries Analysis, Scoring Models, Dedicated Account Manager, Collaboration & Content Sharing Across Users, Tailored Onboarding & Training Program, Firm-wide Excel Model Conversion & Automation, and Consolidated Billing & Account Admin.
-
Business Quant
That’s us! Business Quant provides financial data, segment financials, KPI data, and powerful analytical tools to help investors research stocks and understand industry trends. We like to think that Business Quant is one of the best stock research tools for making informed investment decisions.
With Business Quant, you can access powerful features such as:
-
- Key Performance Indicator Data (e.g. AT&T’s subscriber adds, McDonald’s’ restaurant openings, Tesla’s vehicle deliveries by model, etc.),
- Financials by Region, Segment and Other Classifications,
- Industry Data (e.g. market share, shipments by vendor, etc.),
- Non-GAAP metrics from company presentations and filings,
- Stock Screener,
- Sector financials,
- Stock comparisons,
- Stock warnings,
- Stock ratings
- SEC filings
- Insider ownership data
- Institutional ownership data
- 200+ financial items and ratios for thousands for US stocks,
- Financial statements dating back 10+ years,
- Charting and visualization tools,
- Download data in CSV and XLSX formats
Our team of analysts goes through company filings, press releases, investor presentations, and other company documents to compile segment financials, non-GAAP metrics and key performance indicators. This way, you never have to dig through boring company documents and maintain a database of your own. Countless hours saved!
-
-
- The basic plan is free of cost, but provides access to limited data.
- The Pro plan is priced at just $19/month, when billed annually.
-
-
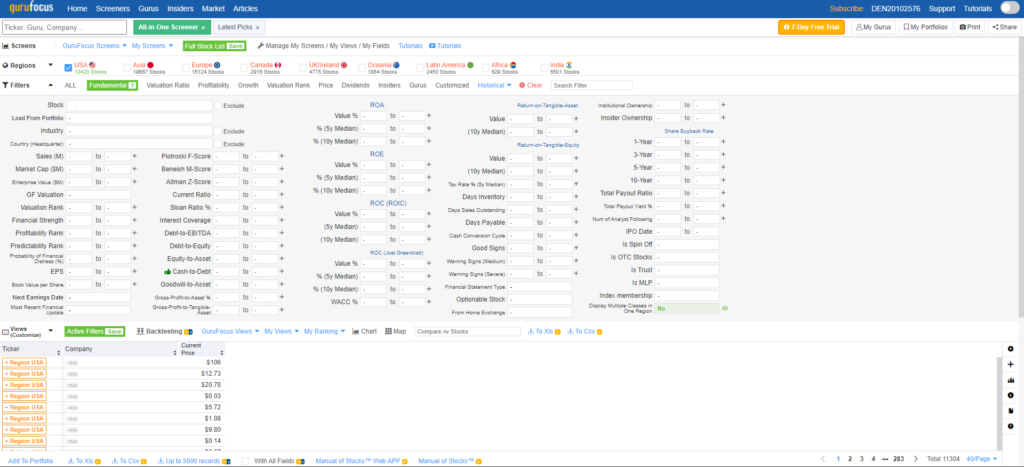
GuruFocus
GuruFocus is another comprehensive stock research platform dedicated to value investing. It was founded in 2004, and it follows the principles of Warren Buffett. They believe the most effective way to create wealth is by investing long term and in quality instruments. GuruFocus provides a range of tools to excel at investment. For starters, it tracks 175+ investment gurus – mostly wealth managers and successful individual investors and CEOs and CFOs of various companies — to provide an upper hand on the market and information.
The platform also hosts vital features such as a comprehensive stock screener, discussion forums for investors, financial news, insider trading information, and a range of financial statements, business and valuation ratios. Plus, GuruFocus sports interactive charts, warning signs and data APIs to help investors to make informed investment decisions.
Clients are entitled to 7-day free trials of GuruFocus Premium and PremiumPlus memberships.
For individual investors:
-
- The price of the Premium membership depends on the geographical market. US market data costs $449/year, while European and Asian market data costs $399/year.
For professional investors:
-
- Professional membership costs $2,245/year for US market data and $1,995/year for Asian and European.
- Professional membership costs $2,245/year for US market data and $1,995/year for Asian and European.
-
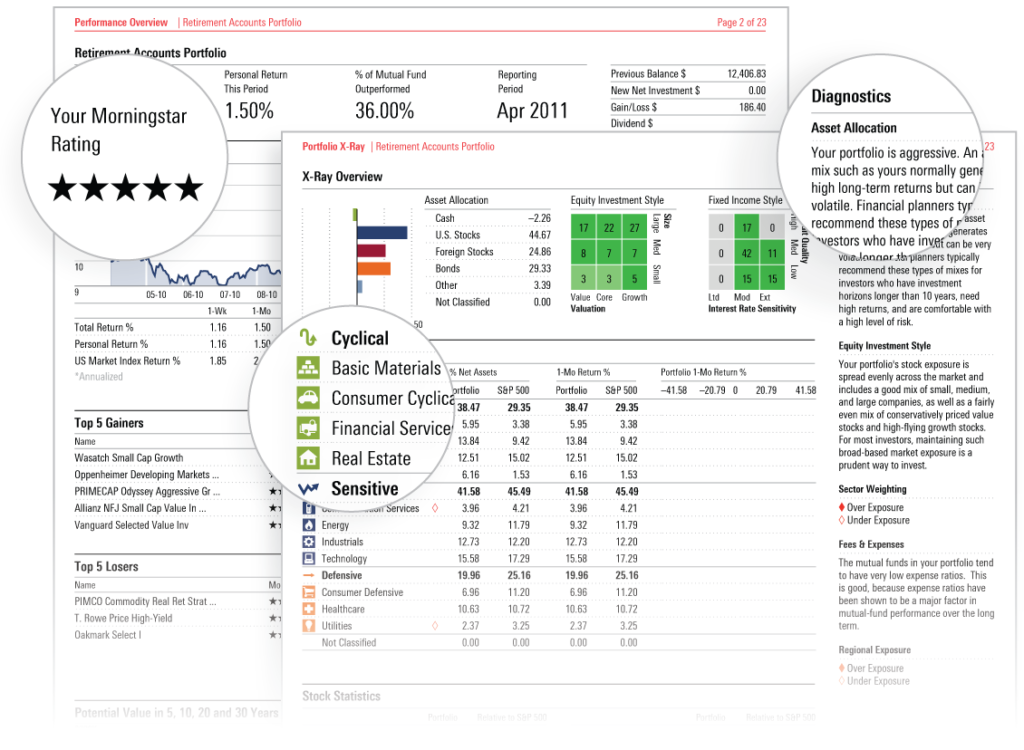
Morningstar Premium
Morningstar offers retail and individual investors access to news, financial data, and research on stocks, bonds, ETFs and mutual fund via its Morningstar Premium subscription product. Unlike other platforms, Morningstar premium does not rely on charts and technical analysis but focuses on fundamental analysis. Morningstar Premium is well suited to investors who prefer investing based on company fundamentals.
Morningstar Premium starts with a 14-day free trial, after which the service costs $29.95 per month or $199 per year.
Here are some features of a Morningstar Premium subscription
-
- Portfolio X-ray
- Fund screeners
- Portfolio manager
- Investment planning
- Personal Capital advisor
- Rating list
- Premium articles
-
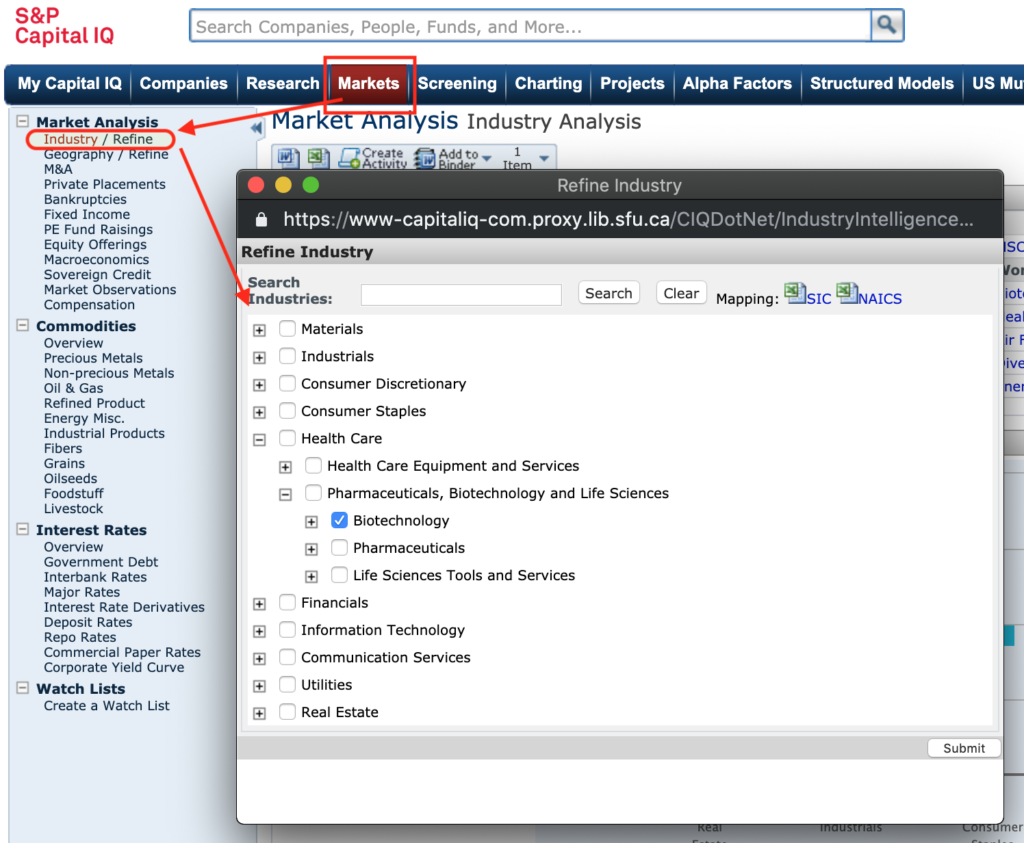
S&P Capital IQ
S&P Capital IQ is the research division of Standard & Poor. Ever since Capital IQ was acquired by Standard & Poor in 2004, the company has expanded operations in more than 20 countries, and its research terminals now cover almost all major markets. Capital IQ provides financial news, market insights, financial and pricing data, research reports on ETFs, funds, bonds on more than 65,000 public and 15 million private companies across the globe.
Capital IQ’s feature set includes the following:
-
- Deep company and industry research,
- Industry data,
- Supply chain database,
- Build and maintain models and presentation
- Commodities and futures, macroeconomic, pricing and exchange data
Capital IQ’s feature set is best suited for institutional or professional investors, and its pricing starts at $13,000 per user per year with a minimum of 3 users. This pricing drops to as low as $7,500 per user per year for large teams. But that’s just the starting pricing. There are data and feature add-ons that can quickly inflate the overall cost. It’s one of the most comprehensive and perhaps one of the best stock research tools in the list, provided one has a budget for it.
-
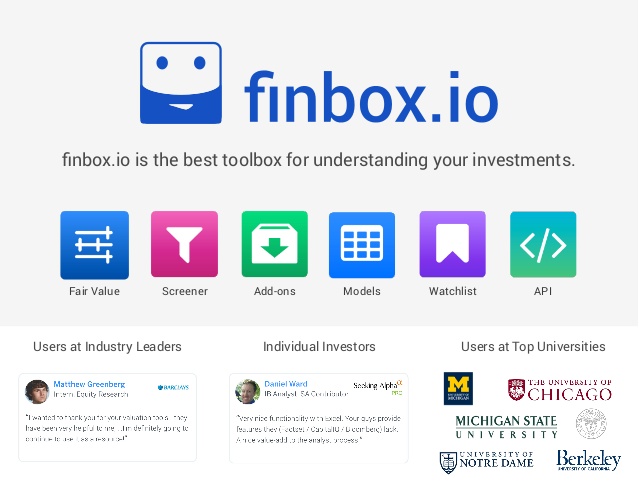
Finbox.com
Finbox.comwas founded in 2014. It provides fundamental and financial data for 6 major global markets, including the U.S. The platform serves as a stock market portfolio research and management instrument to help traders improve their investing skills.
What makes Finbox different is it’s financial modelling functionality. Users create their own custom financial model templates, download the recent SEC filings and monitor their returns in a model portfolio.
Finbox’s feature set includes:
-
- Stock screener
- Watchlist
- Ideas (find other portfolios through the search bar)
- Custom model templates
- Financial data for US and 5 other markets
- Data API
- Educational classroom
Finbox provides a 10-day free trial for $1.
Its pricing starts at $20/month, billed annually for U.S. market data only; and $66/month when billed annually for global markets.
If you don’t want to commit to an annual plan, Finbox.com also provides monthly plans for $39 and a quarterly plan for $90.
-
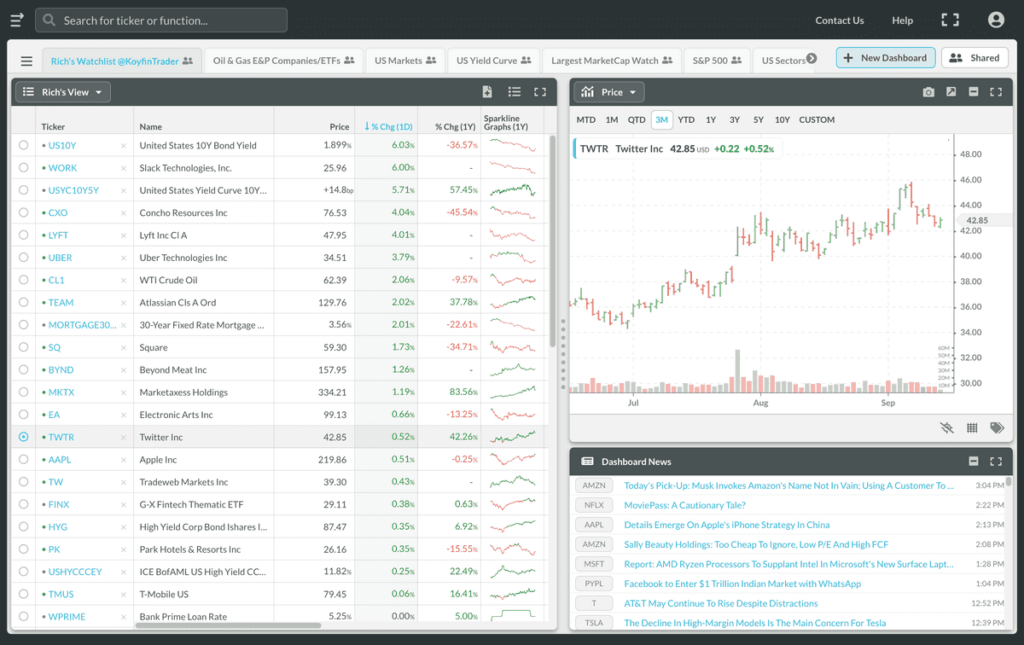
Koyfin
Koyfin was started in 2016 by two former Wall Street veterans. Its plans start from $15/month and go all the way up to $70/month.
The platform provides customizable dashboards and focuses on US markets. It’s similar to a research terminal, except it’s on the web.
Koyfin’s feature set includes:
-
- Macro Dashboards (macroeconomic, FX and commodity data)
- Financial statements and valuations
- Charting and graphing
- User-customizable dashboards
- Stock pricing data
-
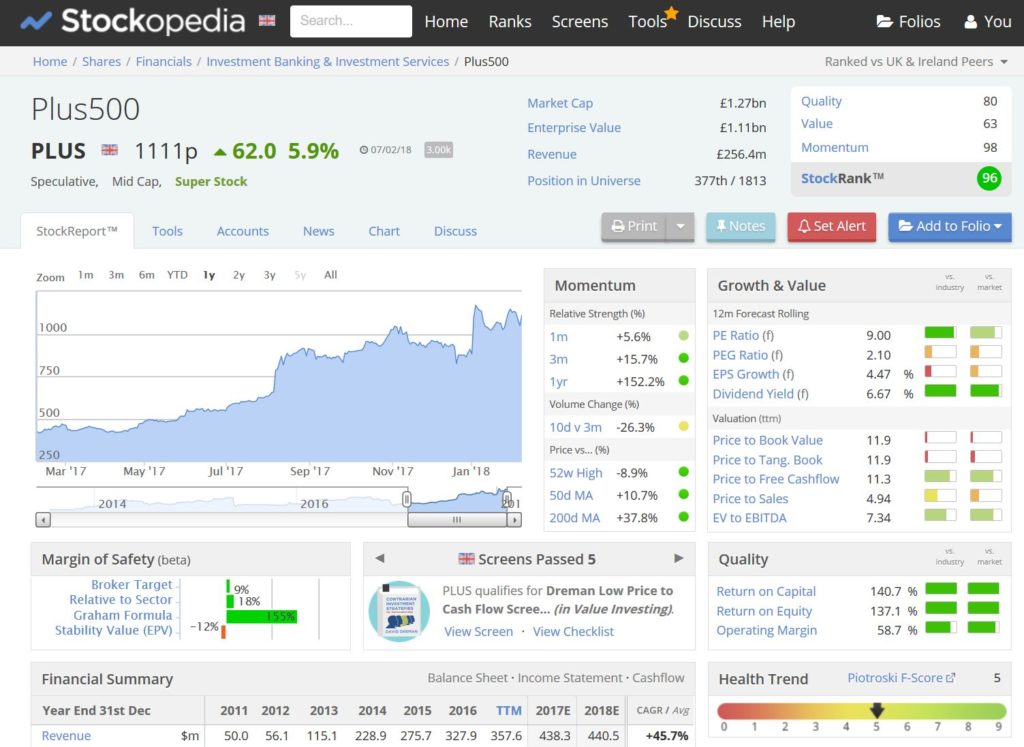
Stockopedia
Stockopedia was launched in 2010. It’s now attracted more than 10,000 subscribers to its platform. The platform provides automated stock ratings and portfolio analysis.
Stockopedia provides services such as
-
- StockRanks (automated stock ranking)
- Stock screening
- Portfolio tracking and watchlists
- Stock reports
- Charting and graphing
- eBooks, Forums, Stockopedia customization and layout
Stockopedia’s has region-specific pricing:
-
- United Kingdom – $15/month and $75/year
- Europe (29+ countries including UK) and Developed Asia (5 Asia-Pacific nations) – $55/month and $400/year
- Australasia, United States and Canada – $25/month and $150/year
- India – $30/month and $300/year
-
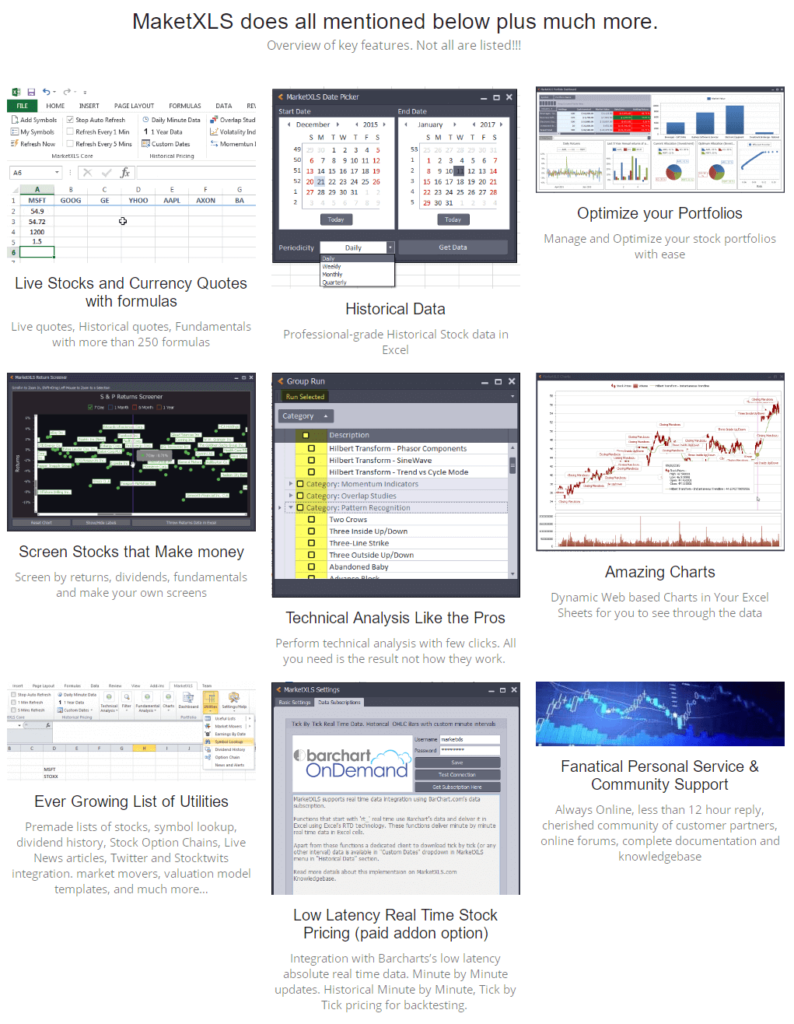
MarketXLS
MarketXLS was founded in 2015. It’s an Excel-focused investment research platform. It provides financial, fundamental, and pricing data on stocks, ETFs, options & mutual funds within Microsoft Excel. Users can also screen stocks based on cash flow ratios, balance sheet items, income statement items, along with valuation and business ratios. There are also pattern recognition scans ideal for technical analysts and the option to back-test strategies. MarketXLS is best suited for Excel-oriented investors.
The platform provides coverage on 6 major markets: US, Canada, Australia, Germany and UK.
MarketXLS sports a feature set such as:
-
- Portfolio monitoring,
- Charts and visualization,
- Technical indicator scans,
- Back-testing strategies,
- Social media and market news,
- Options data,
- Watchlists,
MarketXLS provides a 7-days free trail and comes with four different versions of subscription,
-
-
- Pro, priced at $420/year,
- Pro Plus priced at $680/year,
- Pro Plus RT priced at $940/year and
- Premium priced at $1680/year.
-
-
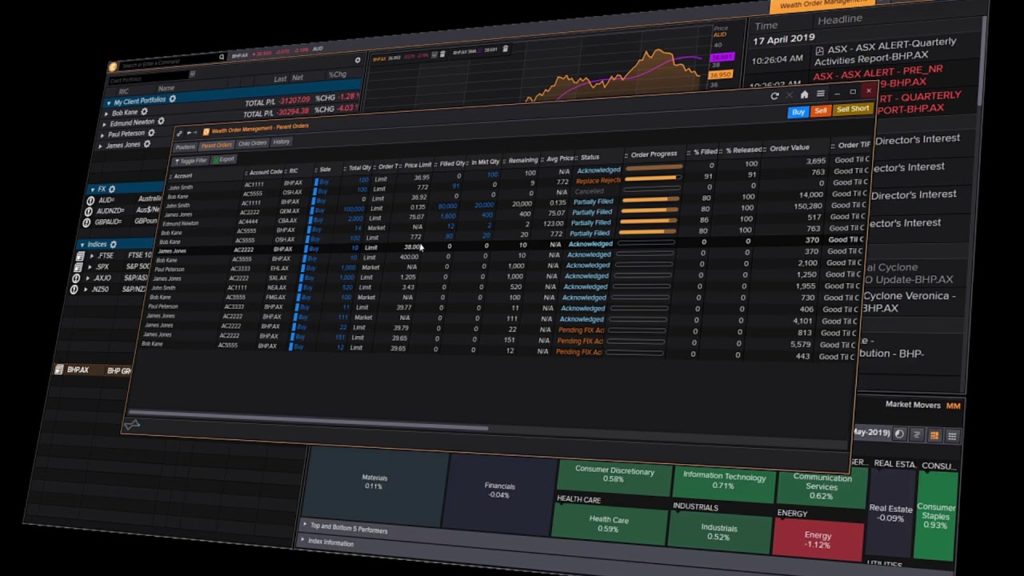
Refinitive EIKON
Refinitiv Eikon, launched in 2010, is a full-blown trading and research terminal like Bloomberg and S&P Capital IQ. The platform provides real-time market data, news, fundamental data, research reports, trading, and messaging tools.
It’s an open platform so clients can build and plug into a wide array of APIs and apps to get the information they need, when and how they need it.
A Reuters Eikon terminal can cost as much as $1,800 per month, or $21,600 per year, depending on the number of addons included in the subscription. There’s an additional $300 to $800 setup fee. The platform is apt for financial and investment professionals who want monitor and analyze global securities and don’t mind paying $21,600 per user, per year.
-
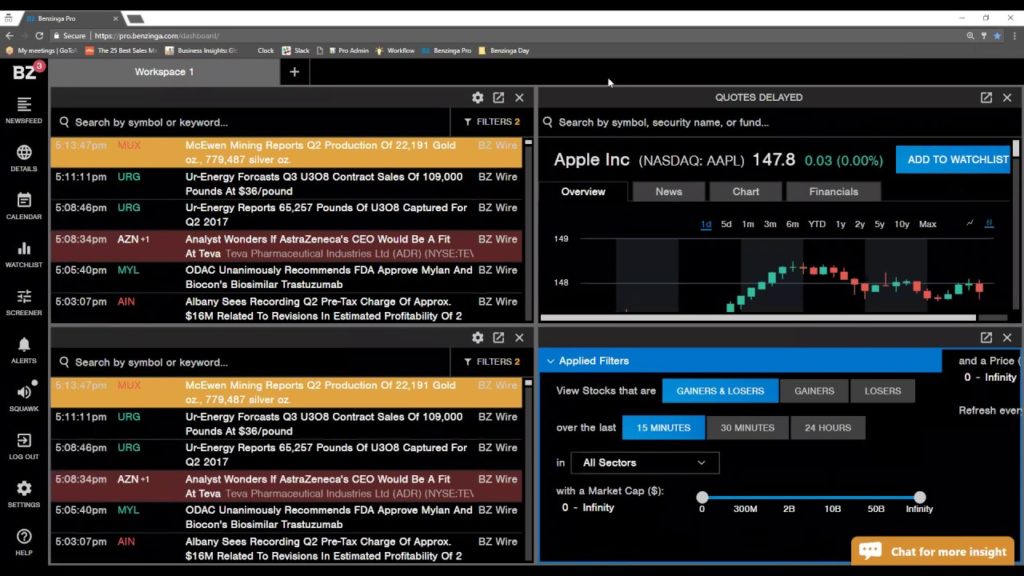
Benzinga Pro
Benzinga Pro is a news-based research platform that was founded in 2010. The platform sets itself apart by providing real-time news for fast pace traders. It also sports other features
Benzinga Pro’s feature set includes:
-
- Real-time news feed
- Stock screener
- Corporate earnings and events calendar
- Charts and visualization tools
- Financial statements and business ratios
- News Desk gives you personal access to a team of analysts
- Benzinga can get exclusive stories to their established brand in financial news
- Option alerts and penny stocks
-
The platform has two subscription plans available:
-
-
- Benzinga Pro Basic costs $99/month paid monthly or $79/month billed annually.
- Benzinga Pro Essential costs $177/month billed monthly and $117/month billed annually.
-
- Bloomberg Terminal
Bloomberg Terminal was founded 1981, and it’s grown to become one of the most extensive and expensive research terminals across the world. It’s a multi-functional stock research terminal where you can access real-time news, events, analytical tools, view company filings, manage portfolios, conduct research, place trades customize information, access research reports, and chat with other Bloomberg terminal users.
Bloomberg has data on more than 5 million bonds, equities, commodities, currencies, and funds across most major markets. Bloomberg Terminal’s features include:
-
-
-
-
-
- Data Visualization
- Research and Financial Analysis
- Charting and Visualization
- Risk Analysis
- Real-time news
- Place orders
- View and annotate documents
- Collaborate with other users
- Set alerts and monitor market news and events
- Events calendar
- and more
-
-
-
-
Bloomberg costs $24,000 per user per year and is apt for institutional investors.
Which Stock Research Tool is for you?
Most of the stock research tools listed on this page have a diverse set of features and datasets that may not overlap with the others in a given price-band. So, a good way to pick the best stock research tool for you would be to start with a budget and create a list of features you want for your research workflow. At this point, taking trials would give you a good indication of which stock research tool fits your criteria the best. This is a better assessment approach than outrightly declaring a winner or a loser from the list.
What do you think is the Best Stock Research Tool for you?
If you think we’ve missed out on a stock research tool, do let us know.
(Image credits: Designed by ijeab / Freepik)


