$49 per month*
.
Subscribe to Pro or Enterprise plans to unlock this feature.
Subscribe to Pro or Enterprise plans to unlock this feature.
Become a smarter investor today.
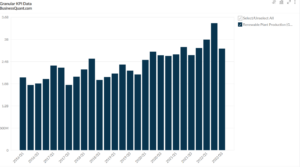
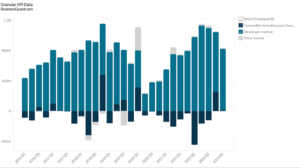
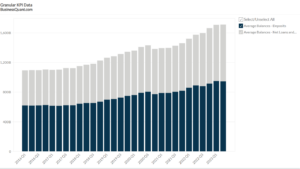
This statistic highlights Uber’s Revenue by Segment, split between ATG and other technology programs, All Other, Delivery, Freight, and Mobility, reported on a quarterly basis from Q1 2017 onwards.
Uber Technology Inc. is a technology platform that powers transportation from one location to another by using a large network, leading technology, operational excellence, and product expertise. The firm creates and maintains proprietary technological applications that enable a wide range of services on its platform. It connects customers with independent ride-sharing service providers as well as other modes of transportation, such as public transportation. In addition, the firm connects riders and other customers (Eaters) with restaurants, grocers, and other retailers with food, groceries, and other delivery service providers.
Uber Technology Inc. generates its revenue from the following segments:
| Segments | Q1 2020 | Q1 2021 | YOY Growth | Revenue Share in Q1 2021 |
| ATG and other technology programs | 0 | 0 | 0 | 0 |
| All Other | $55.00 | $8.00 | -85.45% | 0.28% |
| Delivery | $527.00 | $1,740.00 | 230.17% | 59.96% |
| Freight | $199.00 | $301.00 | 51.26% | 10.37% |
| Mobility | $2,470.00 | $853.00 | -65.47% | 29.39% |
| total | $3,251.00 | $2,902.00 | -10.74% | 100.00% |
(All figures in millions, except percentages)
ATG and other technology programs
The ATG and Other Technology Programs segment is mainly responsible for developing and marketing an autonomous car, ridesharing, and Uber Elevate technology. In 2020, this segment consistently generated $25 million in each quarter.
All Other
Other business activities that were not migrated are represented by “all other categories separate from other reconciling items” and are displayed under the All Other caption.
Uber’s revenue from the All Other segment decreased from $55 million in Q1 2020 to $8 million in Q1 2021, a decline of 85.45% on a year-on-year basis. During this period, this segment contributed 0.28% to Uber’s total revenue.
Delivery
Uber’s Delivery segment allows users to search for and locate nearby restaurants, order a meal, and either pick up at the restaurant or have the meal delivered in some regions, it also offers grocery and convenience store delivery, as well as select other items.
Uber’s Delivery segment contributed 59.96% of total revenue in Q1 2021 amounting to $1740 million. There was a 230.17% increase in revenue compared to Q1 2020 where the revenue generated was $527 million.
Freight
The freight segment is transforming the logistics business. Freight uses unique technology, brand recognition, and expertise-changing industries to link carriers with shippers on Uber’s platform, and provides carriers with upfront, transparent pricing and the opportunity to schedule a shipment.
Uber’s revenue from the Freight segment increased from $199 million in Q1 2020 to $301 million in Q1 2021, a growth of 51.26% on a year-on-year basis. During this period, this segment contributed 10.37% to Uber’s total revenue.
Mobility
Mobility refers to goods that connect users with Mobility Drivers who give rides in a variety of vehicles such as cars, auto-rickshaws, motorbikes, minibusses, or taxis. Mobility also includes operations connected to Uber for Business, Financial Partnerships, Transit, and Vehicle Solutions services.
Uber’s revenue from the Mobility segment decreased from $2470 million in Q1 2020 to $853 million in Q1 2021, a decline of 65.47% on a year-on-year basis. During this period, this segment contributed 29.39% to Uber’s total revenue. The COVID-19 pandemic and related restrictions, which disrupted usual travel patterns, caused the company to see lower quarter-over-quarter growth in Mobility in 2020.
Company Overview
Uber Technologies Inc. is an American technology company founded in March 2009 by Garrett Camp and Travis kalanick. It is headquartered in San Francisco, California, U.S. Uber’s technology is currently available in 71 countries worldwide, primarily in the United States and Canada, Latin America, Europe, the Middle East, Africa, and Asia. The company operates in over 900 metropolitan areas around the world. It is one of the most significant firms in the gig economy.
Uber has acquired 13 companies including Drizly And Autocab and invested in 18 others. The acquisition cost of the companies is more than $ 7.98 billion. The company faces tough competition from Lyft, Ola, DiDi, Grab, Bolt, Yandex. Taxi, Gett, Curb Mobility, Bird, LimeRoad. Uber went public on 9th May 2019 under ticker code “UBER”.
Did you like Uber’s Revenue by Segment statistic?
Access thousands of more such key performance indicator data points, on listed companies, with Business Quant.
You can also get started for free.

Always know what you’ll pay. No hidden costs or surprises.
* Billed annually, local taxes extra.
* Local taxes extra.

.
.