$49 per month*
.
Subscribe to Pro or Enterprise plans to unlock this feature.
Subscribe to Pro or Enterprise plans to unlock this feature.
Become a smarter investor today.
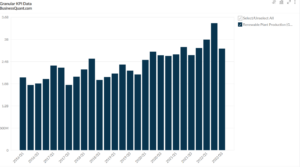
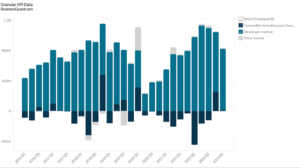
This statistic highlights Nexstar Media’s Revenue Breakdown Worldwide, split between Core advertising, Digital, Distribution, Political advertising, Trade and Other, reported on quarterly basis from Q1 2016 onwards.
The table below highlights Nexstar Media’s Revenue Breakdown Worldwide in some of its recent quarters.
| Segment | Q3 2020 | Q2 2021 | Q3 2021 | Contribution in Q3 2021 |
| Core advertising (local and national) | $381.93 | $423.46 | $432.07 | 37.36% |
| Digital | $55.23 | $73.42 | $81.08 | 7.01% |
| Distribution | $538.38 | $616.95 | $618.86 | 53.51% |
| Political advertising | $132.39 | $8.51 | $12.39 | 1.07% |
| Trade | $2.12 | $2.44 | $3.06 | 0.26% |
| Other | $0.81 | $6.811 | $8.94 | 0.77% |
| Total | $1,110.86 | $1,131.59 | $1,156.4 | 100.00% |
(All figures in millions, except percentages)
Nexstar Media’s total revenue has been on a constant rise. It increased from $1,110.86 million in Q3 2020 to $1,156.4 million in Q3 2021, making an increment of 4.1% on a year-on-year basis. When compared quarterly, the revenue witnessed rise of 2.2%, from $1,131.59 million in Q2 2021 to $1,156.4 million in Q3 2021.
Nexstar Media generates a major part of its revenue from the sales of its products in the Distribution category. In Q3 2021, 53.51% of its revenue was generated from the distribution category while only 1.07% of the revenue was generated from the political advertising segment. This is followed by 0.77% of the share of revenue of other categories in Q3 2021.
The distribution Nexstar’s revenue is bifurcated in the following ways:
Core Advertising
The Core advertising segment of Nexstar Media contributes 37.36% to the total revenue in the latest quarter of 2021. In Q3 2020, the company generated $432.07 million from the sale of its products in this category. The revenue breakdown witnessed an increase from $381.93 million in Q3 2020 to $432.07 million in Q3 2021 in a year. This indicates an incline of 11.60% on a year-on-year basis. When compared on a quarterly basis, the revenue witnessed a slight increase of 2.03%, from $423.46 million in Q2 2021 to $432.07 million in Q3 2021.
Digital
This category constituted 7.01% of the total revenue in Q3 2021. In this quarter, the company generated $81.08 million. The revenue from the Digital segment witnessed an increase from $55.23 million in Q3 2020 to $81.08 million in Q3 2021 in a year. This indicates an incline of 46.80% on a yearly basis. When compared on a quarter-on-quarter basis, the revenue increased by 10.43%, from $73.42 million in Q2 2021 to $81.08 million in Q3 2021.
Distribution
Contributing the maximum share of 53.51% to the total revenue in Q3 2021, the company generated $618.86 million from its distributing segment. The revenue from this segment witnessed an increase from $538.38 million in Q3 2020 to $618.86 million in Q3 2021, indicating an incline of 14.94% on a year-on-year basis. Quarterly, the revenue rose by 0.31%, as compared to $616.95 million in Q2 2021.
Political Advertising
This category contributes a small part of 1.07% to the revenue generated in Q3 2021, amounting to $12.39 million. Revenue from the Political Advertising segment witnessed a huge decrease from $132.39 million in Q3 2020 to $12.39 million in Q3 2021, indicating an absolute decrease of 90.64% on a yearly basis. When compared quarterly, it rose by 45.5%, as compared to $8.51 million in Q2 2021.
Trade
This segment constitutes a minor part of revenue, contributing 37.36% to the total revenue Q3 2021, amounting to $3.06 million from the sale of its products in this category. The revenue witnessed an increase from $2.12 million in Q3 2020 to $3.06 million in Q3 2021 in a year. This indicates an incline of 44.33% on a year-on-year basis. On a quarterly basis, the revenue increased by 25.4%, as compared to $2.44 million in Q2 2021.
Other
Constituting the smallest part of revenue, this segment contributes 0.77% to the total revenue in Q3 2021, amounting to $8.94 million. The revenue witnessed a tremendous increase from $0.81 million in Q3 2020 to $8.94 million in Q3 2021 on annual basis, indicating a huge incline of 1003% on a yearly basis. When compared quarterly, the revenue saw an increment of 31.25%, as compared to $6.811 million in Q2 2021.
With the purchase of Station WYOU in Scranton, Pennsylvania in 1996, Perry A. Sk, a pioneer, chairman, and CEO of the broadcasting industry, founded Nexstar, and more than 20 years later, local television and media stations were launched in the United States. Nexstar Media Group, Inc. is a US-listed media company headquartered in Irving, Texas, New York City, and Chicago. The company is the largest owner of television stations in the United States, owning 197 television stations in the United States, most of which are subsidiaries of four “big” US television stations. It also operates all channels owned by affiliates such as Mission Broadcasting and Vaughan Media under local marketing agreements. It also operates two terrestrial television channels, AntennaTV and RewindTV, which broadcast classic programming, and three pay-TV networks (Cable News & Entertainment Network, NewsNation, and Food & Cooking Networks).
Did you like Nexstar Media’s Revenue Breakdown Worldwide statistic?
Access more such KPI data points and segment financials on thousands of US stocks, with Business Quant.
You can get started here.

Always know what you’ll pay. No hidden costs or surprises.
* Billed annually, local taxes extra.
* Local taxes extra.

.
.