Net Income Margin (NIM), is a vitally important ratio used in the analysis of Banks and Non-Banking Financial Companies (NBFCs). It is an indicator of efficiency with which bank utilize their funds. NIM is defined as the difference between the interest received and the interest paid (interest cost borne) by a bank, as a proportion of its total assets. Let’s take a closer look at what the metric means and also see how different banks are stacked in terms of NIM.
Understanding NIM
Banks and NBFCs receive funds in the form of cash, time deposits, savings deposits or bonds, commercial papers(CPs) and corporate deposits (CDs). They use these funds to extend loans of various kinds such as retail loans, working capital, term loans, short term loans, project financing, etc. In return, banks/NBFCs receive interest from their borrowers.
This is the interest income. On the other hand, the banks are required to pay interest to the deposit holders, who have been the bank’s source of funds. The difference between these interests is the ‘Net Interest’ and NIM is calculated as a percentage of the ratio of net interest to the total assets of the bank.
A negative NIM indicates that the cost of funds for a bank is higher than the income that it is able to generate on them. Which is less than optimal scenario. A comparison of NIM across the industry can help demarcate efficient players from inefficient ones as a first measure.
NIM Rankings
Between 2014-2018, the average annual NIM of the players within the bank-NBFC segment has ranged between 3.88% (2014) and (6.07%), the Bank of Montreal (BMO) and JP Morgan & Chase (JPM) have been consistent outliers, outperforming substantially compared to the counterparts. BMO’s average annual NIM over 3 years ended 2018 was around 60.27%, whereas JPM’s NIM has averaged at 10.8% over the 5 years ended 2018.
Average NIM of all the other players, excluding these outliers has stood at 3.51% over 5 year period ended in 2018. Among them, Credicorp Ltd (BAP) leads the pack with average annual NIM averaging at 5.54% for 4 years ended 2018. This is followed by OFG Bancorp (OFG), whose average NIM over 5 years ended 2018 stood at 5.24%.
Several institutions have posted a performance lower than the industry average. Among them several are Canadian players including the Royal Bank of Canada (RY), whose average NIM over the last 5 years stood at 1.62%, substantially lower than the industry average. Some other Canadian players include the Canadian Imperial Bank of Commerce (CM) with a 4-year average annual (2014-2018) NIM of 1.66%, The Bank of Nova Scotia (BNS) with a 4-year average of 2.48% over the same period. The Canadian players have been posting lower NIMs on account of the low key interest rate set by the Bank of Canada, the Canadian central bank over the years.
Also among the laggards is Citigroup Inc ( C), one of the big four banks in the United States, whose average NIM over the last 5 years ended 2018 stood at 2.68%. In the case of a player like Citigroup whose assets are worldwide (around 160 countries) and who is in expansion mode in its growing economies, a deviation from the American average may be expected, as its performance reflects the consolidated performance of its subsidiaries globally.
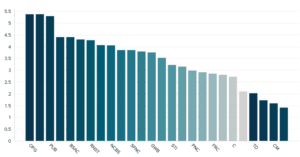
| Bank | Net Interest Margin by Bank in Q1 2019 |
| BNS | 13.80% |
| OFG | 5.37% |
| BAP | 5.37% |
| PUB | 5.29% |
| PVBC | 4.40% |
| BSAC | 4.40% |
| HOMB | 4.30% |
| RNST | 4.27% |
| UNTY | 4.06% |
| NCBS | 4.05% |
| SNL | 3.85% |
| SFNC | 3.85% |
| CMA | 3.79% |
| GWB | 3.75% |
| SFST | 3.52% |
| STI | 3.22% |
| OPB | 3.15% |
| PNC | 2.98% |
| WFC | 2.91% |
| FRC | 2.85% |
| FSB | 2.80% |
| C | 2.72% |
| TSC | 2.10% |
| TD | 2.02% |
| BMO | 1.72% |
| CM | 1.59% |
| RY | 1.41% |
The Quarterly performances over last 5 quarters too reflect these positions, with BAP leading again with average quarterly NIM of 5.39%.followed by OFG at 5.30% and People’s Utah Bancorp (PUB) at 5.26%. PUB was also the third top performer in terms of annual average NIM, excluding the outliers. BOM’s average quarterly NIM stood at 1.67% reflecting the situation of other Canadian players. Another exception is the BNS, whose average quarterly NIM stood at 13.82% in a substantial aberration from its average annual NIM of 2.43%.
Finally, the average annual NIM has been consistently increasing, with an average of 3.88% in 2014, 3.97% in 2015, 5.88% in 2016, 5.97% increase in 2017 and 6.07% in 2018. However, this cannot be considered as an indicator of increasing offtake as the average quarterly NIM has remained rangebound between 3.81%-3.84 over 4 quarters ended Q12019. This is important to note because the Federal Reserve Bank (Fed) had begun to increase its rates only since December 2017.
You can unlock more datasets such as this, Net Interest Margin by Bank, by registering for free.