$49 per month*
.
Subscribe to Pro or Enterprise plans to unlock this feature.
Subscribe to Pro or Enterprise plans to unlock this feature.
Become a smarter investor today.
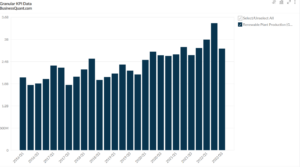
This statistic highlights Fiserv’s Revenue Breakdown Worldwide, split between Processing and services, and Product segments, reported on a quarterly basis from Q1 2016 onwards.
The following table highlights Fiserv’s Revenue by Business Vertical for Q3 2020, Q2 2021 & Q3 2021:
| Business Vertical | Q3 2020 | Q2 2021 | Q3 2021 | Contribution in Q3 2021 |
| Processing and services | $3153 | $3361 | $3407 | 81.84% |
| Product | $633 | $690 | $756 | 18.16% |
| Total | $3786 | $4051 | $4163 | 100.00% |
(All figures are in millions, except percentages)
Processing and Services
This revenue is generated from account and transaction-based fees. Processing and services fees are charged for:
This revenue is recognized in the period in which the specific service is performed. In case, the control of combined goods and services is not transferred, then they are not deemed distinct from other goods or services. Hence, in such a case the revenue would not be recognized until its transfer. Fiserv’s arrangements for processing and services typically consist of an obligation to provide specific services to their customers on a “when” and “if” needed basis. These services are typically provided under a fixed or declining price per unit, based on the volume of service. However, pricing for such services may also be based on minimum monthly usage fees. These fees are typically billed and paid monthly.
Processing and services revenue represents 82% of Fiserv’s total revenue in 2021. This revenue is most reflective of Fiserv’s business performance as a significant amount of its total operating profit is generated by these services. On a QoQ basis, this revenue increased by 1.3%. However, on a YoY basis, there was an increase of 8.1%. Moreover, on an overall basis since 2019, the revenue in each quarter has more than doubled from this vertical.
Product
Product revenue is generated from software license and hardware (POS devices) as well as from print and card production sales.
Product revenue represents 18% of Fiserv’s total revenue in 2021. On a QoQ basis, this revenue increased by 10.9%. Even on a YoY basis, there was a 20.9% increase in the revenue and overall has more than doubled since 2019.
About the Company
Fiserv, Inc. is a leading global provider of financial and payments services. They are publicly traded on the NASDAQ Global Select Market and part of the S&P 500 Index. They serve clients around the globe, including merchants, banks, credit unions, other financial institutions, and corporate clients. Fiserv helps its clients achieve best-in-class results through a commitment to innovation and excellence in areas including:
They provide services globally having their geographic teams across various regions: the United States and Canada; Europe, Middle East, and Africa; Latin America; and the Asia Pacific.
Did you like Fiserv’s Revenue Breakdown Worldwide statistic?
Access more such key performance indicator (KPI) data points and segment financials, on thousands of US stocks, with Business Quant.
You can get started here.

Always know what you’ll pay. No hidden costs or surprises.
* Billed annually, local taxes extra.
* Local taxes extra.

.
.