$49 per month*
.
Subscribe to Pro or Enterprise plans to unlock this feature.
Subscribe to Pro or Enterprise plans to unlock this feature.
Become a smarter investor today.
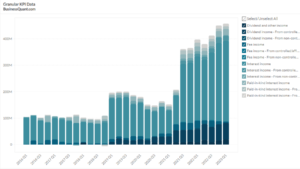
This statistic highlights Delta Airline’s Fuel Consumed, reported on a quarterly basis from Q1 2016 onwards.
Delta Air Lines is one of the major airlines in the United States. The airline serves more than 180 million customers each year and offers more than 15,000 daily flights. The company serves more than 300 destinations in about 50 countries with a fleet of 800 plus aircraft along with maintenance, repair, and cargo operations. The company is based in Atlanta, Georgia. About 70% of its revenue comes from the United States. Delta operates hubs in Amsterdam, Mexico City, New York, Seattle, Tokyo, and many other major airports. Their operations are divided into two segments: Airlines and Refinery. The airline segment includes passenger airlines and cargo. The refinery segment supplies and procures jet fuels for the airlines. Delta directly owns an oil refinery in Pennsylvania, operated by subsidiary Monroe Energy.
Owing to Delta’s massive fleet and the number of flights per day the airline uses about 3.4 billion gallons of fuel every year. Back in 2016, the fuel consumption was 930 million gallons in the first quarter,1.05 billion gallons in the second quarter,1.10 billion gallons in the third quarter, and 941 million gallons in the last quarter. Delta produces its own fuel from its’s refinery segment and obtains the shortfall from agreements with third parties. Fuel cost had been going up until the end of 2018 after which the prices saw a small downtrend almost throughout 2019.
In the first quarter of 2017, the consumption dropped down to 918 million gallons and then increased to 1.05 billion gallons in the second quarter, 1.11 billion gallons in the third quarter, and 959 million gallons in the fourth quarter.
The consumption then increased to 936 million gallons in the first quarter of 2018,1.07 billion gallons in the second quarter, 1.14 billion gallons in the third quarter, and 975 million gallons in the fourth quarter.
In 2019 the consumption had increased to 962 million gallons in the first quarter, 1.10 billion gallons in the second quarter, 1.15 billion gallons in the third quarter, and 999 million gallons in the fourth quarter.
As you can see the fuel consumption has increased for almost all quarters when compared to the same quarter in the previous year. The consumption has increased year on year as well from 4.02 billion gallons in 2016 to 4.03billion gallons in 2017 to 4.121 billion gallons in 2018 and 4.211 billion gallons in 2019. It was assumed that in the coming years the demand for fuel for Delta was going to increase, but with the Covid-19 outbreak airlines stopped functioning and therefore the fuel consumption has also stopped. Due to the nature of the outbreak, travel especially international is going to be one of the least attractive segments of this year and therefore the revenue and fuel costs for airlines, in general, will fall drastically. The fuel prices could also hit a low in the coming years as the demand for fuel has dried up this could help Delta in a cost reduction for the next few years. Delta can only hope the situation improves soon for its airlines to start functioning.
Did you like Delta Airline’s Fuel Consumed statistic?
Access more such KPI data points and segment financials on thousands of US stocks, with Business Quant.
You can get started here.

Always know what you’ll pay. No hidden costs or surprises.
* Billed annually, local taxes extra.
* Local taxes extra.

.
.