$49 per month*
.
Subscribe to Pro or Enterprise plans to unlock this feature.
Subscribe to Pro or Enterprise plans to unlock this feature.
Become a smarter investor today.
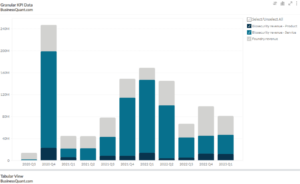
This statistic highlights Goldman Sachs’ Assets by Product Type, split across Corporate debt instruments, Loans and securities backed by commercial real estate, Loans and securities backed by residential real estate, and Others, reported on a quarterly basis from Q1 2016 onwards.
Goldman Sachs is a leading global financial institution that delivers a broad range of financial services to a large and diversified client base that includes corporations, financial institutions, governments, and individuals.
| Category | 2022 Q1 | 2022 Q2 | 2022 Q3 | 2022 Q4 | 2023 Q1 | Assets mix by Q1 2023 |
| Corporate debt instruments | $1,435 | $1,440 | $1,352 | $1,238 | $1,010 | 65% |
| Loans and securities backed by commercial real estate | $76 | $74 | $55 | $66 | $178 | 11% |
| Loans and securities backed by residential real estate | $78 | $110 | $110 | $88 | 0% | |
| Other | $332 | $456 | $311 | $20 | $370 | 24% |
| Total | $1,921 | $2,080 | $1,828 | $1,412 | $1,558 | 100% |
(All figures are in millions, except percentages)
Earlier in Q1 2022, the company had total revenue of $1921 million, earning from all segments (Corporate debt instruments, Loans and securities backed by commercial real estate, Loans and securities backed by residential real estate, Other). During the next year’s Q1 2023, company revenue from the segment declined to $1,558 million. This shows that on a YoY basis, the company’s revenue drops by 19%.
Corporate Debt Instruments:
Corporate debt instruments include corporate loans, debt securities, and convertible debentures. Significant inputs for corporate debt instruments are typically determined based on relative value analyses, which include comparisons to prices of credit default swaps that reference the same or similar underlying instrument or entity as well as to other debt instruments for the same or similar issuer for which observable prices or broker quotations are available.
In Q1 2022, Corporate debt instruments were $1435 million and by the end of Q1 2023, it was $1010 million. This shows that on a YoY basis, the company’s assets dropped by 29.61%. It has the highest contribution of 65%.
Loans and Securities Backed by Commercial Real Estate:
A single property or a collection of properties may be used as direct or indirect collateral for loans and securities backed by commercial real estate. These loans and securities may also comprise tranches with different levels of subordination.
From last two quarters, it is constantly increased. In Q4 2022, Loans and securities backed by commercial real estate were $66 million and by the end of Q1 2023, it was $178 million. This shows that on a QoQ basis, the company’s assets had risen by a huge 169%. It has a contribution of 11%.
Loans and Securities Backed by Residential Real Estate:
Portfolios of residential real estate may serve as direct or indirect collateral for loans and securities backed by residential real estate, and these tranches may have different subordination levels. Relative value studies, which take into account comparisons between instruments with comparable collateral and risk profiles, are typically used to assess whether inputs are significant.
In Q1 2022, Loans and securities backed by residential real estate were $78 million but at the end of Q4 2022, it was $88 million. Assets in this category have increased by 12.82%.
Other:
In Q1 2022, Others Assets was $332 million and by the end of Q1 2023, it was $370 million. This shows that on a YoY basis, the company’s assets increased by 11.24%. It has a contribution of 24%.
About Goldman Sachs:
Goldman Sachs is a multinational investment banking and financial services company headquartered in New York City. It was founded in 1869 by Marcus Goldman and has since grown to become one of the leading investment banks in the world. The firm manages and reports its activities in three business segments which are Global Banking & Markets, Asset & Wealth Management, and Platform Solutions.
Did you like Goldman Sachs’ Assets by Product Type statistic?
Access more such KPI data points and segment financials on thousands of US stocks, with Business Quant.
You can get started here.

Always know what you’ll pay. No hidden costs or surprises.
* Billed annually, local taxes extra.
* Local taxes extra.

.
.